Abstract
In contrast to the clinically used microbubble ultrasound contrast agents, nanoscale bubbles (or nanobubbles) may potentially extravasate into tumors that exhibit more permeable vasculature, facilitating targeted molecular imaging and drug delivery. Our group recently presented a simple strategy using the non-ionic surfactant Pluronic as a size control excipient to produce nanobubbles with a mean diameter of 200 nm that exhibited stability and echogenicity on par with microbubbles. The objective of this study was to carry out an in-depth characterization of nanobubble properties as compared with Definity microbubbles, both in vitro and in vivo. Through use of a tissue-mimicking phantom, in vitro experiments measured the echogenicity of the contrast agent solutions and the contrast agent dissolution rate over time. Nanobubbles were found to be more echogenic than Definity microbubbles at three different harmonic frequencies (8, 6.2 and 3.5 MHz). Definity microbubbles also dissolved 1.67 times faster than nanobubbles. Pharmacokinetic studies were then performed in vivo in a subcutaneous human colorectal adenocarcinoma (LS174T) in mice. The peak enhancement and decay rates of contrast agents after bolus injection in the liver, kidney and tumor were analyzed. No significant differences were observed in peak enhancement between the nanobubble and Definity groups in the three tested regions (tumor, liver and kidney). However, the decay rates of nanobubbles in tumor and kidney were significantly slower than those of Definity in the first 200-s fast initial phase. There were no significant differences in the decay rate in the liver in the initial phase or in three regions of interest in the terminal phase. Our results suggest that the stability and acoustic properties of the new nanobubble contrast agents are superior to those of the clinically used Definity microbubbles. The slower washout of nanobubbles in tumors suggests potential entrapment of the bubbles within the tumor parenchyma.
Keywords: Ultrasound contrast agents, Nanobubble, Pharmacokinetic study, Cancer
INTRODUCTION
Intravenously administered ultrasound contrast agents are used to image blood flow dynamics in organs by medical ultrasonography. These contrast media are composed of microbubbles responding non-linearly to the incident ultrasound wave, typically exceeding 100 kPa in acoustic pressure. This response is due to the resonance property of a microbubble, that is, its ability to produce asymmetric oscillations in diameter and, therefore, generate harmonic components in the echographic signal. Propagation of the ultrasound wave also generates a non-linear response in biologic tissues, but to a lesser extent than for microbubbles. This specificity led to the integration of contrast detection schemes into most clinical ultrasound imaging systems, in particular, pulse inversion, pulse amplitude modulation techniques or a combination, as a way of enhancing the microbubble signal while canceling the tissue signal. The introduction of contrast-specific imaging techniques played a key role in driving a vast number of clinical research initiatives (Piscaglia et al. 2012) with applications in the localization and characterization of focal liver lesions, which has become routine in Europe today (Anaye et al. 2011; Rognin et al. 2010). In the near future, perfusion quantification by contrast-enhanced ultrasound will gain momentum, giving the oncology community a means to monitor the efficacy of pharmacologic therapy of cancerous tumors (Lassau et al. 2011). The clinical translation of ultrasound molecular imaging (Klibanov et al. 1997; Lindner et al. 2001), using ligand-decorated microbubbles to target molecular markers expressed by angiogenesis (Tardy et al. 2010), will be the ultimate application in terms of early tumor detection. Furthermore, the use of microbubbles as vehicles for local drug delivery is an emerging field under investigation in targeted cancer therapies (Wei 2011). In particular, it will allow reduction of the therapeutic dose and attenuation of systemic side effects.
Ranging from 1 to 10 µm in diameter, microbubbles remain confined in the vascular compartment, making them purely intravascular agents. This presents the advantage of a more objective assessment of the microvascular architecture (Elie et al. 2007; Krix et al. 2004; Kuenen et al. 2011; Mischi et al. 2012), in contrast to other medical imaging modalities, such as computed tomography, magnetic resonance imaging and positron emission tomography, which generally use diffusible contrast agents. A specialty of the ongoing research on ultrasound contrast agents is the development of a new generation of bubbles on the nanoscale, called nanobubbles (Krupka et al. 2010; Xing et al. 2010; Wang et al. 2010; Wheatley et al. 2006). Tumor vessels lack tight junctions and may exhibit open pores at inter-endothelial junctions compared with normal vasculature. Studies have indicated that the pore size ranges from 380 to 780 nm (Hobbs et al. 1998). Nanobubbles may potentially extravasate by passing the capillary barrier to reach cells at the tumor cell target site for targeting molecular imaging and drug delivery. As the permeability of tumor vasculature is higher than that of normal tissue, nanobubbles are more likely to accumulate in tumors by extravasation, a process called passive targeting. These properties provide a rational basis for developing molecular diagnostic agents and drug delivery agents.
Although previous methodologies have been developed to reduce bubble size, most of these strategies involve manipulations of microbubbles post-formulation, such as gradient separation by gravitational forces or by physical filtration or flotation (Wang et al. 2010; Wheatley et al. 2006; Xing et al. 2010). These methods introduce the potential for sample contamination, reduce bubble yield and stability and waste stock materials in addition to being labor intensive. Our group has presented a simple strategy using Pluronic as a size control excipient to produce nanobubbles and the preliminary results of its stability and echogenicity with a mean diameter of 200 nm (Krupka et al. 2010).
The objective of this study was to carry out an in-depth characterization of nanobubble properties as compared with Definity microbubbles (Lantheus Medical Imaging, North Billerica, MA, USA), typically used in clinical routine. The experimental protocol includes both in vitro and in vivo assessments by means of a clinical ultrasound imaging system. The in vitro experiment measured the echogenicity of the contrast agent solution in suspension with respect to a tissue-mimicking phantom. In addition, the contrast agent dissolution rate was evaluated under the same conditions. Echogenicity findings were then verified in vivo in a murine model. Finally, pharmacokinetic analysis was carried out to evaluate the distribution of nanobubbles versus microbubbles, yielding insights into the capacity of nanobubbles to leave the vascular space by extravasation.
METHODS
Contrast agents
Definity microbubbles were purchased from Lantheus Medical Imaging. The preparation of lipid-Pluronic nanobubbles was reported in our previous article (Krupka et al. 2010). In brief, 1,2-dipalmitoyl-sn-glycero-3-phosphocholine (DPPC), 1,2-dipalmitoyl-sn-glycero-3-phosphoethanolamine (DPPE) and 1,2-dipalmitoyl-sn-glycero-3-phosphate (DPPA) (Avanti Polar Lipids, Alabaster, AL, USA) were dissolved in chloroform and aliquoted into 2-mL vials; this was followed by evaporation of the solvent and hydration with a solution of phosphate-buffered saline (PBS) and Pluronic L61 (Poloxamer 181, BASF, Shreveport, LA, USA) in the presence of glycerol to produce lipid vesicles. The lipid films were hydrated at 37°C in an incubator-shaker at 120 rpm for 60 min (New Brunswick Scientific, Enfield, CT, USA). Next, the vials were sealed, air was withdrawn with a syringe and octafluoropropane was added to the vials until the pressure in the vial was equalized. Finally, the vial was placed on a VialMix shaker (Bristol-Myers Squibb Medical Imaging, North Billerica, MA, USA) for 45 s to form the bubbles.
In vitro setup
The in vitro setup (Rognin 2002) consists of a 1000-mL glass beaker placed on a magnetic stirrer (VELP Scientifica, Usmate, Italy) to agitate the ultrasound contrast agent diluted in 800 mL of 0.9% sodium chloride solution (LabChem, Pittsburgh, PA, USA). Accurate agent dilutions were obtained with an electronic micropipet equipped with a 0.5- to 10-,µL volumetric module (Socorex Isba, Lausanne, Switzerland). As illustrated in Figure 1a, a custom-designed rubber-based tissue-mimicking phantom (ATS Laboratories, Bridgeport, CT, USA) was submerged in the saline solution to produce a reference echo signal. Images were acquired with a clinical ultrasound imaging system (AplioXG SSA-790A, Toshiba Medical Imaging Systems, Otawara-Shi, Japan) equipped with three transducers—PLT-1204BT (7- to 14-MHz linear array), PLT-805AT, and PVT-375AT—using the contrast harmonic imaging mode. The system was modified as a prototype to implement a lower frame rate (<1.0 frames/s [fps]) to acquire long-time image sequences. The imaging mode is advanced pulse-subtraction (APS) based on the combination of pulse amplitude and phase modulation.
Fig. 1.
(a) Diagram of the in vitro experimental setup. (b) Regions of interest on contrast image defined in the tissue mimicking phantom (dashed line) and contrast agent (solid line), respectively.
In vitro echogenicity of contrast agents study
The in vitro echogenicity of nanobubbles and Definity microbubbles was determined for five concentrations (from 1/7500 to 1/607,500). The bubbles were dissolved in PBS (pH 7.4). For each concentration, contrast harmonic images of the bubbles were acquired at three different harmonic frequencies: 8 MHz (probe PLT-1204BT), 6.2 MHz (probe PLT-805AT) and 3.5 MHz (probe PVT-375AT). The imaging settings used were: mechanical index (MI) = 0.1; dynamic range = 65 dB; gain = 80 dB; frame rate = 5 fps; image acquisition time = 4 s. Linear raw data images were stored for analysis. The experiment was repeated three times.
In vitro contrast agents dissolution study
The imaging settings used to explore the contrast agent dissolution rate over time were: harmonic frequency = 8.0 MHz (probe PLT-1204BT); MI = 0.1; dynamic range = 65 dB; gain = 80 dB; imaging frame rate = 0.2 Hz; image acquisition time = 4 s. Linear raw data images were stored for analysis. The experiment was repeated three times.
In vivo setup
Animals were handled according to a protocol approved by the Institutional Animal Care and Use Committee at Case Western Reserve University and in accord with all applicable protocols and guidelines with respect to animal use. Athymic nude mice (NCRnu/nu) were purchased from the Athymic Animal and Xenograft Core Facility of Case Western Reserve University. Before all procedures, the animals were anesthetized by inhalation of 3% isoflurane with 1 L/min oxygen. For tumor inoculation, human colorectal adenocarcinoma LS174T cells were maintained in Eagle’s minimum essential medium (Catalog No. 30–2003, ATCC, Manassas, VA, USA) using standard techniques. On the day of injection, the cells were detached with trypsin-ethylenediaminetetraacetic acid, washed and resuspended (1 × 10⁷ cells/mL) in a 1:2 mixture of medium and Matrigel (BD Biosciences, San Jose, CA, USA). Two hundred microliters of the tumor cell-Matrigel mixture was injected subcutaneously into the flank of 10 mice.
Ten days after inoculation, once the tumor diameter reached ≥ 0.5 cm, the animals were randomly divided into the nanobubble (n = 5) and Definity microbubble (n = 5) groups. To acquire ultrasound images, each animal was placed in the left lateral position, and the same ultrasound probe (PLT-1204BT) used in vitro was placed longitudinally to the axis of the animal body. The probe was immobilized using a clamp and was adjusted so that the field of view included liver, kidney and tumor. Contrast harmonic imaging (CHI) was used to image changes in tissue contrast density as a function of time using the following imaging settings: CHI frequency, harmonic frequency = 8.0 MHz; MI = 0.08; dynamic range = 65 dB; gain = 80 dB; imaging frame rate =12 frames/min. The images were acquired in the raw data format. For contrast agent administration, 30 µL of Definity microbubbles or nanobubbles from the mixed vial was diluted to 1 mL with normal saline, and 100 µL of the diluted bubble solution was administered through the tail vein 30 s after the start of the raw data acquisition. The preliminary study indicated that this method of dilution is the optimal dose for both kinds of contrast agent in mice. The total image acquisition time was 12 min.
Data analysis
The acquired linear raw data images were processed with CHI-Q quantification software (Toshiba Medical Imaging Systems, Otawara-Shi, Japan). For in vitro studies, as seen in the contrast image in Figure 1b, two rectangular regions of interest (ROI) were drawn at the same depth (2 cm) to delineate the tissue phantom (green rectangle) and the contrast agent (red rectangle). The mean linear echo-power values of two ROIs were exported into Excel (Microsoft, Redmond, WA, USA) to estimate the contrast agent-to-tissue ratio (ATR) expressed in decibels (Bouakaz et al. 1996) and the agent dissolution rate over time. The ATR represents the relative echogenicity between the contrast agent and the tissue phantom. For the comparison of bubble echogenicity in vitro, the echo-power value was averaged over 10 contrast images to reduce the effect of noise in calculation of the ATR. For the analysis of contrast dissolution rate data, the echo-power signal as a function of time was fit using simple linear regression in Excel (Microsoft), where the value of the slope parameter was associated with the contrast agent dissolution rate. The microbubble-to-nanobubble ratio in the dissolution rate was used to compare the two contrast agents.
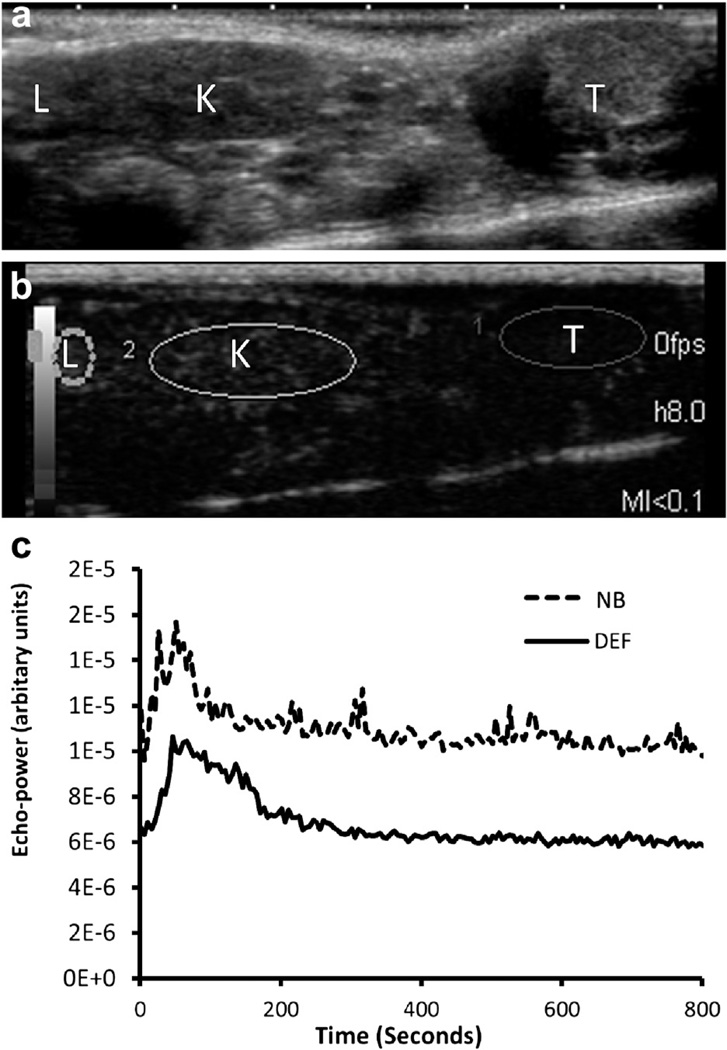
For in vivo studies, ROIs were drawn outlining the liver, kidney and subcutaneous tumor. The mean echo-power value in each ROI as a function of time, also called the time-intensity curve (TIC), was calculated and exported into an Excel-compatible format for statistical analysis. ROI selection and representative TICs in tumors for nanobubbles and Definity microbubbles are illustrated in Figure 2. To analyze the decay of ultrasound contrast, the baseline was first subtracted from the TIC. Next, the peak value of the TIC was calculated, and data were normalized to the peak value to obtain a normalized TIC. The normalized TICs were averaged over five animals in each group in a time analysis window of 200 s starting after the peak value. Finally, data on a logarithmic scale were fit using simple linear regression to derive the decay slope.
Fig. 2.
(a, b) Regions of interest (ROIs) outlining liver (L), kidney (K) and tumor (T). (c) Typical time-intensity curves in tumor indicating that nanobubbles (NB) have a higher echo-power amplitude than Definity microbubbles (DEF).
Statistics
All values are expressed as the mean ± standard Q2 deviation (SD). Student’s t-test was used to compare the difference in parameters between two groups. A p value <0.05 was considered statistically significant.
RESULTS
In vitro acoustic characterization
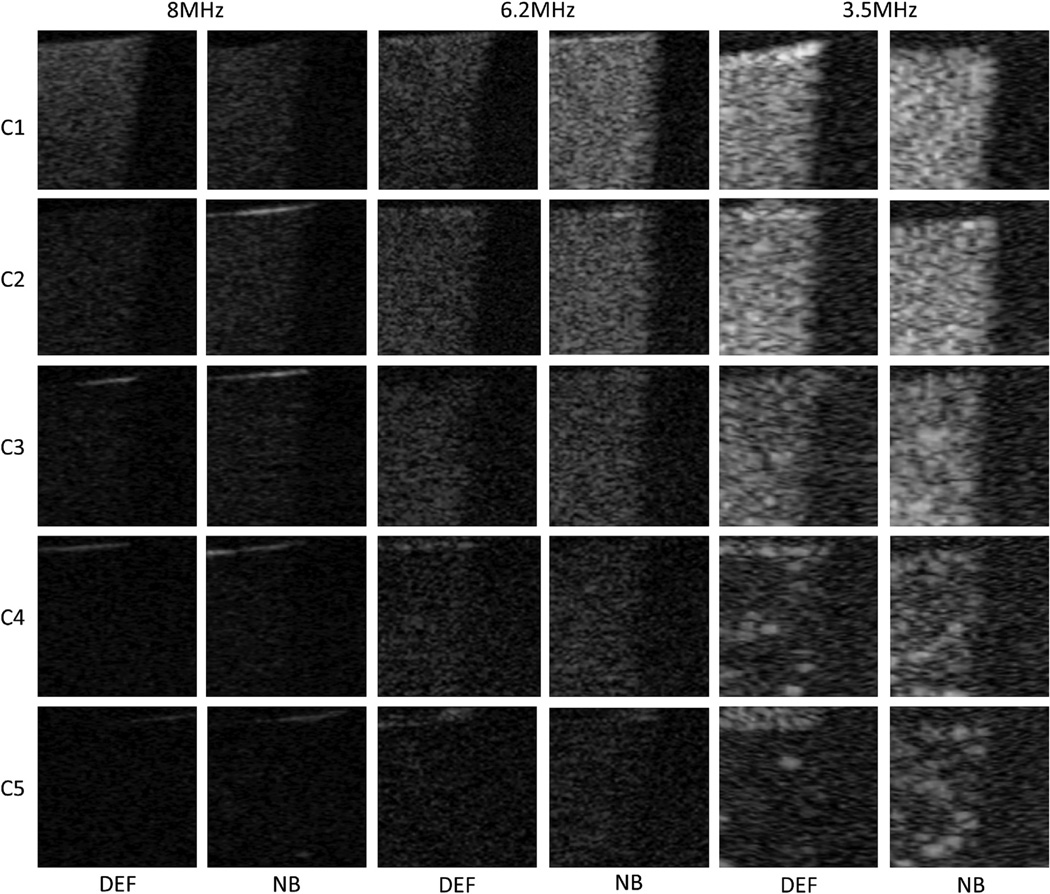
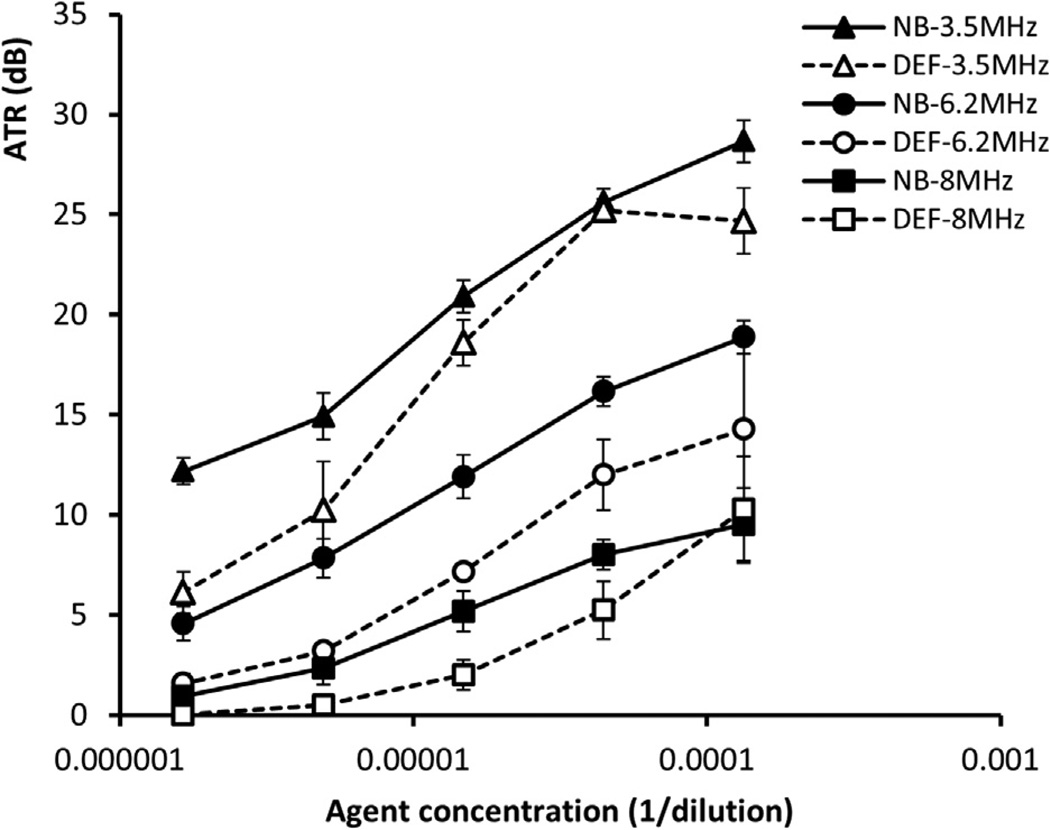
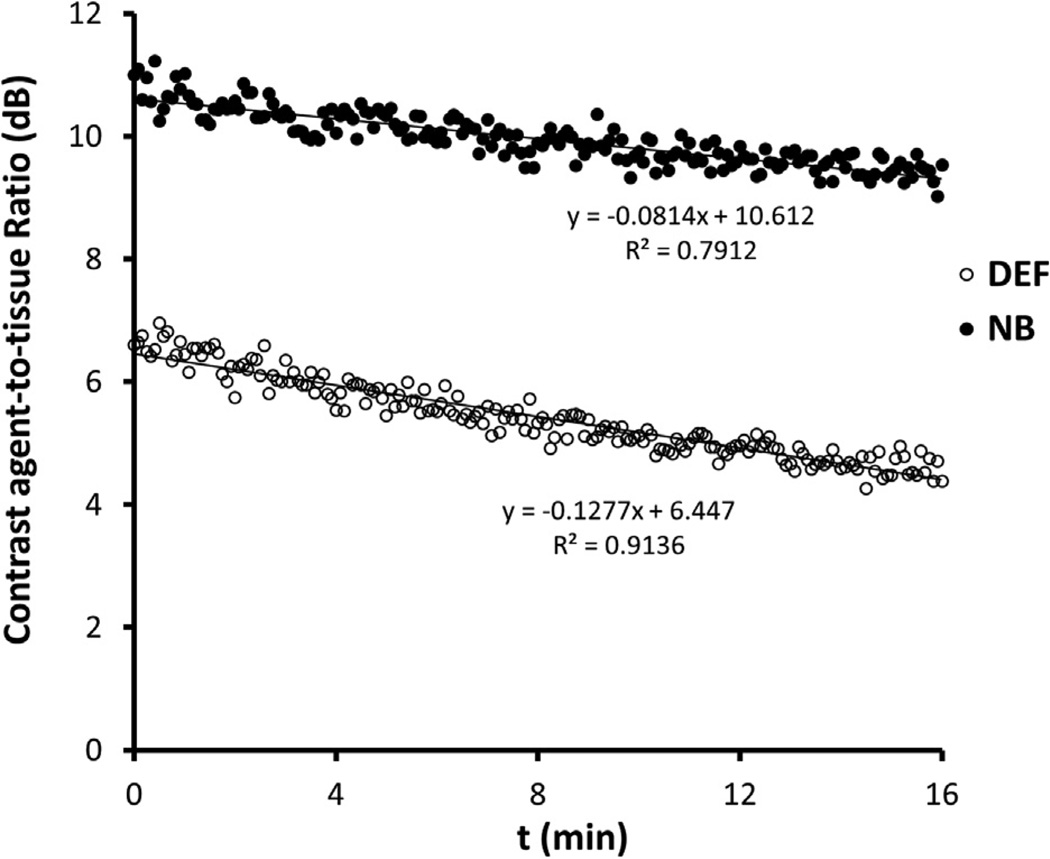
In Figure 3 are harmonic images of the nanobubbles and Definity microbubbles for decreasing concentrations (in dilution C1: 1/7500; C2: 1/22,500; C3: 1/67,500; C4: 1/202,500; C5: 1/607,500) at three different harmonic frequencies (8, 6.2 and 3.5 MHz). Qualitative observation revealed that the lower the harmonic frequency, the higher the bubble echogenicity. For the highest concentration, C1, shadowing effects were observed at the three harmonic frequencies. The ATRs are plotted in Figure 4 as a function of concentration for both nanobubbles and microbubbles. The ATR of nanobubbles was significantly higher than that of microbubbles at lower concentrations (C2–C5) except for C2 at 3.5 MHz. At these four concentrations, the nanobubbles were found to be 2.32–6.06, 2.99–4.76 and 0.91–3.17 dB more echogenic than micro-bubbles at 3.5, 6.2 and 8.0 MHz, respectively. At the highest concentration (C1), no significant difference was observed between nanobbubles and microbubbles at 6.2 and 8 MHz. Although a significantly higher ATR was noted for nanobubbles than for micobubbles at 3.5 MHz at C1, this might not be real due because of the shadowing effect caused by the high concentration of contrast agent. In Figure 5 is a representative example of dissolution curves at 8 MHz. The decay rates of Definity microbubbles and nanobubbles were −0.142 ± 0.012 and −0.067 ± 0.011 dB/min, respectively (p = 0.001). The resulting microbubble-to-nanobubble ratio in decay rate, referred to as the decay-slope ratio (DSR), was 2.12. This DSR value means that microbubbles dissolved 2.12 times faster than nanobubbles. The in vitro DSR was also compared with the in vivo DSR, as described in the Discussion.
Fig. 3.
Contrast harmonic images of nanobubbles (NB) and Definity microbubbles (DEF) atdifferent concentrations (from 1/7,500 to 1/607,500) at three different harmonic frequencies (8, 6.2 and 3.5 MHz). Qualitative observation indicates that the lower the harmonic frequency, the higher the bubble echogenicity. At the highest concentration, C1, shadowing effects are observed at the three harmonic frequencies.
Fig. 4.
Contrast agent-to-tissue ratio (ATR) as function of agent concentration of nanobubbles (NB) and Definity microbubbles (DEF). The ATR of nanobubbles is higher than that of microbubbles under most of the tested conditions.
Fig. 5.
Example of the dissolution curves of nanobubbles (NB) and Definity microbubbles (DEF) for calculation of the decay-slope ratio (DSR).
In vivo characterization of bubble distribution
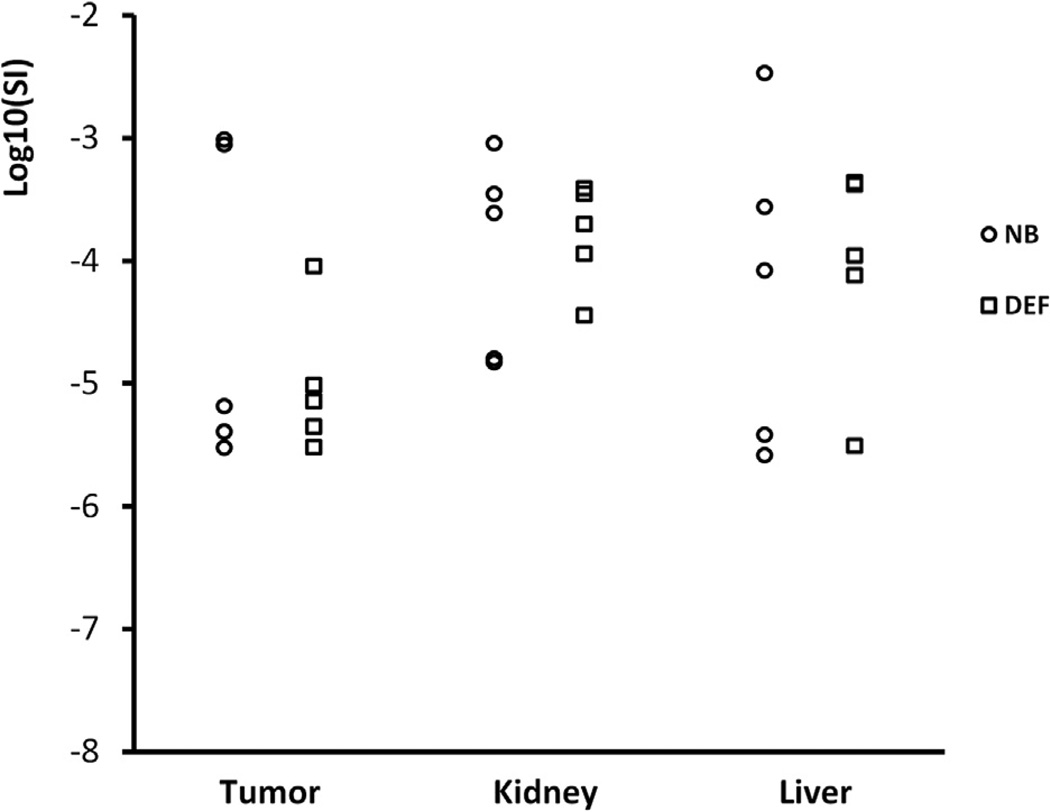
After contrast administration, contrast enhancement was rapid in the wash-in phase, which was followed by a more gradual wash-out. The TICs in tumors for nanobubbles and Definity microbubbles are illustrated in Figure 2c. No significant differences were observed in peak enhancement between the nanobubble and Definity microbubble groups in the three tested regions (tumor, liver and kidney), as indicated in Figure 6.
Fig. 6.
Peak enhancement in regions of interest placed in the tumor, kidney and liver indicating that there is no significant difference between nanobubbles (NB) and Definity microbub-bles (DEF).
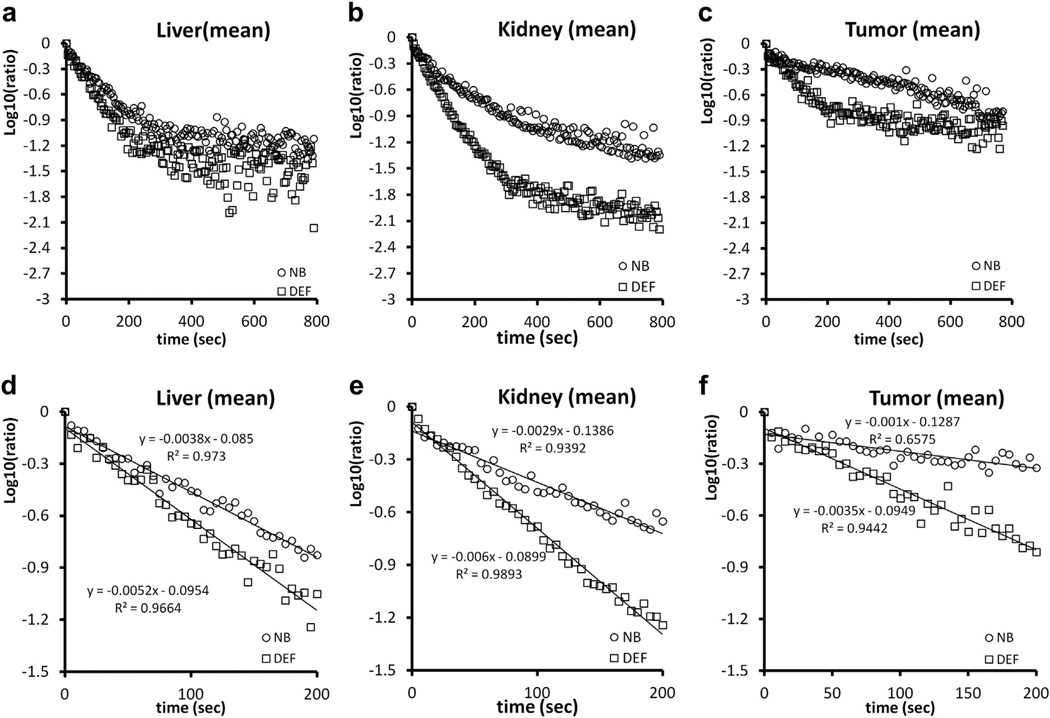
Bubble disappearance included an initial phase and a terminal phase. The terminal phase commonly started 200 s after peak enhancement. The normalized TICs after peak enhancement are plotted in Figure 7(a–c). In Figure 7(d–f) are the normalized TICs of the initial phase. The decay slopes of nanobubbles in tumor and kidney were significantly slower than those of Definity microbubbles. There were no significant differences in the decay slope of the liver during the initial phase, and no significant differences were noted in the terminal phase (Table 1). In the initial phase, the DSRs, indicating the rate of bubble dissolution, were 1.47, 2.31 and 3.30 in liver, kidney and tumor, respectively. The mean half-lives of Definity microbubbles in the initial phase were 0.98, 0.77 and 1.20 min in liver, kidney and tumor, respectively. The elimination of nanobubbles in the kidney and tumor was significantly slower than that of Definity microbubbles. The mean half-lives of nanobub-bles were 2.06 and 4.16 min in kidney and tumor, respectively. Although the elimination of nanobubbles in the liver (half-life = 1.61 min) was slower than that of Definity microbubbles, the difference was not statistically significant.
Fig. 7.
Mean decay curves of nanobubbles (NB) and Definity microbubbles (DEF) in regions of interest in the liver, kidney and tumor. Bubble disappearance comprises an initial phase (within 200 s after peak enhancement) and a terminal phase. (a–c) Normalized time-intensity curves after peak enhancement. (d–f) Normalized time-intensity curves of the initial phase. The decay slopes of nanobubbles in tumor and kidney are significantly slower than those of Definity microbubbles.
Table 1.
Elimination rate constants (dB/min)
| Initial phase |
Terminal phase |
|||||
|---|---|---|---|---|---|---|
| Region of interest | Nanobubble | Definity | p-value | Nanobubble | Definity | p-value |
| Liver | −2.298 ± 1.189 | −3.382 ± 1.212 | 0.191 | −0.523 ± 0.488 | −0.587 ± 0.495 | 0.841 |
| Kidney | −1.929 ± 0.802 | −4.450 ± 1.963 | 0.025 | −0.597 ± 0.316 | −0.442 ± 0.447 | 0.544 |
| Tumor | −0.798 ± 0.282 | −2.631 ± 0.699 | <0.001 | −0.465 ± 0.271 | −0.234 ± 0.184 | 0.152 |
DISCUSSION
Evaluation of lipid-shelled bubble pharmacokinetics in either humans or animals is difficult because of the fragile nature of the contrast agents, which impedes direct measurement of bubble concentration in sampled fluids or tissues. As an alternative approach to direct measurement, some investigators have measured the encapsulated gas, octafluoropropane (OFP), in pharmacokinetic studies of microbubbles in humans. On the basis of the prescribing information for Definity, OFP concentrations in blood were found to decline in a mono-exponential fashion, with a mean half-life of 1.3 min in healthy humans (Platts and Fraser 2011). However, measurement of OFP is complicated and does not provide a direct measurement of the intact bubble concentrations. Other studies have reported that microbubble linearized image intensity on ultrasound images is proportional to contrast agent concentration within a certain range (Lampaskis and Averkiou 2010). It was also suggested that the time-intensity curve of contrast-enhanced ultrasound (CEUS) can mimic the pharmacokinetic concentration-time curve of bubbles (Hung et al. 2011). In the present study, we observed the pharmacokinetic features of nanobubbles and Definity microbubbles in tumor-bearing mice using CEUS techniques similar to the published procedures (Hung et al. 2011).
In this study, we first compared the in vitro echogenicity of nanobubbles and Definity microbubbles at three harmonic frequencies. We observed shadowing effects in both bubble types at the highest concentration (C1). This indicates we were using optimal or comparable concentrations in our study. The two kinds of contrast agent behaved differently at the three different harmonic frequencies. At lower concentrations (C2–C5), the echogenicity of nanobubbles was higher than that of Definity microbubbles at each of the frequencies tested. However, at higher concentrations (C1), the differences were not consistent at the three frequencies tested. We hypothesize that these differences might be a function of three factors: resonance size at different harmonic frequencies, shell components, actual bubble concentrations. To achieve good spatial resolution in the subsequent in vivo studies with mice, we chose to perform harmonic imaging at 8 MHz.
Results from the in vitro dissolution study indicate that nanobubbles were more stable than Definity microbubbles under our experimental conditions. The structure of nanobubbles differs from that of Definity microbubbles by incorporation of the nonionic surfactant molecule, Pluronic L61 into the lipid nanobubble shell. Because of its amphiphilic properties, it has been hypothesized that the surfactant folds and intercalates between the hydrophobic lipid components while the hydrophilic poly ethylene oxide (PEO) groups remain on the surface (Wu et al. 2004). This structure can improve stability in two ways. First, the lipid packing and curvature of the lipid shell may be altered. Second, the PEO tails create a protective coating on the nanobubbles’ surface, akin to poly(ethylene glycol) coating of the Definity micro-bubbles. The combination may lead to extended stability in vitro and in vivo.
Our results obtained with CEUS imaging and the corresponding data analysis indicated that the 12-min TIC in murine liver, kidney and subcutaneous tumor did not follow mono-exponential decay. However, when the TIC was separated into two phases, a fast initial phase (first 200 s) and a terminal phase, both phases followed mono-exponential functions. At the end of the first phase, nearly 90% of the contrast signal intensity generated by both bubble types in the liver and kidney was lost. This suggests that the main clearance of both Definity microbubbles and nanobubbles occurs in the initial phase. The persistence of contrast signal depends on the rate microbubbles are removed from circulation through dissolution of the gas core, filtering by the lungs and spleen and uptake by macrophages (Ferrara et al. 2009). However, it is at this point unclear which microbubble elimination mechanism dominated in the contrast decay observed in our studies.
One factor that affects the rate of bubble clearance is bubble size. It has been reported that smaller microbubbles are able to more efficiently traverse pulmonary capillary beds (4–9 µm in rats) (Short et al. 1996) and the red pulp meshwork of the spleen (0.2–0.5 µm) (Bouakaz et al. 1998; Moghimi 1995; Tartis et al. 2008; Willmann et al. 2008). Capture by macrophages associated with the reticular endothelial system (RES) is also a mechanism of ultrasound contrast clearance. Lipid-based microbubbles are rapidly phagocytosed by activated neutrophils and monocytes, a process that depends on rapid surface opsonization. Adding poly(ethylene glycol) to the shell of particles can inhibit particle uptake by the RES, referred to as the ‘‘stealth function’’ (Discher and Eisenberg 2002; He et al. 2007). Coating the shell with Pluronic has also been found to decrease uptake of nanoparticles by macrophages (Zhang et al. 2008), presumably because of the presence of hydrophilic PEO groups on the particle surface. Our nanobubbles also have PEO groups on the surface, which could reduce uptake by the RES in a similar manner. Particle size also influences RES clearance. Previous studies have reported that both the extent of hepatic uptake of liposomes and opsonization decreased with decrease in liposome size (from 800 to 200 nm in diameter) (Harashima et al. 1994; Ishida et al. 2002). Although a similar study on gas-filled bubbles has not been reported, we can speculate that the extent of opsonization on lipid-based bubbles of different sizes follows a similar trend.
Microbubble persistence may also be governed by dissolution of the gas core, which is brought about by Laplace overpressure, blood pressure and under-saturation of the filling gas. If dissolution is the dominating limitation mechanism, then larger microbubbles would be expected to circulate longer (Borden and Longo 2002; Sarkar et al. 2009). Sirsi et al. (2010) explored the effect of microbubble size (1–8 µm) on persistence time in mice using a 40-MHz probe. They found that larger microbubbles (6–8 µm) persist longer in the bloodstream, and they predicted that dissolution of the gas core is the dominant mechanism of microbubble clearance. For liver imaging, microbubbles can be trapped in the liver parenchyma. This leads to a much longer liver enhancement phase (Forsberg et al. 2002).
As neither of the bubble formulations can be trapped in or filtered by the kidney, the pharmacokinetic profile in the kidney may represent the bubble clearance from the circulation. Our in vivo study indicated that the decay rate of nanobubbles in the kidney was significantly lower than that of Definity microbubbles in the first 200 s. This suggests that nanobubbles may be more stable and may have a longer circulation time than Definity microbubbles. We observed that both nanobubbles and microbubbles were cleared much slowly in the liver than in the kidney; however, the difference was not significant. This may imply that phagocytosis by macrophages may be one of the main mechanisms of clearance of both our nanobubbles and Definity microbubbles. The slower clearance in kidney and liver of our nanobubble might be due to the changes in the lipid shell and the addition of surfactant to the nanobubble formulation.
Extravasation into the extravascular space in tumor tissue is a potential advantage of nanobubbles and a parameter that will be crucial to potential future applications of these agents in tumor detection and drug delivery. In this study, we noted that the decay constant of nanobubbles in tumor tissue was much smaller than that of Definity microbubbles. The DSR of Definity microbubbles to nanobubbles in tumors was 3.30, which was higher than those in kidney and liver (1.47 and 2.31, respectively). This may suggest that nanobubbles extravasate into extravascular space, resulting in a slower clearance of nanobubbles than of Definity microbubbles in tumors. It is interesting to note that the DSR in vitro (2.12) is lower than what is observed in the tumor, providing additional support for the hypothesis of nanobubble extravasation.
Our study has several limitations. First, because it is still technically challenging to count the nanobubbles directly, the actual nanobubble concentration is not known. Instead, we approximate this parameter on the basis of bubble size differences. Thus, for the purpose of this study, we used the dilutions of a stock solution instead of the actual bubble concentration. Second, our in vivo pharmacokinetic study provides only indirect evidence of nanobubble extravasation outside of tumor vasculature. Further experiments, which are currently ongoing in our laboratory, are needed to directly verify the extravasation process.
CONCLUSIONS
In this study, we explored the acoustic properties and initial in vivo performance of surfactant-stabilized lipid nanobubbles. Our results suggest that the acoustic properties of these new contrast agents are at least equivalent, if not superior, to those of the clinically used Definity microbubbles. The superior nanobubble stability in vitro can be attributed to stabilizing interactions of the poly(propylene oxide) segments of the Pluronic surfactant with the hydrophobic gas, as well as the surface-protecting poly(ethylene oxide) segment. In vivo, the clearance of nanobubbles from the circulation and tumors of mice was slower than that of Definity microbubbles, suggesting potential extravasation and entrapment of the bubbles within the tumor parenchyma. Additional studies are needed to confirm this hypothesis and to develop these nanoscale agents further for practical ultrasound imaging applications.
REFERENCES
- Anaye A, Perrenoud G, Rognin N, Arditi M, Mercier L, Frinking P, Ruffieux C, Peetrons P, Meuli R, Meuwly JY. Differentiation of focal liver lesions: Usefulness of parametric imaging with contrast-enhanced US. Radiology. 2011;261:300–310. doi: 10.1148/radiol.11101866. [DOI] [PubMed] [Google Scholar]
- Borden MA, Longo ML. Dissolution behavior of lipid monolayer-coated, air-filled microbubbles: Effect of lipid hydrophobic chain length. Langmuir. 2002;18:9225–9233. [Google Scholar]
- Bouakaz A, de Jong N, Cachard C, Jouini K. On the effect of lung filtering and cardiac pressure on the standard properties of ultrasound contrast agent. Ultrasonics. 1998;36:703–708. doi: 10.1016/s0041-624x(97)00137-6. [DOI] [PubMed] [Google Scholar]
- Bouakaz A, de Jong N, Gerfault L, Cachard C. In vitro standard acoustic parameters of ultrasound contrast agents: Definitions and calculations. In; Proceedings, 1996 IEEE Ultrasonics Symposium; San Antonio, TX. 1996. pp. 1445–1448. [Google Scholar]
- Discher DE, Eisenberg A. Polymer vesicles. Science. 2002;297:967–973. doi: 10.1126/science.1074972. [DOI] [PubMed] [Google Scholar]
- Elie N, Kaliski A, Peronneau P, Opolon P, Roche A, Lassau N. Methodology for quantifying interactions between perfusion evaluated by DCE-US and hypoxia throughout tumor growth. Ultrasound Med Biol. 2007;33:549–560. doi: 10.1016/j.ultrasmedbio.2006.09.011. [DOI] [PubMed] [Google Scholar]
- Forsberg F, Piccoli CW, Liu JB, Rawool NM, Merton DA, Mitchell DG, Goldberg BB. Hepatic tumor detection: MR imaging and conventional US versus pulse-inversion harmonic US of NC100100 during its reticuloendothelial system-specific phase. Radiology. 2002;222:824–829. doi: 10.1148/radiol.2223001786. [DOI] [PubMed] [Google Scholar]
- Harashima H, Sakata K, Funato K, Kiwada H. Enhanced hepatic uptake of liposomes through complement activation depending on the size of liposomes. Pharm Res. 1994;11:402–406. doi: 10.1023/a:1018965121222. [DOI] [PubMed] [Google Scholar]
- He G, Ma LL, Pan J, Venkatraman S. ABA and BAB type triblock copolymers of PEG and PLA: A comparative study of drug release properties and “stealth” particle characteristics. Int J Pharm. 2007;334:48–55. doi: 10.1016/j.ijpharm.2006.10.020. [DOI] [PubMed] [Google Scholar]
- Hobbs SK, Monsky WL, Yuan F, Roberts WG, Griffith L, Torchilin VP, Jain RK. Regulation of transport pathways in tumor vessels: Role of tumor type and microenvironment. Proc Natl Acad Sci USA. 1998;95:4607–4612. doi: 10.1073/pnas.95.8.4607. [DOI] [PMC free article] [PubMed] [Google Scholar]
- Hung SH, Yeh CK, Tsai TH, Chen T, Chen RC. A simple method for quantifying ultrasound-triggered microbubble destruction. Ultrasound Med Biol. 2011;37:949–957. doi: 10.1016/j.ultrasmedbio.2011.03.005. [DOI] [PubMed] [Google Scholar]
- Ishida T, Harashima H, Kiwada H. Liposome clearance. Biosci Rep. 2002;22:197–224. doi: 10.1023/a:1020134521778. [DOI] [PubMed] [Google Scholar]
- Klibanov AL, Hughes MS, Marsh JN, Hall CS, Miller JG, Wible JH, Brandenburger GH. Targeting of ultrasound contrast material: An in vitro feasibility study. Acta Radiol Suppl. 1997;412:113–120. [PubMed] [Google Scholar]
- Krix M, Plathow C, Kiessling F, Herth F, Karcher A, Essig M, Schmitteckert H, Kauczor HU, Delorme S. Quantification of perfusion of liver tissue and metastases using a multivessel model for replenishment kinetics of ultrasound contrast agents. Ultrasound Med Biol. 2004;30:1355–1363. doi: 10.1016/j.ultrasmedbio.2004.08.011. [DOI] [PubMed] [Google Scholar]
- Krupka TM, Solorio L, Wilson RE, Wu H, Azar N, Exner AA. Formulation and characterization of echogenic lipid-Pluronic nanobubbles. Mol Pharm. 2010;7:49–59. doi: 10.1021/mp9001816. [DOI] [PMC free article] [PubMed] [Google Scholar]
- Kuenen MP, Mischi M, Wijkstra H. Contrast-ultrasound diffusion imaging for localization of prostate cancer. IEEE Trans Med Imaging. 2011;30:1493–1502. doi: 10.1109/TMI.2011.2125981. [DOI] [PubMed] [Google Scholar]
- Lampaskis M, Averkiou M. Investigation of the relationship of nonlinear backscattered ultrasound intensity with microbubble concentration at low MI. Ultrasound Med Biol. 2010;36:306–312. doi: 10.1016/j.ultrasmedbio.2009.09.011. [DOI] [PubMed] [Google Scholar]
- Lassau N, Koscielny S, Chami L, Chebil M, Benatsou B, Roche A, Ducreux M, Malka D, Boige V. Advanced hepatocellular carcinoma: Early evaluation of response to bevacizumab therapy at dynamic contrast-enhanced US with quantification-preliminary results. Radiology. 2011;258:291–300. doi: 10.1148/radiol.10091870. [DOI] [PubMed] [Google Scholar]
- Lindner JR, Song J, Christiansen J, Klibanov AL, Xu F, Ley K. Ultrasound assessment of inflammation and renal tissue injury with microbubbles targeted to P-selectin. Circulation. 2001;104:2107–2112. doi: 10.1161/hc4201.097061. [DOI] [PubMed] [Google Scholar]
- Mischi M, Kuenen MP, Wijkstra H. Angiogenesis imaging by spatio-temporal analysis of ultrasound contrast agent dispersion kinetics. IEEE Trans Ultrason Ferroelectr Freq Control. 2012;59:621–629. doi: 10.1109/TUFFC.2012.2241. [DOI] [PubMed] [Google Scholar]
- Moghimi SM. Mechanisms of splenic clearance of blood cells and particles: Towards development of new splenotropic agents. Adv Drug Deliv Rev. 1995;17:103–115. [Google Scholar]
- Piscaglia F, Nolsoe C, Dietrich CF, Cosgrove DO, Gilja OH, Bachmann Nielsen M, Albrecht T, Barozzi L, Bertolotto M, Catalano O, Claudon M, Clevert DA, Correas JM, D’Onofrio M, Drudi FM, Eyding J, Giovannini M, Hocke M, Ignee A, Jung EM, Klauser AS, Lassau N, Leen E, Mathis G, Saftoiu A, Seidel G, Sidhu PS, Haar GT, Timmerman D, Weskott HP. The EFSUMB guidelines and recommendations on the clinical practice of contrast enhanced ultrasound (CEUS): Update 2011 on non-hepatic applications. Ultraschall Med. 2012;33:33–59. doi: 10.1055/s-0031-1281676. [DOI] [PubMed] [Google Scholar]
- Platts DG, Fraser JF. Contrast echocardiography in critical care: Echoes of the future? A review of the role of microsphere contrast echocardiography. Crit Care Resusc. 2011;13:44–55. [PubMed] [Google Scholar]
- Rognin NG. Simulation and quantification tools in ultrasound contrast imaging, PhD thesis. University of Lyon; 2002. p. 217. [Google Scholar]
- Rognin NG, Arditi M, Mercier L, Frinking PJ, Schneider M, Perrenoud G, Anaye A, Meuwly JY, Tranquart F. Parametric imaging for characterizing focal liver lesions in contrast-enhanced ultrasound. IEEE Trans Ultrason Ferroelectr Freq Control. 2010;57:2503–2511. doi: 10.1109/TUFFC.2010.1716. [DOI] [PubMed] [Google Scholar]
- Sarkar K, Katiyar A, Jain P. Growth and dissolution of an encapsulated contrast microbubble: Effects of encapsulation permeability. Ultrasound Med Biol. 2009;35:1385–1396. doi: 10.1016/j.ultrasmedbio.2009.04.010. [DOI] [PMC free article] [PubMed] [Google Scholar]
- Short AC, Montoya ML, Gebb SA, Presson RG, Jr., Wagner WW, Jr., Capen RL. Pulmonary capillary diameters and recruitment characteristics in subpleural and interior networks. J Appl Physiol. 1996;80:1568–1573. doi: 10.1152/jappl.1996.80.5.1568. [DOI] [PubMed] [Google Scholar]
- Sirsi S, Feshitan J, Kwan J, Homma S, Borden M. Effect of microbubble size on fundamental mode high frequency ultrasound imaging in mice. Ultrasound Med Biol. 2010;36:935–948. doi: 10.1016/j.ultrasmedbio.2010.03.015. [DOI] [PMC free article] [PubMed] [Google Scholar]
- Tardy I, Pochon S, Theraulaz M, Emmel P, Passantino L, Tranquart F, Schneider M. Ultrasound molecular imaging of VEGFR2 in a rat prostate tumor model using BR55. Investig Radiol. 2010;45:573–578. doi: 10.1097/RLI.0b013e3181ee8b83. [DOI] [PubMed] [Google Scholar]
- Tartis MS, Kruse DE, Zheng H, Zhang H, Kheirolomoom A, Marik J, Ferrara KW. Dynamic microPET imaging of ultrasound contrast agents and lipid delivery. J Control Release. 2008;131:160–166. doi: 10.1016/j.jconrel.2008.07.030. [DOI] [PMC free article] [PubMed] [Google Scholar]
- Wang Y, Li X, Zhou Y, Huang P, Xu Y. Preparation of nanobubbles for ultrasound imaging and intracelluar drug delivery. Int J Pharm. 2010;384:148–153. doi: 10.1016/j.ijpharm.2009.09.027. [DOI] [PubMed] [Google Scholar]
- Wei K. Future applications of contrast ultrasound. J Cardiovasc Ultrasound. 2011;19:107–114. doi: 10.4250/jcu.2011.19.3.107. [DOI] [PMC free article] [PubMed] [Google Scholar]
- Wheatley MA, Forsberg F, Dube N, Patel M, Oeffinger BE. Surfactant-stabilized contrast agent on the nanoscale for diagnostic ultrasound imaging. Ultrasound Med Biol. 2006;32:83–93. doi: 10.1016/j.ultrasmedbio.2005.08.009. [DOI] [PubMed] [Google Scholar]
- Willmann JK, Cheng Z, Davis C, Lutz AM, Schipper ML, Nielsen CH, Gambhir SS. Targeted microbubbles for imaging tumor angiogen-esis: Assessment of whole-body biodistribution with dynamic micro-PET in mice. Radiology. 2008;249:212–219. doi: 10.1148/radiol.2491072050. [DOI] [PMC free article] [PubMed] [Google Scholar]
- Wu G, Majewski J, Ege C, Kjaer K, Weygand MJ, Lee KY. Lipid corralling and poloxamer squeeze-out in membranes. Phys Rev Lett. 2004;93:028101. doi: 10.1103/PhysRevLett.93.028101. [DOI] [PubMed] [Google Scholar]
- Xing Z, Wang J, Ke H, Zhao B, Yue X, Dai Z, Liu J. The fabrication of novel nanobubble ultrasound contrast agent for potential tumor imaging. Nanotechnology. 2010;21:145607. doi: 10.1088/0957-4484/21/14/145607. [DOI] [PubMed] [Google Scholar]
- Zhang W, Liu J, Li S, Chen M, Liu H. Preparation and evaluation of stealth Tashinone IIA-loaded solid lipid nanoparticles: Influence of poloxamer 188 coating on phagocytic uptake. J Microencapsul. 2008;25:203–209. doi: 10.1080/02652040701852181. [DOI] [PubMed] [Google Scholar]


