

Abstract
Early brain injury alters both structural and functional connectivity between the cerebral hemispheres. Despite increasing knowledge on the individual hemispheric contributions to recovery from such injury, we know very little about how their interactions affect this process. In the present study, we related interhemispheric structural and functional connectivity to receptive language outcome following early left hemisphere stroke. We used functional magnetic resonance imaging to study 14 people with neonatal brain injury, and 25 age-matched controls during passive story comprehension. With respect to structural connectivity, we found that increased volume of the corpus callosum predicted good receptive language outcome, but that this is not specific to people with injury. In contrast, we found that increased posterior superior temporal gyrus interhemispheric functional connectivity during story comprehension predicted better receptive language performance in people with early brain injury, but worse performance in typical controls. This suggests that interhemispheric functional connectivity is one potential compensatory mechanism following early injury. Further, this pattern of results suggests refinement of the prevailing notion that better language outcome following early left hemisphere injury relies on the contribution of the contralesional hemisphere (i.e., the “right-hemisphere-take-over” theory). This pattern of results was also regionally specific; connectivity of the angular gyrus predicted poorer performance in both groups, independent of brain injury. These results present a complex picture of recovery, and in some cases, such recovery relies on increased cooperation between the injured hemisphere and homologous regions in the contralesional hemisphere, but in other cases, the opposite appears to hold.
Introduction
The proliferation of axonal fibers during the perinatal period establishes interhemispheric connectivity (Innocenti and Bressoud, 2003; Innocenti and Price, 2005; Paul, 2011; Takahashi et al., 2012), primarily via the corpus callosum. This process is fundamentally altered by early brain injury (Moses et al., 2000; Back et al., 2001, 2002; Rosen, 2003; Paul, 2011). Early injury also alters the contributions of each hemisphere to language (Staudt et al., 2001, 2002; Raja Beharelle et al., 2010), but this has been investigated without examining cross-hemispheric interactions. In fact, with few exceptions (Fair et al., 2010; Raja Beharelle et al., 2010), the prevailing notion of language recovery following early injury is via compensation (or “takeover”) of function by the nondominant hemisphere (Hertz-Pannier et al., 1997; Müller et al., 1998; Staudt et al., 2002; Lidzba and Staudt, 2008). Here, we investigate whether continued contribution of the injured left hemisphere is important for language recovery. We relate both interhemispheric structural connectivity of the corpus callosum and interhemispheric functional connectivity of perisylvian regions to receptive language outcome following early stroke.
Interhemispheric structural and functional connectivity
In primates the corpus callosum maintains an anteroposterior topography such that the rostrum, genu, and anterior-to-mid body contain fibers of the prefrontal, premotor, and motor cortices, and the posterior body and splenium contain fibers from the parietal, temporal, posterior cingulate, and occipital cortices (for review, see Abe et al., 2004; Hofer and Frahm, 2006; Schmahmann and Pandya, 2006; Zarei et al., 2006; Chao et al., 2009; Westerhausen et al., 2009; Putnam et al., 2010; Saenz and Fine, 2010). In response to injury, the corpus callosum is affected in a topographic manner in both adults (de Lacoste et al., 1985) and children with early brain injury (Moses et al., 2000), with a persistent hypoplasia in children of those callosal regions most associated with the site of injury. Thus, there is evidence that affected interhemispheric connectivity persists beyond the time of the lesion.
Functionally, the corpus callosum mediates both inhibitory and excitatory interhemispheric transfer (Mountcastle et al., 1992; Yazgan et al., 1995; Bloom and Hynd, 2005) that may be important for higher level cognition (Seymour et al., 1994; Zaidel and Iacoboni, 2003), including language (Hines et al., 1992). Disruption of callosal fibers affects blood oxygenation level-dependent (BOLD) functional magnetic resonance imaging (fMRI) connectivity (Quigley et al., 2003; Johnston et al., 2008), which is associated with attentional and somatomotor outcomes in adults after stroke (Grefkes et al., 2008; Carter et al., 2010; Wang et al., 2010; Grefkes and Fink, 2011). It remains unknown if such changes affect language, but these results suggest that changes in interhemispheric functional interactions might also affect recovery after congenital brain injury.
We explored this issue by examining interhemispheric structural and functional connectivity and its relation to language recovery in 14 people with early brain injury and 25 uninjured controls. We expected that changes to callosal morphology and interhemispheric functional connectivity of inferior frontal, inferior parietal, and posterior superior temporal regions known to be involved in language comprehension would be reliable predictors of receptive language following early brain injury.
Materials and Methods
Participants
Fourteen individuals with prenatal or perinatal brain injury of vascular origin, predominately involving the left hemisphere were studied (9 [64%] females, range = 7 years 2 months–29 year 10 months; M [SD] age = 176 [83] months). Table 1 provides the neurological and demographic profile of each participant. Participants were recruited through local and national support groups for childhood “hemiplegia” (hemiparesis) as well as by referrals from area neurologists. While individuals with right-sided lesions and congenital malformation were excluded, we had no other exclusion criteria on the basis of race, sex, degree of current hemiparesis, or lesion site in the left hemisphere. All participants had suffered predominantly unilateral brain damage, due to prenatal or perinatal stroke, where perinatal stroke is defined as occurring between the 20th week of gestation and the 28th postnatal day. This consensus definition was developed jointly at a workshop sponsored by the National Institute of Child Health and Human Development and the National Institute of Neurological Disorders and Stroke of the National Institutes of Health of the United States (Raju et al., 2007). Twenty-five age-matched controls, including siblings of these participants and those of several other brain-injured individuals from a larger sample (Raja Beharelle et al., 2010), comprised the comparison group (16 [64%] females, range = 8 years 6 months–38 years 11 months; M [SD] age = 203 [97] months; two participants were left-handed). The group with injury and the comparison group did not differ significantly in their age at examination, t(30.66) = 0.90, p = 0.38, Welch-corrected. The participants included here were a subset of those participants examined in Raja Beharelle et al. (2010) who successfully completed a story comprehension task during fMRI scanning. An additional eight participants were removed from analysis because of excessive motion during the functional scan (>15% of time points exceeded 1 mm, n = 6; Johnstone et al., 2006), or because of scanner artifact (n = 2). Handedness was determined according to the Edinburgh handedness inventory (Oldfield, 1971). All adult participants gave written informed consent. Participants <18 years gave assent and informed consent was obtained from a parent. The Institutional Review Board of the Biological Sciences Division of The University of Chicago approved the study.
Table 1.
Demographic and neurological profile for people with early injury
| Participant | Sex | Hand | Lesion side | Age at exam | Description of injury | Gyral site of lesion | Cerebral palsy? | Epilepsy? | Time since lesion (mo) | FVL |
|---|---|---|---|---|---|---|---|---|---|---|
| 103 | F | L | L | 19 y, 1 mo | FTPO vascular injury with ventricular enlargement (no FLAIR available) | Inferior and middle frontal; insula; superior and middle temporal; supramarginal and angular; lateral occipital | Y | N | 229 | 0.42 |
| 104 | F | L | L | 10 y, 9 mo | FTPO vascular injury with ventricular enlargement (no FLAIR available) | Inferior frontal; insula; pre-and postcentral; superior temporal; superior parietal; supramarginal and angular; lateral occipital | Y | N | 129 | 0.38 |
| 107 | F | L | L | 28 y, 4 mo | Periventricular injury damaging thalamus and caudate | No direct cortical damage | Y | N | 340 | 0.09 |
| 114 | F | L | L | 29 y, 10 mo | Periventricular injury | No direct cortical damage | Y | N | 358 | 0.02 |
| 117 | M | L | L | 10 y, 5 mo | FTP vascular injury with expansion of left lateral ventricle | Insula; superior temporal; supramarginal | Y | N | 125 | 0.19 |
| 119 | M | L | L | 10 y, 7 mo | Periventricular injury with damage to caudate | No direct cortical damage | Y | N | 125 | 0.07 |
| 130 | F | L | L | 13 y, 7 mo | Periventricular injury with damage to thalamus and caudate—putamen | No direct cortical damage | Y | N | 163 | 0.05 |
| 132 | F | L | L | 12 y, 0 mo | Vascular injury with damage to thalamus and caudate | No direct cortical damage | Y | N | 144 | 0.07 |
| 134 | F | L | L | 7 y, 2 mo | Periventricular injury (right hemisphere shunt) | Precuneus | Y | N | 86 | 0.09 |
| 135 | F | R | L | 18 y, 2 mo | Focal vascular lesion damaging putamen; white matter lesion | No direct cortical damage | N | Y | 218 | 0.0005 |
| 137 | M | L | L | 13 y, 11 mo | Periventricular injury with additional expansion of the right ventricle | Supramarginal; angular; superior temporal | Y | Y | 167 | 0.19 |
| 147 | M | R | L | 7 y, 7 mo | Frontal vascular injury | Precentral | N | Y | 91 | 0.04 |
| 152 | F | L | L | 11 y, 11 mo | Vascular lesion damaging putamen extending to frontal cortex | Precentral | Y | N | 143 | 0.06 |
| 157 | M | L | L | 12 y, 4 mo | Vascular periventricular leukomalacia | No direct cortical damage | Y | N | 148 | 0.01 |
M, Male; F, female; L, left; R, right; y, years, mo, months; FTPO, frontal, temporal, parietal, occipital.
We note that this particular sample was comprised of people with both subcortical and cortical lesions. While the type/site of injury is a potential factor influencing the brain's response to insult, both types of lesion that we investigate have been associated with language reorganization. For example, Staudt et al. (2001) found that, like people with injuries directly impacting the cortex (Hertz-Pannier et al., 2002; Liégeois et al., 2004), people with periventricular injuries can also show recruitment of the contralesional right hemisphere during certain language tasks. In fact, correlations between the site of injury and outcome are inconsistent (Liégeois et al., 2004), particularly in prenatal and perinatal injury; extent of damage seems to be a better predictor for outcome, and we include this factor in our analysis (Anderson et al., 2011). Furthermore, people in the sample were predominantly left-handed, which is consistent with prior work investigating people with left hemisphere injuries, and which suggests compensatory organization of the motor system in response to injury (Carr et al., 1993; Staudt et al., 2000, 2001, 2002; Eyre, 2007). This also suggests that even in the cases of small injuries, there was a compensatory response to the injury in the people comprising the sample. Finally, we note that three people with injury had a history of epilepsy, which is known to affect development in these children, and has potential implications for neuroplasticity of language. In some work, epileptic tissue in the left hemisphere has not observably affected the organization of language in children (DeVos et al., 1995; Duchowny et al., 1996), but others provide evidence of different neural organization in these individuals (Brázdil et al., 2005; Ballantyne et al., 2007; Kadis et al., 2007). Thus, it is possible that epilepsy affects language organization in these three children.
fMRI stimuli
Functional scans were acquired while participants passively viewed adaptations of Aesop's Fables under an audiovisual condition in which the storyteller was visible from the waist up, and made natural co-speech gestures as she told the story (Dick et al., 2009; Skipper et al., 2009). Participants participated in three additional audiovisual and auditory-only conditions, which were not analyzed here but described previously by (Dick et al., 2009). In summary, the present analysis included the time series from two stories (M = 53 s) each separated by 16 s of baseline fixation. Audio was delivered through headphones (85 dB SPL). Video was presented through a back-projection mirror.
Behavioral outcome measures
Four measures of receptive language ability and one measure of nonverbal ability were administered as part of a battery of neuropsychological assessments. Participants completed the receptive language subtests and the Listening to Paragraphs measure of the Clinical Evaluation of Language Fundamentals III (CELF III; Semel et al., 1995). The receptive language subtests included requiring the participant to point to target pictures in response to spoken sentences, and to choose a number of orally presented words that go together. The Receptive Language Index is derived from the subtests aimed at listening and auditory comprehension. The Listening to Paragraphs subtest, which requires that participants listen to paragraphs and respond to comprehension questions, provides an additional measure of auditory language comprehension. Participants were also given the Johnson–Newport Grammaticality Judgment task (Johnson and Newport, 1989, 1991), which requires participants to make a judgment about the grammaticality of orally presented sentences. Finally, participants also completed the Wechsler Adult Intelligence Scale III (if they were >16 years; Wechsler, 1997) or the Wechsler Intelligence Scale for Children III (if they were <16 years; Wechsler, 1991). From this examination, we derived a Verbal Comprehension Index from the Vocabulary, Similarities, Information, and Comprehension subtests, and a Perceptual Organization Index from the Picture Completion, Block Design, and Matrix Reasoning subtests. The receptive language measures (Listening to Paragraphs, Verbal Comprehension Index, Johnson–Newport, and CELF Receptive Index) were each expected to relate to functional brain activity during the story comprehension task administered during fMRI, while the Perceptual Organization Index served as a nonverbal performance IQ measure, and was not expected to show such a relation. Table 3 summarizes the outcome measures.
Table 3.
Group performance on behavioral measures of receptive language and of nonverbal IQ
| Behavioral measure | Typical controls |
Early left injury |
Differencerob (SE) | 95% CI | ||
|---|---|---|---|---|---|---|
| M | SD | M | SD | |||
| Receptive language | ||||||
| Listening to Paragraphs | 9.8 | 2.6 | 7.4 | 2.6 | 2.3 (1.0) | 0.5 to 4.0 |
| Verbal Comprehension | 100.9 | 17.7 | 94.9 | 20.6 | 6.5 (6.5) | −6.4 to 19.1 |
| Newport Grammaticality Index | 131.0 | 7.0 | 120.6 | 17.9 | 5.7 (3.0) | −0.4 to 11.5 |
| CELF Receptive | 100.3 | 20.7 | 88.8 | 22.0 | 9.6 (5.7) | −1.6 to 20.8 |
| Performance IQ Measure | ||||||
| Perceptual Organization Index | 108.7 | 11.8 | 94.6 | 20.7 | 11.5 (4.6) | 2.4 to 20.5 |
Differencerob, Robust estimate of the difference.
Data acquisition and analysis
MRI scans were acquired at 3 T with a standard quadrature head coil (General Electric). High-resolution T1-weighted images were acquired (120 axial slices, 1.5 × 0.938 × 0.938 mm). For functional scans, thirty sagittal slices (5.00 × 3.75 × 3.75 mm) were acquired using spiral BOLD acquisition (TR/TE = 2000 ms/25 ms, FA = 77°). The first four scans of each run were discarded. Special steps were taken to ensure that children who were scanned were properly acclimated to the scanner environment. Following Byars et al. (2002) we included a “mock” scan during which children practiced lying still in the scanner while listening to prerecorded scanner noise. When children felt confident to enter the real scanner, the session began.
Analysis steps
Several analyses were performed: (1) a traditional “block” analysis on the whole brain to determine activity above a resting baseline, (2) a regions of interest (ROI) analysis to assess interhemispheric functional connectivity, and (3) morphometric analysis of the corpus callosum and corticospinal tract. These measures were related to the behavioral outcome measures.
Postprocessing
Postprocessing of the fMRI data was conducted using Analysis of Functional Neuroimages software (http://afni.nimh.nih.gov) on the native MRI images. For each participant, image processing consisted of (1) 3D motion correction using weighted least-squares alignment of three translational and three rotational parameters, and registration to the first nondiscarded image of the first functional run, and to the anatomical volumes; (2) despiking and mean normalization of the time series; (3) inspection and censoring of time points occurring during excessive motion (>1 mm; Johnstone et al., 2006); and (4) modeling of sustained hemodynamic activity within a story via regressors corresponding to the story conditions, convolved with a gamma function model of the hemodynamic response derived from Cohen (1997). We also included linear and quadratic drift trends, six motion parameters obtained from the spatial alignment procedure, and to remove additional sources of spurious variance unlikely to represent signal of interest, we included the time series signal from both lateral ventricles, and from bilateral white matter (Fox et al., 2005). This analysis resulted in a regression coefficient for the audiovisual story and an associated t statistic measuring the reliability of the coefficient. False discovery rate (FDR; Benjamini and Hochberg, 1995; Genovese et al., 2002) statistics were calculated to correct for multiple comparisons at the individual participant level (applicable for the functional connectivity analysis). Baseline activation maps for the task used in this study are provided, for typical children and adults, in our prior reports (Dick et al., 2009, 2010, 2012).
We note that motion is a particular concern for clinical populations of all ages as well as healthy children (Brown et al., 2010; Power et al., 2012a). In the present study, we censored motion using a strict criterion of 1 mm in any direction, and we additionally excluded participants in which censored points exceeded 15% of the total number of time points in any of the two runs. This meant that, for 37 of 39 participants, we censored between 0 and 2% of time points. For two participants, we censored on average 8% of the time points across the two runs. As we note above, we implemented preprocessing steps that have been shown to mitigate the effects of motion on functional connectivity, including regression of motion parameters and regression of signal from ventricular and white matter regions of interest (Power et al., 2012b).
Surface reconstruction of anatomical images and anatomical parcellation into ROIs
To provide a semi-automated parcellation of the cerebral cortex, cerebellar cortex, and corpus callosum, we constructed 2D surface renderings of each participant's brain using FreeSurfer (http://surfer.nmr.mgh.harvard.edu; Dale et al., 1999; Fischl et al., 1999). Note that our sample contained children as young as 7 years. However, we stress that although children and adults do show differences in brain morphology, FreeSurfer has been used to successfully create accurate surface representations for children (Tamnes et al., 2010).
We also took special steps to ensure accurate surface reconstructions for the people with early brain injury. To do this we applied a novel semi-automated method, which we term Virtual Brain Transplantation (VBT; Solodkin et al., 2010 for details of the method), to register and parcellate brains containing focal injuries into a surface space with anatomical accuracy. This method is necessary in cases where the lesion is large and/or remaining tissue is distorted, and in such cases it is virtually impossible to obtain an accurate surface representation and anatomical parcellation using standard surface reconstruction procedures. The procedure allows an accurate reconstruction of the cortical surface by “filling in” the lesion with “transplanted virtual tissue” from the noninjured hemisphere, following a crucial step of registering the two hemispheres to each other using gyral patterns. This step, unique to VBT, is important because of the brain atrophy that occurs over time following a brain lesion. Thus, this procedure provides accurate anatomical landmarks to facilitate the standard alignment and inflation algorithms used by the FreeSurfer software for individuals without brain injury. The accuracy of this method has been validated against the parcellation obtained in a typical brain, and in that same brain with a simulated lesion (Solodkin et al., 2010). All parcellations were visually assessed against a published atlas (Duvernoy, 1999) to ensure anatomical accuracy.
Cortical and cerebellar parcellation.
We chose to examine the interhemispheric functional connectivity of seven anatomically defined cortical ROIs: inferior frontal gyrus (IFG); pars triangularis (IFGTr), IFG pars opercularis (IFGOp), supramarginal and angular gyri of the inferior parietal lobule (SMG and AG, respectively), the posterior superior temporal gyrus (STGp) and sulcus (STSp), the posterior middle temporal gyrus (MTGp), and one cerebellar cortical ROI, per hemisphere (i.e., 16 regions total). The anatomical characteristics of these regions are explained in Table 2). The neocortical regions were chosen based on the results of functional imaging findings examining discourse comprehension in adults (Skipper et al., 2005; Hasson et al., 2007) and in children (Karunanayaka et al., 2007; Schmithorst et al., 2007), including a functional imaging study of adults completing the precise audiovisual story comprehension task used in the present study (Dick et al., 2009). Lesion analysis of brain regions involved in language comprehension additionally informed our selection of the posterior temporal ROIs (Dronkers et al., 2004; Turken and Dronkers, 2011). The cerebellar ROI was included as a “control” region, because there is no direct interhemispheric cerebellar anatomical connectivity (Rosina and Provini, 1984; Naidich et al., 2008; Glickstein et al., 2011), we expected no relationship between cerebellar interhemispheric functional connectivity and behavioral outcome. ROIs were defined on each individual surface representation using an automated parcellation procedure in FreeSurfer (Fischl et al., 2004; Desikan et al., 2006), incorporating the neuroanatomical conventions of Duvernoy (1999). We manually edited the default parcellation to delineate anterior and posterior portions of the predefined STG and STS regions (see Table 2 for details). Surface interpolation of functional data inherently results in spatial smoothing across contiguous ROIs. To avoid this, we instead projected the ROIs defined on the cortical and cerebellar surface to the native MRI space, and we did not spatially smooth the time series. To facilitate further analysis, for each participant, the time series of each active voxel (p < 0.05, FDR corrected) within each ROI was exported to a MySQL database (Hasson et al., 2008).
Table 2.
Anatomical description of the cortical and cerebellar ROIs
| ROI | Anatomical structure | Brodmann's area | Delimiting landmarks |
|---|---|---|---|
| IFGTr | Pars triangularis of the inferior frontal gyrus | 45 | A, coronal plane defined as the rostral end of the anterior horizontal ramus of the lateral fissure |
| P, vertical ramus of the lateral fissure | |||
| S, inferior frontal sulcus | |||
| I, anterior horizontal ramus of the lateral fissure | |||
| IFGOp | Pars opercularis of the inferior frontal gyrus | 44 | A, anterior vertical ramus of the lateral fissure |
| P, inferior precentral sulcus | |||
| S, inferior frontal sulcus | |||
| I, anterior horizontal ramus of the lateral fissure to the border with insular cortex | |||
| SMG | Supramarginal gyrus | 40 | A, postcentral sulcus |
| P, sulcus intermedius primus of Jensen | |||
| S, intraparietal sulcus | |||
| I, sylvian fissure | |||
| STGp | Posterior superior temporal gyrus | 22 | A, a vertical plane drawn from the anterior extent of the transverse temporal gyrus |
| P, angular gyrus | |||
| S, lateral fissure | |||
| I, dorsal aspect of the upper bank of the superior temporal sulcus | |||
| MTGp | Posterior middle temporal gyrus | 21 | A, a vertical plane drawn from the anterior extent of the transverse temporal gyrus |
| P, temporo-occipital incisure | |||
| S, ventral aspect of the lower bank of the superior temporal sulcus | |||
| I, dorsal aspect of the upper bank of the inferior temporal sulcus | |||
| STSp | Posterior superior temporal sulcus | 22 | A, a vertical plane drawn from the anterior extent of the transverse temporal gyrus |
| P, angular gyrus and middle occipital gyrus and sulcus | |||
| S, angular and superior temporal gyrus | |||
| I, middle temporal gyrus | |||
| Cerebellar cortex | Cortex of the cerebellum | Cortex of the cerebellum |
A, Anterior; P, posterior; S, superior; I, inferior.
Corpus callosum parcellation.
Although other schemes have been proposed (Witelson, 1989; Hofer and Frahm, 2006), we used the method of de Lacoste et al. (1985) to subdivide the corpus callosum into five parts. Moses et al. (2000) followed an identical scheme and we chose this procedure to facilitate comparison with their findings. To achieve the parcellation, we manually verified the subcortical corpus callosum segmentation from the FreeSurfer reconstruction against the scheme in de Lacoste et al. (1985), and modified it manually in cases where parcellation errors occurred. The volume of each segment was recorded for each participant. A representative parcellation for typical controls, and the parcellation of each participant with early injury, is provided in the figures.
Wallerian degeneration of the corticospinal tract
To quantify the degree of Wallerian degeneration in the corticospinal tract within the injury group, we followed the procedure outlined by Staudt et al. (2000), modified from Bouza et al. (1994). We first aligned the T1-weighted anatomical images along the mid-sagittal plane and along a plane defined by the anterior and posterior commissures (the bicommissural plane). Next, we made two transverse cuts parallel to the bicommissural plane: the superior cut at the level of the inferior colliculus (and through the cerebral peduncles), and the inferior cut at the border of the pons and medulla oblongata. ROIs of both sides of the midbrain and medulla were drawn manually, and asymmetry ratios were calculated at these two cuts by taking the volume of the ROI of the injured hemisphere divided by the volume of the intact hemisphere. Thus, two asymmetry ratios were calculated, one indexing Wallerian degeneration of the cerebral peduncle, and the second degeneration at the level of the medulla.
Lesion size
It is possible that the results we report could be explained simply by the amount of injury and its effect on subsequent development, rather than the other variables of interest. Various methods are used to quantify the size of injury (Vargha-Khadem et al., 1985; Moses et al., 2000; Bava et al., 2007). We chose an assessment of injury magnitude based on fractional volume loss (FVL) of the injured hemisphere because it provides a reasonably good measure of the extent of the lesion, and as a continuous measure, it is particularly suitable for statistical inference. Hemispheric volume was obtained by manually outlining the margin of each hemisphere on the T1-weighted image. In addition, the ventricles and areas of porencephaly were subtracted from the hemispheric volumes. The FVL was then calculated as follows: FVL = (VN −VL)/VN, where VN is the volume of the intact hemispheric, and VL is the volume of the hemisphere containing the lesion. In this sample, FVL values ranged from 0.0005 to 0.42 (M = 0.12; SD = 0.13). To facilitate comparison with Moses et al. (2000), we also calculated, as they did, a fractional hemispheric volume (FHV), which is a ratio of the volume of the injured hemibrain to that of the intact hemibrain.
Relating brain and behavioral measures: robust statistical procedures
The investigation of developmental outcomes following early brain injury is often hampered by small samples and by heterogeneity of the brains and their injuries. To alleviate these concerns and to engender confidence in our reported results, we examined the statistical relations between our brain measures and the behavioral measures using robust statistical procedures and bootstrapping approaches. Our statistical approach derives from the recommendations of the APA Task Force on Statistical Inference (Wilkinson, 1999).
Specifically, we calculated robust estimates of correlation (rrob) and of regression. Robust procedures are less influenced by outliers and increase the precision of parameter estimates when there are outliers (Wilkinson, 1999; Wilcox, 2005; Wright and London, 2009). We calculated 95% confidence intervals (CIs) and SEs to gauge the reliability of effects (Cohen, 1994) using bootstrap methods for estimating parameters within our relatively small sample (Efron, 1981, 1987; Hinneburg et al., 2007; Manly, 2007). We used the R statistical package (v. 2.13.1; http://www.R-project.org/; R Development Core Team, 2011) to conduct these analyses.
Two robust procedures were used. In the first, for the analysis of the relation between callosum size and measures of lesion size and Wallerian degeneration, we conducted a robust alternative to the Pearson product–moment correlation and generated robust elliptical plots (relplots). This analysis followed the procedures outlined in Wilcox (2005) (R function relplot) and Goldberg and Iglewicz (1992), and used the bivariate biweight M estimator. SEs and CIs were constructed using the bootstrap procedure on the sample data (5000 iterations; Wagstaff et al., 2009). The interpretation of the summary statistic for correlation (rrob) is the same as that of the Pearson r, but the added robust elliptical plot provides a graphical description of the bivariate correlation of the majority of the data (summarized within the inner ellipse) without being unduly influenced by outliers.
The second robust procedure examined the differences between performance on behavioral outcome measures across groups, and the relation between brain measures and behavioral outcome measures. For these analyses we conducted robust regressions using a Huber loss function (Fox, 2002; Wilcox, 2005; Wright and London, 2009). In cases where there are no outliers, robust regression provides similar or identical results to ordinary least-squares regression, but performs better when there are outliers (Wilcox, 2005; Wright and London, 2009). To conduct the bootstrap we adapted the procedure from Venables and Ripley (2010)) to the robust regression model and resampled the residuals. In this procedure the linear model is fit to the data, the residuals are resampled with replacement, and new model coefficients are estimated. This process is iterated 10,000 times to define the SEs of each parameter estimate. The bootstrap SEs are used to calculate the 95% CIs of the parameter estimates.
To analyze the relation between corpus callosum volume and behavioral measures (corpus callosum volume → behavioral outcome), we extracted the volume of each of the five corpus callosum segments for each individual. We entered these values as predictors in the robust regressions. For both groups, we calculated intracranial volume (ICV) using the approach outlined by Buckner et al. (2004). Inclusion of this measure has been shown to account for some noise in the data (Sullivan et al., 2001; Whitwell et al., 2001). We followed the recommendation of Sanfilipo et al. (2004) and entered ICV in the regression as a covariate. For the injury group, we used FVL as an additional predictor to control for the influence of the size of the lesion. The dependent measures for these analyses were the behavioral measures listed in Table 3.
To analyze the relation between interhemispheric functional connectivity and behavioral outcome (interhemispheric connectivity → behavioral outcome), for each individual we extracted the postprocessed time series in active voxels (p < 0.05 FDR corrected) for eight anatomically defined ROIs (cerebellar cortex, IFGTr, IFGOp, SMG, AG, MTGp, STGp, STSp) across the two hemispheres. Within each individual, we calculated the Pearson product–moment correlation of the time series across hemispheres for each region (within each participant, we calculated the correlation of the time series across, e.g., the left and right IFGTr, and repeated this for every other region). Across all 39 subjects and eight regions, in eight cases we were unable to compute a correlation due to lack of reliable activity in one of the regions (i.e., 2.5% of possible correlations). Following calculation of the correlation, we normalized each of the available Pearson r values using Fisher's z transformation (Fisher, 1921). These values, representing the standardized correlation of the time series for each region across hemispheres, were entered as predictors in robust regressions. For the injury group, to control for the influence of the size of the lesion, we entered FVL as an additional predictor. The dependent measures for these analyses were those behavioral measures listed in Table 3.
Results
Group performance on behavioral measures of receptive language and nonverbal IQ
As Table 3 shows, people with injury were considerably worse than typical controls at Listening to Paragraphs and in Performance IQ, but were close to the normal range on some of the receptive language and grammaticality measures. This is consistent with previous reports of recovery of language to normal or near-normal ranges in children with early brain injury (for review, see Woods and Teuber, 1978; Woods and Carey, 1979; Reilly et al., 1998; Bates et al., 2001, 1997; Anderson et al., 2011 for recent review).
Measures of lesion size related to corpus callosum size
Figure 1 shows the replication of the analysis from Moses et al. (2000). They showed (Fig. 1, left) that corpus callosum size is positively correlated with the size of injury in the focal lesion group. We replicated this analysis in our sample (Fig. 1, right). Overall callosum size in the injury group was related to lesion size with a moderate effect size (rrob = 0.50; 95% CI 0.002 to 1.00). However, the CI was quite wide, indicating other sources of variance in the volume of the corpus callosum. To verify that this relation reflected a reduction in interhemispheric connectivity and not a systemic reduction in white matter in response to injury, we showed that callosum size was not strongly related to measures of Wallerian degeneration in the corticospinal tracts (Fig. 2, top and bottom; rrob = −0.02, 95% CI −0.51 to 0.47 for the cerebral peduncle cross section; rrob = 0.30, 95% CI −0.19 to 0.80 for the medulla cross section).
Figure 1.

Hemispheric volume loss was related to overall corpus callosum volume, replicating Moses et al., (2000). Left, Correlation between focal lesion (FL) callosum size and the FHV (lesioned/intact hemibrain), from Moses et al. (2000). Right, Robust elliptical plot of data from the present study showing a relation between callosum size in the early injury group, the FHV (lesioned/intact hemibrain). rrob = robust correlation estimate. *, 95% CI did not cover zero.
Figure 2.
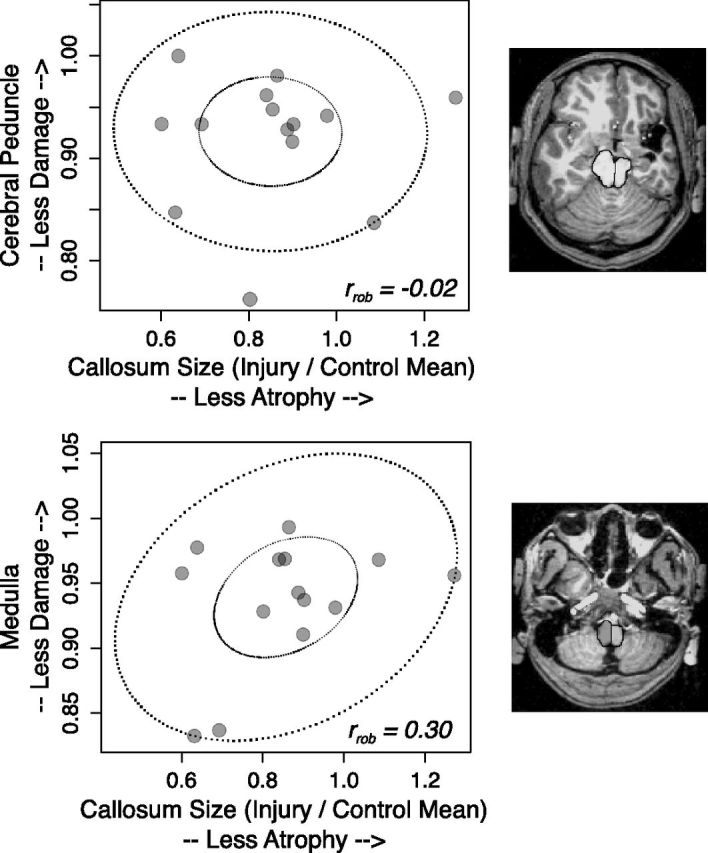
Measures of Wallerian degeneration of the corticospinal tracts at the level of the cerebral peduncle (top) and medulla (bottom) were not strongly related to corpus callosum volume. Inset shows transverse cuts parallel to the bicommissural plane, with the superior cut at the level of the inferior colliculus (and through the cerebral peduncles), and the inferior cut at the medulla immediately below the pons. rrob = robust correlation estimate.
Segment-specific atrophy of the corpus callosum
Examination of the site of injury and relation to atrophy of specific segments of the corpus callosum showed that posterior lesions predominately resulted in atrophy in posterior segments 4 and 5. This replicates the general finding from Moses et al. (2000) that callosal thinning bears a topographical relationship to the site of the lesion. Figures 3–5 show the average volumes of each of the five segments, the sum of the volumes of all segments, and the sum of the volumes of the anterior (1–3) and posterior (4–5) segments. The typical control averages are shown in the top left, with the mid-sagittal image of a representative control participant. Mid-sagittal images of each participant with injury are included, and graphs of the segment volumes are compared with the typical group for each participant. Examination of Figures 3–5 shows that the pattern was most prominent for larger injuries (e.g., participants 103, 104, 134, and 137), but even those with smaller injuries showed atrophy of posterior sites (e.g., participants 114 and 119). However, some injuries did not result in a noticeable difference in specific segment volumes compared with the typical group. For example, participant 103's large injury impacted the frontal lobe, but did not result in noticeable atrophy in the anterior segments. Similarly, some smaller injuries did not result in prominent callosal atrophy (e.g., participants 135, 152, and 157).
Figure 3.
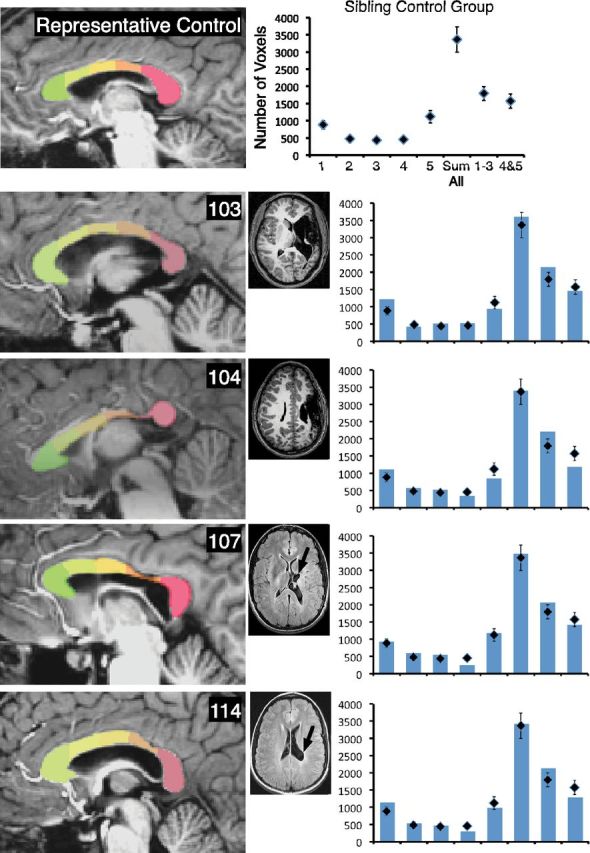
The corpus callosum displays segment-specific atrophy consistent with the site of injury. Parcellation of the corpus callosum is shown for a representative typical control participant (Fig. 3, top) and for each member of the early injury group (Figs. 3–5). T1-weighted (for 103 and 104) and T2-weighted FLAIR (for remaining participants) axial magnetic resonance scans are shown for each person with injury. Black arrows show the primary site of the lesion. In the accompanying graphs, diamonds show the average volume for the typical control group for each segment, for the sum of all segments, for the anterior segments, and for the posterior segments. Bars represent these volumes for each person with early injury. Error bars indicate SEM for the typical control group.
Figure 4.
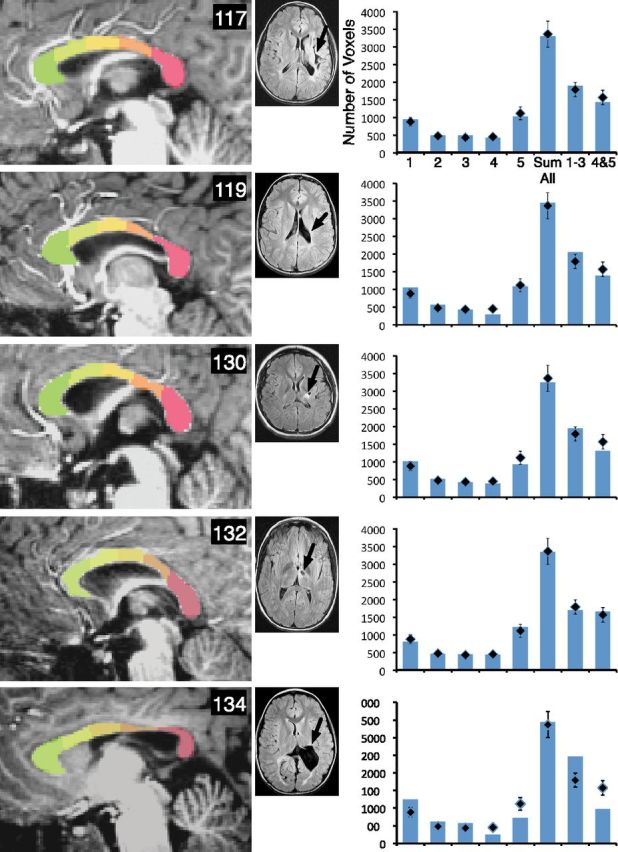
The corpus callosum displays segment-specific atrophy consistent with the site of injury. Parcellation of the corpus callosum is shown for each member of the early group, including 117, 119, 130, 132, and 134, and T2-weighted FLAIR axial magnetic resonance scans are shown for each person with injury. Black arrows show the primary site of the lesion. In the accompanying graphs, diamonds show the average volume for the typical group for each segment, for the sum of all segments, for the anterior segments, and for the posterior segments. Bars represent these volumes for each person with early injury. Error bars represent the SEM for the typical control group.
Figure 5.
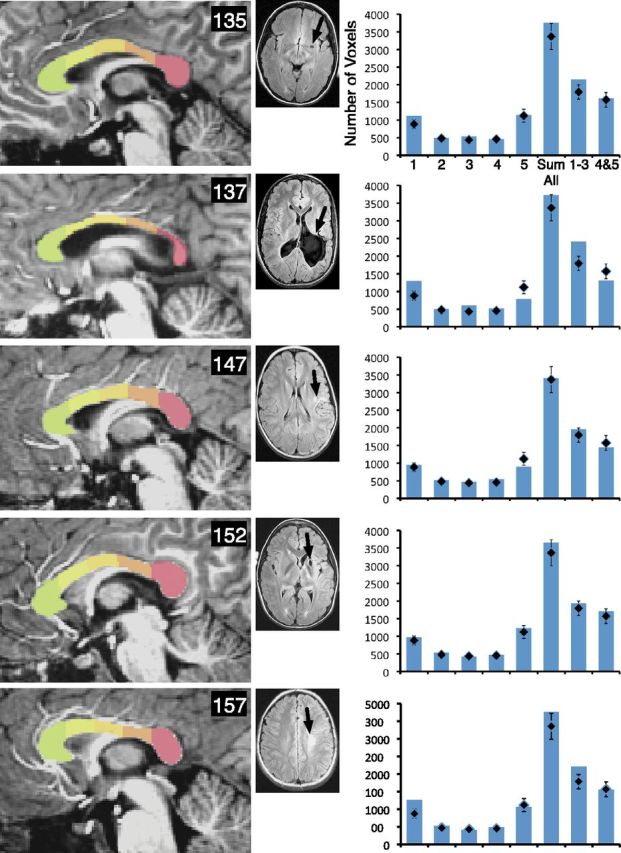
The corpus callosum displays segment-specific atrophy consistent with the site of injury. Parcellation of the corpus callosum is shown for each member of the early group, including 135, 137, 147, 152, and 157, and T2-weighted FLAIR axial magnetic resonance scans are shown for each person with injury. Black arrows show the primary site of the lesion. In the accompanying graphs, diamonds show the average volume for the typical group for each segment, for the sum of all segments, for the anterior segments, and for the posterior segments. Bars represent these volumes for each person with early injury. Error bars represent the SEM for the typical control group.
Corpus callosum segment volume and receptive language
Table 4 and Figure 6 show the results of robust regressions relating corpus callosum segment volume to receptive language. We report only results in which the CIs for the regression coefficients did not cover zero. For typicals, the volume of the posterior segments (4 and 5) predicted all four receptive language measures and the nonverbal measure. In addition, the volume of the anterior segment 1 predicted the Listening to Paragraphs measure. For people with early injury (Table 5), after additionally controlling for the size of the injury (FVL), more anterior segments 2, 3, and posterior segment 5, predicted Listening to Paragraphs, CELF Receptive, Verbal Comprehension, and the nonverbal control task. These results provide evidence that the number of axons connecting the two hemispheres is positively related to improved performance on some receptive language measures, but it is not specific to people with early injury, and it also predicts nonverbal performance.
Table 4.
Corpus callosum segment volume predicts receptive language, typical controls
| Predictor → outcome | Typical controls |
ICV |
R2adj | ||||
|---|---|---|---|---|---|---|---|
| CC segment | |||||||
| B (SE) | β | 95% CI | B (SE) | β | 95% CI | ||
| CC Seg 1 + ICV → Listening to Paragraphs | 0.01 (0.004) | 0.4 | 0.0002 to 0.02 | −0.10 (0.21) | −0.1 | −0.51 to 0.30 | 0.09 |
| CC Seg 4 + ICV → CELF Receptive | 0.10 (0.04) | 0.3 | 0.01 to 0.18 | −1.38 (1.12) | −0.2 | −3.56 to 0.84 | 0.10 |
| CC Seg 5 + ICV → Listening to Paragraphs | 0.01 (0.003) | 0.4 | 0.001 to 0.01 | −0.12 (0.22) | −0.1 | −0.54 to 0.30 | 0.06 |
| CC Seg 5 + ICV → Verbal Comprehension | 0.03 (0.02) | 0.4 | 0.004 to 0.07 | 1.87 (1.18) | 0.3 | −0.44 to 4.20 | 0.19 |
| CC Seg 5 + ICV → J-N Grammaticality | 0.02 (0.01) | 0.4 | 0.004 to 0.03 | −0.41 (0.49) | −0.1 | −1.36 to 0.56 | 0.05 |
| CC Seg 5 + ICV → Perceptual Organization Index | 0.03 (0.01) | 0.5 | 0.01 to 0.05 | −2.35 (0.82) | −0.5 | −3.98 to −0.75 | 0.14 |
CC Seg, Corpus callosum segment; ICV, intracranial volume; J-N, Johnson–Newport. ICV unstandardized regression coefficients were multiplied by a constant.
Figure 6.

Results of robust regressions predicting nonverbal and receptive language outcome measures from corpus callosum segment volume. ICV and, for the injury group, the FVL measure of lesion size, were included in the model (see Tables 4 and 5). Error bars indicate 95% CIs of the unstandardized b coefficient. Data are reported for CIs that did not cover zero.
Table 5.
Corpus callosum segment volume predicts receptive language, people with injury
| People with injury | CC segment |
FVL |
ICV |
R2adj | ||||||
|---|---|---|---|---|---|---|---|---|---|---|
| B (SE) | β | 95% CI | B (SE) | β | 95% CI | B (SE) | β | 95% CI | ||
| CC Seg 2 + ICV + FVL → Listening to Paragraphs | 0.01 (0.006) | 0.52 | 0.001 to 0.03 | −3.84 (5.04) | −0.20 | −14.0 to 5.7 | −0.25 (0.18) | −0.31 | −0.60 to 0.11 | 0.14 |
| CC Seg 2 + ICV + FVL → Verbal Comprehension | 0.09 (0.04) | 0.44 | 0.01 to 0.18 | −72.76 (33.63) | −0.46 | −137.68 to −5.85 | −0.33 (1.21) | −0.05 | −2.70 to 2.03 | 0.16 |
| CC Seg 2 + ICV + FVL → CELF Receptive | 0.09 (0.04) | 0.42 | 0.01 to 0.18 | −89.97 (34.44) | −0.54 | −157.81 to −22.83 | −2.04 (1.24) | −0.30 | −4.47 to 0.38 | 0.14 |
| CC Seg 3 + ICV + FVL → Listening to Paragraphs | 0.02 (0.01) | 0.55 | 0.004 to 0.03 | −7.75 (4.18) | −0.40 | −16.14 to 0.25 | −0.40 (0.18) | −0.50 | −0.75 to −0.05 | 0.11 |
| CC Seg 3 + ICV + FVL → Verbal Comprehension | 0.12 (0.05) | 0.47 | 0.02 to 0.22 | −99.50 (29.25) | −0.63 | −155.60 to −40.95 | −1.44 (1.29) | −0.22 | −3.98 to 1.08 | 0.07 |
| CC Seg 3 + ICV + FVL → PO Index | 0.15 (0.04) | 0.57 | 0.07 to 0.23 | −113.11 (23.27) | −0.72 | −157.96 to 66.75 | −4.42 (1.0) | −0.69 | −6.40 to −2.49 | 0.16 |
| CC Seg 5 + ICV + FVL→ Verbal Comprehension | 0.04 (0.02) | 0.53 | 0.01 to 0.07 | −70.59 (33.64) | −0.45 | −136.92 to −5.04 | −0.55 (1.24) | −0.09 | −2.98 to 1.89 | 0.21 |
| CC Seg 5 + ICV + FVL → PO Index | 0.03 (0.01) | 0.41 | 0.01 to 0.06 | −90.81 (27.04) | −0.58 | −144.19 to −38.21 | −3.25 (0.99) | −0.50 | −5.19 to −1.30 | 0.17 |
Note. CC Seg, Corpus callosum segment; FVL, fractional volume loss; PO, Perceptual Organization. ICV, intracranial volume. ICV unstandardized regression coefficients were multiplied by a constant.
Interhemispheric functional connectivity and receptive language
Table 6 and Figure 7 show the results of robust regressions relating interhemispheric functional connectivity of the cortical and cerebellar ROIs to receptive language. We report only results in which the CIs for the regression coefficients did not cover zero. For typicals, increased functional connectivity between the right and left AG, and right and left STGp, predicted poorer performance on the Verbal Comprehension measure. For people with injury (Table 7), after controlling for the size of injury (FVL), increased AG connectivity also predicted poorer performance, in this case on Listening to Paragraphs. However, in contrast to typicals, stronger STGp connectivity actually predicted better performance on all of the receptive language measures. Further, cross-hemispheric functional connectivity during story comprehension failed to predict nonverbal performance IQ measure in any of the examined ROIs in either typicals or people with injury (the most reliable coefficient was 11.06 (6.69), p = 0.11 for typicals, and −18.99 (16.91), p = 0.29 for people with injury). Functional connectivity of the left and right cerebellar cortices also failed to predict behavioral measures for typicals or people with injury (the most reliable coefficient was 18.45 (9.72), p = 0.07 for typicals, and 3.15 (1.53), p = 0.07 for people with injury). In summary, increased cross-hemispheric functional connectivity of the STGp was a strong predictor on all of the examined receptive language measures for people with injury, but not people without injury. However, increased connectivity of the right and left AG was a poor predictor of performance in both groups. Finally, as expected the effect was specific to receptive language measures; i.e., interhemispheric functional connectivity during story comprehension did not predict nonverbal ability. Moreover, cerebellar interhemispheric connectivity did not predict behavioral performance on any measure.
Table 6.
Interhemispheric functional connectivity predicts receptive language, typical controls
| Typical controls | ||||
|---|---|---|---|---|
| Predictor → outcome | B (SE) | β | 95% CI | R2adj |
| AG → Verbal Comprehension | −24.3 (10.0) | −0.4 | −44.0 to −5.1 | 0.1 |
| STGp → Verbal Comprehension | −27.6 (12.3) | −0.4 | −53.4 to −4.0 | 0.1 |
| STSp → Verbal Comprehension | −32.2 (14.4) | −0.4 | −60.5 to −4.0 | 0.1 |
Figure 7.

Results of robust regressions predicting nonverbal and receptive language outcome measures from interhemispheric functional connectivity of each cortical and cerebellar ROI. For the injury group, the fractional volume loss measure of lesion size was included in the model (see Tables 5 and 6). Error bars indicate 95% confidence intervals of the unstandardized b coefficient. Data are reported for CIs that did not cover zero.
Table 7.
Interhemispheric functional connectivity predicts receptive language, people with injury
| People with injury | Connectivity |
FVL |
R2adj | ||||
|---|---|---|---|---|---|---|---|
| B (SE) | ß | 95% CI | B (SE) | ß | 95% CI | ||
| AG + FVL → Listening to Paragraphs | −6.0 (2.2) | −0.5 | −10.4 to −1.62 | −13.8 (3.8) | −0.7 | −21.2 to −6.22 | 0.4 |
| STGp + FVL → Listening to Paragraphs | 5.0 (2.4) | 0.4 | 0.5 to 9.6 | −11.3 (4.7) | −0.6 | −20.8 to −2.21 | 0.3 |
| STGp + FVL → Verbal Comprehension | 43.3 (17.9) | 0.5 | 8.2 to 78.0 | −96.4 (33.5) | −0.6 | −162.1 to −30.6 | 0.6 |
| STGp + FVL → J-N Grammaticality | 26.6 (12.0) | 0.3 | 2.9 to 50.1 | −75.4 (27.2) | −0.6 | −126.4 to −20.0 | 0.5 |
| STGp + FVL → CELF Receptive | 44.4 (16.2) | 0.4 | 12.9 to 76.3 | −114.2 (33.5) | −0.7 | −180.2 to −48.7 | 0.6 |
Note. FVL, fractional volume loss; J-N, Johnson–Newport.
Discussion
Many children who sustain early brain injury during the prenatal or perinatal period show remarkable recovery of language function, but there are individual differences in the degree of recovery (for review, see Woods and Teuber, 1978; Bates et al., 2001; Stiles et al., 2005; Anderson et al., 2011). Because of this, determination of mechanisms of recovery from early insult could have a substantial impact on therapeutic interventions for these children. In this paper, we studied 14 people with injury and 25 age-matched typical controls, examining both functional and structural correlates of language outcome following early brain injury, with a focus on interhemispheric connectivity. With respect to structural connectivity, we found that increased corpus callosum volume predicted receptive language and nonverbal performance, in both groups. However, when we examined interhemispheric functional connectivity, left–right STGp connectivity during story comprehension predicted better receptive language performance in people with injury, but worse performance in controls. This suggests that increased interhemispheric functional connectivity is a potential compensatory mechanism following early injury. Further, this pattern of results suggests refinement to the prevailing notion that better language outcomes rely exclusively on the compensatory activity of the contralesional hemisphere (Rasmussen and Milner, 1977; Lidzba and Staudt, 2008; i.e., the “right-hemisphere-take-over” theory). The pattern was also regionally specific; increased interhemispheric AG functional connectivity actually predicted poorer performance. This presents a complex picture of recovery from early injury, one that suggests mechanisms for recovery show regional specificity, and in some cases rely on the continued cooperation of an injured hemisphere with homologous regions in the uninjured hemisphere.
Relation of interhemispheric connectivity to recovery from early brain injury: structural connectivity
In a study of 10 children with perinatal injury, Moses et al. (2000) reported persistent hypoplasia of the corpus callosum that was consistent with the site of injury. We replicated these findings, showing that (1) corpus callosum size is positively correlated with the size of injury, and this is not explained by general white matter atrophy and (2) callosal thinning is consistent with the site of injury, with our sample of posterior lesions showing most pronounced thinning in the posterior segments. We extended these findings by showing that (3) increased volume of mid-anterior and posterior corpus callosum segments is associated with better performance on language and nonverbal measures, both in people with injury and healthy siblings.
Increased callosal volume is associated with better performance in both groups, which could be interpreted as suggesting that recovery depends on retaining the normal structural integrity of the corpus callosum. Further, the segments implicated in better performance support the known role of inferior frontal, inferior parietal, and posterior temporal regions in narrative-level comprehension (Ferstl et al., 2008), which are thought to project through the rostrum (for inferior frontal gyrus) and splenium (de Lacoste et al., 1985; Pollmann et al., 2002; Carreiras et al., 2009; for inferior parietal and posterior temporal cortex). Our data are consistent with previous findings relating splenium volume to language comprehension in both adults (Friederici et al., 2007) and adolescents (Fryer et al., 2008), and to both language and nonverbal IQ in children born preterm (Northam et al., 2012), which we replicate. This suggests that our anatomical findings have some functional relevance to language recovery.
At the same time, there are a number of caveats. First, the anatomical result applied to both groups, and it was not specific to language. This could simply suggest that integrity of the callosum is itself a predictor of outcome (Schulte et al., 2004). Second, we cannot make a direct claim about the number of fibers because callosal size is not necessarily a predictor of interhemispheric fiber density (Aboitiz et al., 1992), and could reflect reduced myelination, or axonal packing density. Third, lesion size explained only ∼25% of the variability in callosal size. This could relate to differences in the developmental timing of the examined lesions; our sample included both vascular ischemic and hemorrhagic periventricular lesions, which have different etiologies and time of occurrence during the perinatal period (deVeber, 2002; Volpe, 2008). The variability could also be associated with experiential effects on axonal pruning and myelination (Innocenti and Frost, 1979; Berrebi et al., 1988; Juraska and Kopcik, 1988; Zalc and Fields, 2000; Innocenti and Bressoud, 2003; Teicher et al., 2004). For example, reduced callosal area is associated with impoverished rearing environments, which is correlated with cognitive impairment (Sánchez et al., 1998). This suggests that increased access to early therapeutic intervention could influence the degree to which certain interhemispheric connections are retained and others are pruned.
Relation of interhemispheric connectivity to recovery from early brain injury: functional connectivity
We found that (1) after early brain injury, increased STGp interhemispheric connectivity during story comprehension predicted better performance on all receptive language measures, but (2) in typical controls, it was unrelated or negatively predicted receptive language; (3) AG interhemispheric connectivity predicted poor performance in both groups; (4) interhemispheric cerebellar connectivity was not a strong predictor; and (5) connectivity did not predict nonverbal ability. Taken as a whole, the pattern of results suggests that increased interhemispheric functional connectivity is one mechanism of recovery from early brain injury, one that is specific to the task and to the region under investigation.
The possibility that involvement of the injured hemisphere is integral to recovery suggests refinement of the prevailing notion that good recovery depends on “take-over” of the contralesional hemisphere (Lidzba and Staudt, 2008). The strong notion of take-over is that language develops in the right hemisphere in people with early injury (Staudt et al., 2002; Staudt, 2010). However, another possibility reconciles that hypothesis with the current data, i.e., that recovery involves recruitment of right hemisphere structures via increased functional connectivity, with continued involvement of the injured hemisphere. This postulate is consistent with our previous findings (in a superset of the individuals reported here), in which there was increased activation in the right hemisphere, but that this was actually a poor predictor of recovery (Raja Beharelle et al., 2010). Thus, for some injuries, persistent right hemispheric activity may indicate a disruption of typical interhemispheric interactions necessary for language (Rosen et al., 2000; Anderson et al., 2002; Naeser et al., 2005; Price and Crinion, 2005). In the present study, increased interhemispheric connectivity of STGp, a region implicated in narrative comprehension (Déjèrine, 1901; Wernicke, 1908; Geschwind, 1970; Ferstl et al., 2008; Dick et al., 2009), predicted better outcome on all measures for people with injury. Notably, though, this was a poor predictor in typical controls. In the typically developing brain, interhemispheric connectivity of the posterior temporal cortex decreases with age (Brauer et al., 2011; Friederici et al., 2011). Maintenance of temporal lobe interhemispheric connectivity characteristic of children might reflect a poorer functioning network in typical individuals, which is correlated with poorer receptive language. In contrast, for people with early injury, the typical progression of increased intrahemispheric connectivity in the left hemisphere is compromised, and these individuals may rely on enhanced connectivity to the contralesional hemisphere.
Increased functional connectivity between angular gyri was negatively associated with language outcome in both groups. The left AG may to play a role in semantic processing during language comprehension (Binder et al., 2009; Price, 2010; Seghier et al., 2010; Binder and Desai, 2011), particularly task-dependent semantic memory retrieval (Cabeza et al., 2008; Obleser and Kotz, 2010). The right AG is also implicated in lexical-semantic processing (Démonet et al., 1994; Binder et al., 1997), especially during reading, which is associated with increased interhemispheric AG connectivity (Carreiras et al., 2009). It is possible that interhemispheric AG connectivity is a signature of efficient semantic retrieval, such that recruitment of the right AG occurs in cases of high demand on semantic retrieval (e.g., during language comprehension or reading), or reduced efficiency of semantic processing. Recruitment of these resources during comprehension may not be a signature of successful retrieval, but of unsuccessful processing in regions to which the AG connects (Cabeza et al., 2008). If this is the case, increased AG connectivity would predict poorer comprehension, but resolution of these issues awaits additional research.
In summary, the findings with respect to interhemispheric functional connectivity suggest that notions about the benefits of cross-hemispheric integration to recovery should take into account the specific nature of the networks recruited by the task and regional differences in the functional contribution to these networks. Mechanistically, if interhemispheric connections have an excitatory influence on target neurons in contralateral cortical regions, integration between the two hemispheres may increase the number of regions contributing to a particular task (Yazgan et al., 1995), which could be beneficial during demanding tasks like narrative-level language comprehension. Alternatively, changes to interhemispheric connectivity could affect the inhibitory influence of left hemisphere regions on right hemisphere homologues (Saur et al., 2006; Nowak et al., 2008). In fact, simulation studies suggest both mechanisms could be involved, as lesions to different regions have differential effects on the pattern of endogenous functional connectivity within the remaining parts of the network (Honey and Sporns, 2008; Alstott et al., 2009). This process of reorganization appears to be at play during recovery from early brain injury.
Footnotes
This work was supported by grants from the National Institute of Child Health and Human Development under Grant Number P01 HD040605, by the National Institute of Deafness and other Communication Disorders under Grant Numbers RO1 DC003378 and F32DC008909, and the National Institute of Neurological Disorders and Stroke RO1 NS54942.
References
- Abe O, Masutani Y, Aoki S, Yamasue H, Yamada H, Kasai K, Mori H, Hayashi N, Masumoto T, Ohtomo K. Topography of the human corpus callosum using diffusion tensor tractography. J Comput Assist Tomogr. 2004;28:533–539. doi: 10.1097/00004728-200407000-00016. [DOI] [PubMed] [Google Scholar]
- Aboitiz F, Scheibel AB, Fisher RS, Zaidel E. Fiber composition of the human corpus callosum. Brain Res. 1992;598:143–153. doi: 10.1016/0006-8993(92)90178-c. [DOI] [PubMed] [Google Scholar]
- Alstott J, Breakspear M, Hagmann P, Cammoun L, Sporns O. Modeling the impact of lesions in the human brain. PLoS Comput Biol. 2009;5:e1000408. doi: 10.1371/journal.pcbi.1000408. [DOI] [PMC free article] [PubMed] [Google Scholar]
- Anderson DP, Harvey AS, Saling MM, Anderson V, Kean M, Jacobs R, Abbott DF, Wellard RM, Puce A, Jackson G. Differential functional magnetic resonance imaging language activation in twins discordant for a left frontal tumor. J Child Neurol. 2002;17:766–769. doi: 10.1177/08830738020170101801. [DOI] [PubMed] [Google Scholar]
- Anderson V, Spencer-Smith M, Wood A. Do children really recover better? Neurobehavioural plasticity after early brain insult. Brain. 2011;134:2197–2221. doi: 10.1093/brain/awr103. [DOI] [PubMed] [Google Scholar]
- Back SA, Luo NL, Borenstein NS, Levine JM, Volpe JJ, Kinney HC. Late oligodendrocyte progenitors coincide with the developmental window of vulnerability for human perinatal white matter injury. J Neurosci. 2001;21:1302–1312. doi: 10.1523/JNEUROSCI.21-04-01302.2001. [DOI] [PMC free article] [PubMed] [Google Scholar]
- Back SA, Han BH, Luo NL, Chricton CA, Xanthoudakis S, Tam J, Arvin KL, Holtzman DM. Selective vulnerability of late oligodendrocyte progenitors to hypoxia-ischemia. J Neurosci. 2002;22:455–463. doi: 10.1523/JNEUROSCI.22-02-00455.2002. [DOI] [PMC free article] [PubMed] [Google Scholar]
- Ballantyne AO, Spilkin AM, Trauner DA. Language outcome after perinatal stroke: does side matter? Child Neuropsychol. 2007;13:494–509. doi: 10.1080/09297040601114878. [DOI] [PubMed] [Google Scholar]
- Bates E, Thal D, Trauner D, Fenson J, Aram D, Eisele J, Nass R. From first words to grammar in children with focal brain injury. Dev Neuropsychol. 1997;13:275–343. [Google Scholar]
- Bates E, Reilly J, Wulfeck B, Dronkers N, Opie M, Fenson J, Kriz S, Jeffries R, Miller L, Herbst K. Differential effects of unilateral lesions on language production in children and adults. Brain Lang. 2001;79:223–265. doi: 10.1006/brln.2001.2482. [DOI] [PubMed] [Google Scholar]
- Bava S, Archibald SL, Trauner DA. Brain structure in prenatal stroke: quantitative magnetic resonance imaging (MRI) analysis. J Child Neurol. 2007;22:841–847. doi: 10.1177/0883073807304700. [DOI] [PubMed] [Google Scholar]
- Benjamini Y, Hochberg Y. Controlling the false discovery rate: a practical and powerful approach to multiple testing. J R Stat Soc B. 1995;57:289–300. [Google Scholar]
- Berrebi AS, Fitch RH, Ralphe DL, Denenberg JO, Friedrich VL, Jr, Denenberg VH. Corpus callosum: region-specific effects of sex, early experience and age. Brain Res. 1988;438:216–224. doi: 10.1016/0006-8993(88)91340-6. [DOI] [PubMed] [Google Scholar]
- Binder JR, Desai RH. The neurobiology of semantic memory. Trends Cogn Sci. 2011;15:527–536. doi: 10.1016/j.tics.2011.10.001. [DOI] [PMC free article] [PubMed] [Google Scholar]
- Binder JR, Frost JA, Hammeke TA, Cox RW, Rao SM, Prieto T. Human brain language areas identified by functional magnetic resonance imaging. J Neurosci. 1997;17:353–362. doi: 10.1523/JNEUROSCI.17-01-00353.1997. [DOI] [PMC free article] [PubMed] [Google Scholar]
- Binder JR, Desai RH, Graves WW, Conant LL. Where is the semantic system? A critical review and meta-analysis of 120 functional neuroimaging studies. Cereb Cortex. 2009;19:2767–2796. doi: 10.1093/cercor/bhp055. [DOI] [PMC free article] [PubMed] [Google Scholar]
- Bloom JS, Hynd GW. The role of the corpus callosum in interhemispheric transfer of information: excitation or inhibition? Neuropsychol Rev. 2005;15:59–71. doi: 10.1007/s11065-005-6252-y. [DOI] [PubMed] [Google Scholar]
- Bouza H, Dubowitz LM, Rutherford M, Pennock JM. Prediction of outcome in children with congenital hemiplegia: a magnetic resonance imaging study. Neuropediatrics. 1994;25:60–66. doi: 10.1055/s-2008-1071587. [DOI] [PubMed] [Google Scholar]
- Brauer J, Anwander A, Friederici AD. Neuroanatomical prerequisites for language functions in the maturing brain. Cereb Cortex. 2011;21:459–466. doi: 10.1093/cercor/bhq108. [DOI] [PubMed] [Google Scholar]
- Brázdil M, Chlebus P, Mikl M, Pazourková M, Krupa P, Rektor I. Reorganization of language-related neuronal networks in patients with left temporal lobe epilepsy–an fMRI study. Eur J Neurol. 2005;12:268–275. doi: 10.1111/j.1468-1331.2004.01127.x. [DOI] [PubMed] [Google Scholar]
- Brown TT, Kuperman JM, Erhart M, White NS, Roddey JC, Shankaranarayanan A, Han ET, Rettmann D, Dale AM. Prospective motion correction of high-resolution magnetic resonance imaging data in children. Neuroimage. 2010;53:139–145. doi: 10.1016/j.neuroimage.2010.06.017. [DOI] [PMC free article] [PubMed] [Google Scholar]
- Buckner RL, Head D, Parker J, Fotenos AF, Marcus D, Morris JC, Snyder AZ. A unified approach for morphometric and functional data analysis in young, old, and demented adults using automated atlas-based head size normalization: reliability and validation against manual measurement of total intracranial volume. Neuroimage. 2004;23:724–738. doi: 10.1016/j.neuroimage.2004.06.018. [DOI] [PubMed] [Google Scholar]
- Byars AW, Holland SK, Strawsburg RH, Bommer W, Dunn RS, Schmithorst VJ, Plante E. Practical aspects of conducting large-scale functional magnetic resonance imaging studies in children. J Child Neurol. 2002;17:885–890. doi: 10.1177/08830738020170122201. [DOI] [PMC free article] [PubMed] [Google Scholar]
- Cabeza R, Ciaramelli E, Olson IR, Moscovitch M. The parietal cortex and episodic memory: an attentional account. Nat Rev Neurosci. 2008;9:613–625. doi: 10.1038/nrn2459. [DOI] [PMC free article] [PubMed] [Google Scholar]
- Carr LJ, Harrison LM, Evans AL, Stephens JA. Patterns of central motor reorganization in hemiplegic cerebral palsy. Brain. 1993;116:1223–1247. doi: 10.1093/brain/116.5.1223. [DOI] [PubMed] [Google Scholar]
- Carreiras M, Seghier ML, Baquero S, Estévez A, Lozano A, Devlin JT, Price CJ. An anatomical signature for literacy. Nature. 2009;461:983–986. doi: 10.1038/nature08461. [DOI] [PubMed] [Google Scholar]
- Carter AR, Astafiev SV, Lang CE, Connor LT, Rengachary J, Strube MJ, Pope DL, Shulman GL, Corbetta M. Resting interhemispheric functional magnetic resonance imaging connectivity predicts performance after stroke. Ann Neurol. 2010;67:365–375. doi: 10.1002/ana.21905. [DOI] [PMC free article] [PubMed] [Google Scholar]
- Chao YP, Cho KH, Yeh CH, Chou KH, Chen JH, Lin CP. Probabilistic topography of human corpus callosum using cytoarchitectural parcellation and high angular resolution diffusion imaging tractography. Hum Brain Mapp. 2009;30:3172–3187. doi: 10.1002/hbm.20739. [DOI] [PMC free article] [PubMed] [Google Scholar]
- Cohen J. The earth is round (p <. 05) Am Psychologist. 1994;49:997–1003. [Google Scholar]
- Cohen MS. Parametric analysis of fMRI data using linear systems methods. Neuroimage. 1997;6:93–103. doi: 10.1006/nimg.1997.0278. [DOI] [PubMed] [Google Scholar]
- Dale AM, Fischl B, Sereno MI. Cortical surface-based analysis. I: Segmentation and surface reconstruction. Neuroimage. 1999;9:179–194. doi: 10.1006/nimg.1998.0395. [DOI] [PubMed] [Google Scholar]
- Déjèrine JJ. Anatomie des centres nerveux. Paris: Rueff et Cie; 1901. [Google Scholar]
- de Lacoste MC, Kirkpatrick JB, Ross ED. Topography of the human corpus callosum. J Neuropathol Exp Neurol. 1985;44:578–591. doi: 10.1097/00005072-198511000-00004. [DOI] [PubMed] [Google Scholar]
- Démonet JF, Price C, Wise R, Frackowiak RS. Differential activation of right and left posterior sylvian regions by semantic and phonological tasks: a positron-emission tomography study in normal human subjects. Neurosci Lett. 1994;182:25–28. doi: 10.1016/0304-3940(94)90196-1. [DOI] [PubMed] [Google Scholar]
- Desikan RS, Ségonne F, Fischl B, Quinn BT, Dickerson BC, Blacker D, Buckner RL, Dale AM, Maguire RP, Hyman BT, Albert MS, Killiany RJ. An automated labeling system for subdividing the human cerebral cortex on MRI scans into gyral based regions of interest. Neuroimage. 2006;31:968–980. doi: 10.1016/j.neuroimage.2006.01.021. [DOI] [PubMed] [Google Scholar]
- deVeber G. Stroke and the child's brain: an overview of epidemiology, syndromes and risk factors. Curr Opin Neurol. 2002;15:133–138. doi: 10.1097/00019052-200204000-00002. [DOI] [PubMed] [Google Scholar]
- DeVos KJ, Wyllie E, Geckler C, Kotagal P, Comair Y. Language dominance in patients with early childhood tumors near left hemisphere language areas. Neurology. 1995;45:349–356. doi: 10.1212/wnl.45.2.349. [DOI] [PubMed] [Google Scholar]
- Dick AS, Goldin-Meadow S, Hasson U, Skipper JI, Small SL. Co-speech gestures influence neural activity in brain regions associated with processing semantic information. Hum Brain Mapp. 2009;30:3509–3526. doi: 10.1002/hbm.20774. [DOI] [PMC free article] [PubMed] [Google Scholar]
- Dick AS, Solodkin A, Small SL. Neural development of networks for audiovisual speech comprehension. Brain Lang. 2010;114:101–114. doi: 10.1016/j.bandl.2009.08.005. [DOI] [PMC free article] [PubMed] [Google Scholar]
- Dick AS, Goldin-Meadow S, Solodkin A, Small SL. Gesture in the developing brain. Dev Sci. 2012;15:165–180. doi: 10.1111/j.1467-7687.2011.01100.x. [DOI] [PMC free article] [PubMed] [Google Scholar]
- Dronkers NF, Wilkins DP, Van Valin RD, Jr, Redfern BB, Jaeger JJ. Lesion analysis of the brain areas involved in language comprehension. Cognition. 2004;92:145–177. doi: 10.1016/j.cognition.2003.11.002. [DOI] [PubMed] [Google Scholar]
- Duchowny M, Jayakar P, Harvey AS, Resnick T, Alvarez L, Dean P, Levin B. Language cortex representation: effects of developmental versus acquired pathology. Ann Neurol. 1996;40:31–38. doi: 10.1002/ana.410400108. [DOI] [PubMed] [Google Scholar]
- Duvernoy HM. The human brain: surface, blood supply, and three-dimensional sectional anatomy. Ed 2. New York: Springer; 1999. [Google Scholar]
- Efron B. Nonparametric estimates of standard error: the jackknife, the bootstrap and other methods. Biometrika. 1981;68:589–599. [Google Scholar]
- Efron B. Better bootstrap confidence intervals. J Am Stat Assoc. 1987;82:171–185. [Google Scholar]
- Eyre JA. Corticospinal tract development and its plasticity after perinatal injury. Neurosci Biobehav Rev. 2007;31:1136–1149. doi: 10.1016/j.neubiorev.2007.05.011. [DOI] [PubMed] [Google Scholar]
- Fair DA, Choi AH, Dosenbach YB, Coalson RS, Miezin FM, Petersen SE, Schlaggar BL. The functional organization of trial-related activity in lexical processing after early left hemispheric brain lesions: an event-related fMRI study. Brain Lang. 2010;114:135–146. doi: 10.1016/j.bandl.2009.09.001. [DOI] [PMC free article] [PubMed] [Google Scholar]
- Ferstl EC, Neumann J, Bogler C, Yves von Cramon DY. The extended language network: a meta-analysis of neuroimaging studies on text comprehension. Hum Brain Mapp. 2008;29:581–593. doi: 10.1002/hbm.20422. [DOI] [PMC free article] [PubMed] [Google Scholar]
- Fischl B, Sereno MI, Dale AM. Cortical surface-based analysis. II: Inflation, flattening, and a surface-based coordinate system. Neuroimage. 1999;9:195–207. doi: 10.1006/nimg.1998.0396. [DOI] [PubMed] [Google Scholar]
- Fischl B, van der Kouwe A, Destrieux C, Halgren E, Ségonne F, Salat DH, Busa E, Seidman LJ, Goldstein J, Kennedy D, Caviness V, Makris N, Rosen B, Dale AM. Automatically parcellating the human cerebral cortex. Cereb Cortex. 2004;14:11–22. doi: 10.1093/cercor/bhg087. [DOI] [PubMed] [Google Scholar]
- Fisher RA. On the “probable error” of a coefficient of correlation deduced from a small sample. Metron. 1921;1:3–32. [Google Scholar]
- Fox J. An R and S-Plus companion to applied regression. Thousand Oaks, CA: Sage; 2002. [Google Scholar]
- Fox MD, Snyder AZ, Vincent JL, Corbetta M, Van Essen DC, Raichle ME. The human brain is intrinsically organized into dynamic, anticorrelated functional networks. Proc Natl Acad Sci U S A. 2005;102:9673–9678. doi: 10.1073/pnas.0504136102. [DOI] [PMC free article] [PubMed] [Google Scholar]
- Friederici AD, von Cramon DY, Kotz SA. Role of the corpus callosum in speech comprehension: interfacing syntax and prosody. Neuron. 2007;53:135–145. doi: 10.1016/j.neuron.2006.11.020. [DOI] [PubMed] [Google Scholar]
- Friederici AD, Brauer J, Lohmann G. Maturation of the language network: from inter- to intrahemispheric connectivities. PLoS One. 2011;6:e20726. doi: 10.1371/journal.pone.0020726. [DOI] [PMC free article] [PubMed] [Google Scholar]
- Fryer SL, Frank LR, Spadoni AD, Theilmann RJ, Nagel BJ, Schweinsburg AD, Tapert SF. Microstructural integrity of the corpus callosum linked with neuropsychological performance in adolescents. Brain Cogn. 2008;67:225–233. doi: 10.1016/j.bandc.2008.01.009. [DOI] [PMC free article] [PubMed] [Google Scholar]
- Genovese CR, Lazar NA, Nichols T. Thresholding of statistical maps in functional neuroimaging using the false discovery rate. Neuroimage. 2002;15:870–878. doi: 10.1006/nimg.2001.1037. [DOI] [PubMed] [Google Scholar]
- Geschwind N. The organization of language and the brain. Science. 1970;170:940–944. doi: 10.1126/science.170.3961.940. [DOI] [PubMed] [Google Scholar]
- Glickstein M, Sultan F, Voogd J. Functional localization in the cerebellum. Cortex. 2011;47:59–80. doi: 10.1016/j.cortex.2009.09.001. [DOI] [PubMed] [Google Scholar]
- Goldberg KM, Iglewicz B. Bivariate extensions of the boxplot. Technometrics. 1992;34:307–320. [Google Scholar]
- Grefkes C, Fink GR. Reorganization of cerebral networks after stroke: new insights from neuroimaging with connectivity approaches. Brain. 2011;134:1264–1276. doi: 10.1093/brain/awr033. [DOI] [PMC free article] [PubMed] [Google Scholar]
- Grefkes C, Nowak DA, Eickhoff SB, Dafotakis M, Küst J, Karbe H, Fink GR. Cortical connectivity after subcortical stroke assessed with functional magnetic resonance imaging. Ann Neurol. 2008;63:236–246. doi: 10.1002/ana.21228. [DOI] [PubMed] [Google Scholar]
- Hasson U, Skipper JI, Nusbaum HC, Small SL. Abstract coding of audiovisual speech: beyond sensory representation. Neuron. 2007;56:1116–1126. doi: 10.1016/j.neuron.2007.09.037. [DOI] [PMC free article] [PubMed] [Google Scholar]
- Hasson U, Skipper JI, Wilde MJ, Nusbaum HC, Small SL. Improving the analysis, storage and sharing of neuroimaging data using relational databases and distributed computing. Neuroimage. 2008;39:693–706. doi: 10.1016/j.neuroimage.2007.09.021. [DOI] [PMC free article] [PubMed] [Google Scholar]
- Hertz-Pannier L, Gaillard WD, Mott SH, Cuenod CA, Bookheimer SY, Weinstein S, Conry J, Papero PH, Schiff SJ, Le Bihan D, Theodore WH. Noninvasive assessment of language dominance in children and adolescents with functional MRI: a preliminary study. Neurology. 1997;48:1003–1012. doi: 10.1212/wnl.48.4.1003. [DOI] [PubMed] [Google Scholar]
- Hertz-Pannier L, Chiron C, Jambaqué I, Renaux-Kieffer V, Van de Moortele PF, Delalande O, Fohlen M, Brunelle F, Le Bihan D. Late plasticity for language in a child's nondominant hemisphere A pre-and postsurgery fMRI study. Brain. 2002;125:361–372. doi: 10.1093/brain/awf020. [DOI] [PubMed] [Google Scholar]
- Hines M, Chiu L, McAdams LA, Bentler PM, Lipcamon J. Cognition and the corpus callosum: verbal fluency, visuospatial ability, and language lateralization related to midsagittal surface areas of callosal subregions. Behav Neurosci. 1992;106:3–14. doi: 10.1037//0735-7044.106.1.3. [DOI] [PubMed] [Google Scholar]
- Hinneburg A, Mannila H, Kaislaniemi S, Nevalainen T, Raumolin-Brunberg H. How to handle small samples: bootstrap and Bayesian methods in the analysis of linguistic change. Literary Linguistic Comput. 2007;22:137–150. [Google Scholar]
- Hofer S, Frahm J. Topography of the human corpus callosum revisited–comprehensive fiber tractography using diffusion tensor magnetic resonance imaging. Neuroimage. 2006;32:989–994. doi: 10.1016/j.neuroimage.2006.05.044. [DOI] [PubMed] [Google Scholar]
- Honey CJ, Sporns O. Dynamical consequences of lesions in cortical networks. Hum Brain Mapp. 2008;29:802–809. doi: 10.1002/hbm.20579. [DOI] [PMC free article] [PubMed] [Google Scholar]
- Innocenti GM, Bressoud R. Callosal axons and their development. In: Zaidel E, Iacoboni M, editors. The parallel brain: the cognitive neuroscience of the corpus callosum. Cambridge, MA: MIT; 2003. pp. 11–26. [Google Scholar]
- Innocenti GM, Frost DO. Effects of visual experience on the maturation of the efferent system to the corpus callosum. Nature. 1979;280:231–234. doi: 10.1038/280231a0. [DOI] [PubMed] [Google Scholar]
- Innocenti GM, Price DJ. Exuberance in the development of cortical networks. Nat Rev Neurosci. 2005;6:955–965. doi: 10.1038/nrn1790. [DOI] [PubMed] [Google Scholar]
- Johnson JS, Newport EL. Critical period effects in second language learning: the influence of maturational state on the acquisition of English as a second language. Cogn Psychol. 1989;21:60–99. doi: 10.1016/0010-0285(89)90003-0. [DOI] [PubMed] [Google Scholar]
- Johnson JS, Newport EL. Critical period effects on universal properties of language: the status of subjacency in the acquisition of a second language. Cognition. 1991;39:215–258. doi: 10.1016/0010-0277(91)90054-8. [DOI] [PubMed] [Google Scholar]
- Johnston JM, Vaishnavi SN, Smyth MD, Zhang D, He BJ, Zempel JM, Shimony JS, Snyder AZ, Raichle ME. Loss of resting interhemispheric functional connectivity after complete section of the corpus callosum. J Neurosci. 2008;28:6453–6458. doi: 10.1523/JNEUROSCI.0573-08.2008. [DOI] [PMC free article] [PubMed] [Google Scholar]
- Johnstone T, Ores Walsh KS, Greischar LL, Alexander AL, Fox AS, Davidson RJ, Oakes TR. Motion correction and the use of motion covariates in multiple-subject fMRI analysis. Hum Brain Mapp. 2006;27:779–788. doi: 10.1002/hbm.20219. [DOI] [PMC free article] [PubMed] [Google Scholar]
- Juraska JM, Kopcik JR. Sex and environmental influences on the size and ultrastructure of the rat corpus callosum. Brain Res. 1988;450:1–8. doi: 10.1016/0006-8993(88)91538-7. [DOI] [PubMed] [Google Scholar]
- Kadis DS, Iida K, Kerr EN, Logan WJ, McAndrews MP, Ochi A, Otsubo H, Rutka JT, Snead OC, 3rd, Weiss SK, Smith ML. Intrahemispheric reorganization of language in children with medically intractable epilepsy of the left hemisphere. J Int Neuropsychol Soc. 2007;13:505–516. doi: 10.1017/S1355617707070397. [DOI] [PubMed] [Google Scholar]
- Karunanayaka PR, Holland SK, Schmithorst VJ, Solodkin A, Chen EE, Szaflarski JP, Plante E. Age-related connectivity changes in fMRI data from children listening to stories. Neuroimage. 2007;34:349–360. doi: 10.1016/j.neuroimage.2006.08.028. [DOI] [PubMed] [Google Scholar]
- Lidzba K, Staudt M. Development and (re) organization of language after early brain lesions: capacities and limitation of early brain plasticity. Brain Lang. 2008;106:165–166. doi: 10.1016/j.bandl.2008.05.003. [DOI] [PubMed] [Google Scholar]
- Liégeois F, Connelly A, Cross JH, Boyd SG, Gadian DG, Vargha-Khadem F, Baldeweg T. Language reorganization in children with early-onset lesions of the left hemisphere: an fMRI study. Brain. 2004;127:1229–1236. doi: 10.1093/brain/awh159. [DOI] [PubMed] [Google Scholar]
- Manly BFJ. Randomization, bootstrap and Monte Carlo methods in biology. Boca Raton, FL: Chapman and Hall/CRC; 2007. [Google Scholar]
- Moses P, Courchesne E, Stiles J, Trauner D, Egaas B, Edwards E. Regional size reduction in the human corpus callosum following pre- and perinatal brain injury. Cereb Cortex. 2000;10:1200–1210. doi: 10.1093/cercor/10.12.1200. [DOI] [PubMed] [Google Scholar]
- Mountcastle VB, Atluri PP, Romo R. Selective output-discriminative signals in the motor cortex of waking monkeys. Cereb Cortex. 1992;2:277–294. doi: 10.1093/cercor/2.4.277. [DOI] [PubMed] [Google Scholar]
- Müller RA, Rothermel RD, Behen ME, Muzik O, Mangner TJ, Chakraborty PK, Chugani HT. Brain organization of language after early unilateral lesion: a PET study. Brain Lang. 1998;62:422–451. doi: 10.1006/brln.1997.1931. [DOI] [PubMed] [Google Scholar]
- Naeser MA, Martin PI, Nicholas M, Baker EH, Seekins H, Kobayashi M, Theoret H, Fregni F, Maria-Tormos J, Kurland J, Doron KW, Pascual-Leone A. Improved picture naming in chronic aphasia after TMS to part of right Broca's area: an open-protocol study. Brain Lang. 2005;93:95–105. doi: 10.1016/j.bandl.2004.08.004. [DOI] [PubMed] [Google Scholar]
- Naidich TP, Duvernoy HM, Delman BN, Sorenson AG, Kollias SS, Haacke EM. Duvernoy's atlas of the human brain stem and cerebellum. Vienna: Springer/Wien; 2008. [Google Scholar]
- Northam GB, Liégeois F, Tournier JD, Croft LJ, Johns PN, Chong WK, Wyatt JS, Baldeweg T. Interhemispheric temporal lobe connectivity predicts language impairment in adolescents born preterm. Brain. 2012;135:3781–3798. doi: 10.1093/brain/aws276. [DOI] [PMC free article] [PubMed] [Google Scholar]
- Nowak DA, Grefkes C, Dafotakis M, Eickhoff S, Küst J, Karbe H, Fink GR. Effects of low-frequency repetitive transcranial magnetic stimulation of the contralesional primary motor cortex on movement kinematics and neural activity in subcortical stroke. Arch Neurol. 2008;65:741–747. doi: 10.1001/archneur.65.6.741. [DOI] [PubMed] [Google Scholar]
- Obleser J, Kotz SA. Expectancy constraints in degraded speech modulate the language comprehension network. Cereb Cortex. 2010;20:633–640. doi: 10.1093/cercor/bhp128. [DOI] [PubMed] [Google Scholar]
- Oldfield RC. The assessment and analysis of handedness: the Edinburgh inventory. Neuropsychologia. 1971;9:97–113. doi: 10.1016/0028-3932(71)90067-4. [DOI] [PubMed] [Google Scholar]
- Paul LK. Developmental malformation of the corpus callosum: a review of typical callosal development and examples of developmental disorders with callosal involvement. J Neurodev Disord. 2011;3:3–27. doi: 10.1007/s11689-010-9059-y. [DOI] [PMC free article] [PubMed] [Google Scholar]
- Pollmann S, Maertens M, von Cramon DY, Lepsien J, Hugdahl K. Dichotic listening in patients with splenial and nonsplenial callosal lesions. Neuropsychology. 2002;16:56–64. doi: 10.1037//0894-4105.16.1.56. [DOI] [PubMed] [Google Scholar]
- Power JD, Barnes KA, Snyder AZ, Schlaggar BL, Petersen SE. Spurious but systematic correlations in functional connectivity MRI networks arise from subject motion. Neuroimage. 2012a;59:2142–2154. doi: 10.1016/j.neuroimage.2011.10.018. [DOI] [PMC free article] [PubMed] [Google Scholar]
- Power JD, Barnes KA, Snyder AZ, Schlaggar BL, Petersen SE. Steps toward optimizing motion artifact removal in functional connectivity MRI; a reply to Carp. Neuroimage. 2012b doi: 10.1016/j.neuroimage.2012.03.017. Advance online publication. Retrieved December 12, 2012. [DOI] [PMC free article] [PubMed] [Google Scholar]
- Price CJ. The anatomy of language: a review of 100 fMRI studies published in 2009. Ann N Y Acad Sci. 2010;1191:62–88. doi: 10.1111/j.1749-6632.2010.05444.x. [DOI] [PubMed] [Google Scholar]
- Price CJ, Crinion J. The latest on functional imaging studies of aphasic stroke. Curr Opin Neurol. 2005;18:429–434. doi: 10.1097/01.wco.0000168081.76859.c1. [DOI] [PubMed] [Google Scholar]
- Putnam MC, Steven MS, Doron KW, Riggall AC, Gazzaniga MS. Cortical projection topography of the human splenium: hemispheric asymmetry and individual differences. J Cogn Neurosci. 2010;22:1662–1669. doi: 10.1162/jocn.2009.21290. [DOI] [PubMed] [Google Scholar]
- Quigley M, Cordes D, Turski P, Moritz C, Haughton V, Seth R, Meyerand ME. Role of the corpus callosum in functional connectivity. Am J Neuroradiol. 2003;24:208–212. [PMC free article] [PubMed] [Google Scholar]
- R Development Core Team. R: a language and environment for statistical computing. Vienna: R Foundation for Statistical Computing; 2011. [Google Scholar]
- Raja Beharelle A, Dick AS, Josse G, Solodkin A, Huttenlocher PR, Levine SC, Small SL. Left hemisphere regions are critical for language in the face of early left focal brain injury. Brain. 2010;133:1707–1716. doi: 10.1093/brain/awq104. [DOI] [PMC free article] [PubMed] [Google Scholar]
- Raju TN, Nelson KB, Ferriero D, Lynch JK. Ischemic perinatal stroke: summary of a workshop sponsored by the National Institute of Child Health and Human Development and the National Institute of Neurological Disorders and Stroke. Pediatrics. 2007;120:609–616. doi: 10.1542/peds.2007-0336. [DOI] [PubMed] [Google Scholar]
- Rasmussen T, Milner B. The role of early left-brain injury in determining lateralization of cerebral speech functions. Ann N Y Acad Sci. 1977;299:355–369. doi: 10.1111/j.1749-6632.1977.tb41921.x. [DOI] [PubMed] [Google Scholar]
- Reilly JS, Bates EA, Marchman VA. Narrative discourse in children with early focal brain injury. Brain Lang. 1998;61:335–375. doi: 10.1006/brln.1997.1882. [DOI] [PubMed] [Google Scholar]
- Rosen GD. The effects of early injury to the cortical plate on callosal connectivity: commentary on Innocenti. In: Zaidel E, Iacoboni M, editors. The parallel brain: the cognitive neuroscience of the corpus callosum. Cambridge, MA: MIT; 2003. pp. 27–29. [Google Scholar]
- Rosen HJ, Petersen SE, Linenweber MR, Snyder AZ, White DA, Chapman L, Dromerick AW, Fiez JA, Corbetta MD. Neural correlates of recovery from aphasia after damage to left inferior frontal cortex. Neurology. 2000;55:1883–1894. doi: 10.1212/wnl.55.12.1883. [DOI] [PubMed] [Google Scholar]
- Rosina A, Provini L. Pontocerebellar system linking the two hemispheres by intracerebellar branching. Brain Res. 1984;296:365–369. doi: 10.1016/0006-8993(84)90075-1. [DOI] [PubMed] [Google Scholar]
- Saenz M, Fine I. Topographic organization of V1 projections through the corpus callosum in humans. Neuroimage. 2010;52:1224–1229. doi: 10.1016/j.neuroimage.2010.05.060. [DOI] [PMC free article] [PubMed] [Google Scholar]
- Sánchez MM, Hearn EF, Do D, Rilling JK, Herndon JG. Differential rearing affects corpus callosum size and cognitive function of rhesus monkeys. Brain Res. 1998;812:38–49. doi: 10.1016/s0006-8993(98)00857-9. [DOI] [PubMed] [Google Scholar]
- Sanfilipo MP, Benedict RH, Zivadinov R, Bakshi R. Correction for intracranial volume in analysis of whole brain atrophy in multiple sclerosis: the proportion vs. residual method. Neuroimage. 2004;22:1732–1743. doi: 10.1016/j.neuroimage.2004.03.037. [DOI] [PubMed] [Google Scholar]
- Saur D, Lange R, Baumgaertner A, Schraknepper V, Willmes K, Rijntjes M, Weiller C. Dynamics of language reorganization after stroke. Brain. 2006;129:1371–1384. doi: 10.1093/brain/awl090. [DOI] [PubMed] [Google Scholar]
- Schmahmann JD, Pandya DN. Fiber pathways of the brain. New York: Oxford: Oxford UP; 2006. [Google Scholar]
- Schmithorst VJ, Holland SK, Plante E. Development of effective connectivity for narrative comprehension in children. Neuroreport. 2007;18:1411–1415. doi: 10.1097/WNR.0b013e3282e9a4ef. [DOI] [PMC free article] [PubMed] [Google Scholar]
- Schulte T, Pfefferbaum A, Sullivan EV. Parallel interhemispheric processing in aging and alcoholism: relation to corpus callosum size. Neuropsychologia. 2004;42:257–271. doi: 10.1016/s0028-3932(03)00155-6. [DOI] [PubMed] [Google Scholar]
- Seghier ML, Fagan E, Price CJ. Functional subdivisions in the left angular gyrus where the semantic system meets and diverges from the default network. J Neurosci. 2010;30:16809–16817. doi: 10.1523/JNEUROSCI.3377-10.2010. [DOI] [PMC free article] [PubMed] [Google Scholar]
- Semel E, Wiig EH, Secord WA. Clinical evaluation of language fundamentals-3 (CELF-3) San Antonio, TX: The Psychological Corporation; 1995. [Google Scholar]
- Seymour SE, Reuter-Lorenz PA, Gazzaniga MS. The disconnection syndrome. Basic findings reaffirmed. Brain. 1994;117:105–115. doi: 10.1093/brain/117.1.105. [DOI] [PubMed] [Google Scholar]
- Skipper JI, Nusbaum HC, Small SL. Listening to talking faces: motor cortical activation during speech perception. Neuroimage. 2005;25:76–89. doi: 10.1016/j.neuroimage.2004.11.006. [DOI] [PubMed] [Google Scholar]
- Skipper JI, Goldin-Meadow S, Nusbaum HC, Small SL. Gestures orchestrate brain networks for language understanding. Curr Biol. 2009;19:661–667. doi: 10.1016/j.cub.2009.02.051. [DOI] [PMC free article] [PubMed] [Google Scholar]
- Solodkin A, Hasson U, Siugzdaite R, Schiel M, Chen EE, Kotter R, Small SL. Virtual brain transplantation (VBT): a method for accurate image registration and parcellation in large cortical stroke. Arch Ital Biol. 2010;148:219–241. [PubMed] [Google Scholar]
- Staudt M. Reorganization after pre- and perinatal brain lesions. J Anat. 2010;217:469–474. doi: 10.1111/j.1469-7580.2010.01262.x. [DOI] [PMC free article] [PubMed] [Google Scholar]
- Staudt M, Niemann G, Grodd W, Krägeloh-Mann I. The pyramidal tract in congenital hemiparesis: relationship between morphology and function in periventricular lesions. Neuropediatrics. 2000;31:257–264. doi: 10.1055/s-2000-9239. [DOI] [PubMed] [Google Scholar]
- Staudt M, Grodd W, Niemann G, Wildgruber D, Erb M, Krägeloh-Mann I. Early left periventricular brain lesions induce right hemispheric organization of speech. Neurology. 2001;57:122–125. doi: 10.1212/wnl.57.1.122. [DOI] [PubMed] [Google Scholar]
- Staudt M, Lidzba K, Grodd W, Wildgruber D, Erb M, Krägeloh-Mann I. Right-hemispheric organization of language following early left-sided brain lesions: functional MRI topography. Neuroimage. 2002;16:954–967. doi: 10.1006/nimg.2002.1108. [DOI] [PubMed] [Google Scholar]
- Stiles J, Reilly J, Paul B, Moses P. Cognitive development following early brain injury: evidence for neural adaptation. Trends Cogn Sci. 2005;9:136–143. doi: 10.1016/j.tics.2005.01.002. [DOI] [PubMed] [Google Scholar]
- Sullivan EV, Rosenbloom MJ, Desmond JE, Pfefferbaum A. Sex differences in corpus callosum size: relationship to age and intracranial size. Neurobiol Aging. 2001;22:603–611. doi: 10.1016/s0197-4580(01)00232-9. [DOI] [PubMed] [Google Scholar]
- Takahashi E, Folkerth RD, Galaburda AM, Grant PE. Emerging cerebral connectivity in the human fetal brain: an MR tractography study. Cereb Cortex. 2012;22:455–464. doi: 10.1093/cercor/bhr126. [DOI] [PMC free article] [PubMed] [Google Scholar]
- Tamnes CK, Ostby Y, Fjell AM, Westlye LT, Due-Tønnessen P, Walhovd KB. Brain maturation in adolescence and young adulthood: regional age-related changes in cortical thickness and white matter volume and microstructure. Cereb Cortex. 2010;20:534–548. doi: 10.1093/cercor/bhp118. [DOI] [PubMed] [Google Scholar]
- Teicher MH, Dumont NL, Ito Y, Vaituzis C, Giedd JN, Andersen SL. Childhood neglect is associated with reduced corpus callosum area. Biol Psychiatry. 2004;56:80–85. doi: 10.1016/j.biopsych.2004.03.016. [DOI] [PubMed] [Google Scholar]
- Turken AU, Dronkers NF. The neural architecture of the language comprehension network: converging evidence from lesion and connectivity analyses. Front Syst Neurosci. 2011;5:1–20. doi: 10.3389/fnsys.2011.00001. [DOI] [PMC free article] [PubMed] [Google Scholar]
- Vargha-Khadem F, O'Gorman AM, Watters GV. Aphasia and handedness in relation to hemispheric side, age at injury and severity of cerebral lesion during childhood. Brain. 1985;108:677–696. doi: 10.1093/brain/108.3.677. [DOI] [PubMed] [Google Scholar]
- Venables WN, Ripley BD. Modern applied statistics with S. Ed 4. New York: Springer Verlag; 2010. [Google Scholar]
- Volpe JJ. Neurology of the newborn. Ed 5. Philadelphia, PA: Saunders; 2008. [Google Scholar]
- Wagstaff DA, Elek E, Kulis S, Marsiglia F. Using a nonparametric bootstrap to obtain a confidence interval for Pearson's r with cluster randomized data: a case study. J Prim Prev. 2009;30:497–512. doi: 10.1007/s10935-009-0191-y. [DOI] [PMC free article] [PubMed] [Google Scholar]
- Wang L, Yu C, Chen H, Qin W, He Y, Fan F, Zhang Y, Wang M, Li K, Zang Y, Woodward TS, Zhu C. Dynamic functional reorganization of the motor execution network after stroke. Brain. 2010;133:1224–1238. doi: 10.1093/brain/awq043. [DOI] [PubMed] [Google Scholar]
- Wechsler D. WISC-III: Wechsler intelligence scale for children. Ed 3. San Antonio, TX: The Psychological Corporation; 1991. [Google Scholar]
- Wechsler D. WAIS-III: Administration and scoring manual: Wechsler adult intelligence scale. San Antonio, TX: The Psychological Corporation; 1997. [Google Scholar]
- Wernicke C. The symptom complex of aphasia. In: Church A, editor. Diseases of the nervous system. New York: Appleton; 1908. pp. 265–324. [Google Scholar]
- Westerhausen R, Grüner R, Specht K, Hugdahl K. Functional relevance of interindividual differences in temporal lobe callosal pathways: a DTI tractography study. Cereb Cortex. 2009;19:1322–1329. doi: 10.1093/cercor/bhn173. [DOI] [PubMed] [Google Scholar]
- Whitwell JL, Crum WR, Watt HC, Fox NC. Normalization of cerebral volumes by use of intracranial volume: implications for longitudinal quantitative MR imaging. Am J Neuroradiol. 2001;22:1483–1489. [PMC free article] [PubMed] [Google Scholar]
- Wilcox RR. Introduction to robust estimation and hypothesis testing. Ed 2. San Diego, CA: Academic; 2005. [Google Scholar]
- Wilkinson L. Statistical methods in psychology journals: guidelines and explanations. Am Psychologist. 1999;54:594–604. [Google Scholar]
- Witelson SF. Hand and sex differences in the isthmus and genu of the human corpus callosum. A postmortem morphological study. Brain. 1989;112:799–835. doi: 10.1093/brain/112.3.799. [DOI] [PubMed] [Google Scholar]
- Woods BT, Carey S. Language deficits after apparent clinical recovery from childhood aphasia. Ann Neurol. 1979;6:405–409. doi: 10.1002/ana.410060505. [DOI] [PubMed] [Google Scholar]
- Woods BT, Teuber HL. Changing patterns of childhood aphasia. Ann Neurol. 1978;3:273–280. doi: 10.1002/ana.410030315. [DOI] [PubMed] [Google Scholar]
- Wright DB, London K. Modern regression techniques using R: a practical guide. London: Sage; 2009. [Google Scholar]
- Yazgan MY, Wexler BE, Kinsbourne M, Peterson B, Leckman JF. Functional significance of individual variations in callosal area. Neuropsychologia. 1995;33:769–779. doi: 10.1016/0028-3932(95)00018-x. [DOI] [PubMed] [Google Scholar]
- Zaidel E, Iacoboni M. The parallel brain: the cognitive neuroscience of the corpus callosum. Cambridge, MA: MIT; 2003. [Google Scholar]
- Zalc B, Fields RD. Do action potentials regulate myelination? Neuroscientist. 2000;6:5–13. doi: 10.1177/107385840000600109. [DOI] [PMC free article] [PubMed] [Google Scholar]
- Zarei M, Johansen-Berg H, Smith S, Ciccarelli O, Thompson AJ, Matthews PM. Functional anatomy of interhemispheric cortical connections in the human brain. J Anat. 2006;209:311–320. doi: 10.1111/j.1469-7580.2006.00615.x. [DOI] [PMC free article] [PubMed] [Google Scholar]