Abstract
Signaling networks regulate cellular responses to environmental stimuli through cascades of protein interactions. External signals can trigger cells to polarize and move in a specific direction. During migration, spatially localized activity of proteins is maintained. To investigate the effects of morphological changes on intracellular signaling, we developed a numerical scheme consisting of a cut cell finite volume spatial discretization coupled with level set methods to simulate the resulting advection-reaction-diffusion system. We then apply the method to several biochemical reaction networks in changing geometries. We found that a Turing instability can develop exclusively by cell deformations that maintain constant area. For a Turing system with a geometry-dependent single or double peak solution, simulations in a dynamically changing geometry suggest that a single peak solution is the only stable one, independent of the oscillation frequency. The method is also applied to a model of a signaling network in a migrating fibroblast.
Keywords: Systems biology, Numerical methods, Advection-reaction-diffusion equation, Level set methods
1. Introduction
Extracellular signaling molecules convey information about environmental stimuli and prompt physiological changes in cells. The biochemical interactions resulting from an external or internal signal form a signal transduction network. The study of these networks is important in cell biology as well as medicine because disregulation of signaling pathways leads to diseases such as cancer, diabetes, heart disease, and autoimmunity [21, 22, 24].
In many pathways, proper signal transduction requires that both the spatial and temporal dynamics of the system are tightly regulated [19]. For example, recent experiments have revealed spatial gradients of protein activation in migrating cells [20, 32, 36]. Mathematical models can be used to elucidate the control mechanisms used to regulate the spatiotemporal dynamics of signaling pathways. Recent computational studies of signaling networks have been carried out in fixed boundaries [33, 29, 23, 43]. Common simulation methods include the finite volume methods in [43, 40] and finite element methods [41, 46].
Few simulation methods exist for moving boundary problems coupled with intracellular dynamics. When solving moving boundary problems with finite element methods, mesh generation is challenging problem. In [37] a physical model of a motile cell was simulated with finite element methods by triangulating at every time step. This may not be computationally feasible with refined grids or for three dimensional simulations. The Cellular Potts Model (CPM) [12], which is a type of cellular automata, has been used to simulate a motile cell [27]. The dynamics in the CPM are based on minimizing a Hamiltonian with the Metropolis algorithm [28]. The CPM includes a system temperature that represents fluctuations in the system. Though this type of model can produce qualitatively realistic data, it is unclear what quantitative data can be obtained from simulations. Another way to simulate a motile cell is by a one-dimensional model in [10]. New methods are needed to simulate signaling networks in moving geometries in two and three dimensions.
We propose a novel method for simulating biochemical reaction networks in moving cell morphologies. The method presented here extends the results in [43], where systems of reaction-diffusion equations were solved in fixed geometries. The method presented here numerically solves systems of advection-reaction-diffusion equations on an underlying Cartesian grid. The cell geometry is embedded with a signed distance function and updated with level set methods [34, 35, 42]. The operators are separated into an advection term and a combined reaction-diffusion term. Reaction-diffusion terms are updated with an implicit differential-algebraic formulation from [43]. Advection terms are treated with the same spatial discretization used in level set methods. We simulated a Turing system with an imposed boundary deformation. We found that geometric changes that maintain constant area changed the stability properties of the system. The same Turing system was simulated with different parameters and initial conditions so that a stable two peak solution is formed in an ellipsoid geometry. An oscillatory boundary deformation was imposed at different frequencies. Our investigations suggest that the single peak solution is the only stable one, independent of the frequency. An advection-reaction-diffusion system was simulated in a migrating fibroblast. We compared the steady state concentration profiles to transient profiles, and found that transient activation can be sustained through advective terms.
The remainder of the manuscript is organized as follows. The general form of the model equations is presented in section 2. It includes several species, diffusion in the interior for each species, reaction between species in the interior and activation reactions for the species on the boundary. The domain is then advected in space using a specified velocity field. In section 3, we lay out the numerical foundations. The domain advection is treated with a level set formulation. The diffusion is described using a cut cell method, and solved simultaneously as the reaction terms from the model equations using a differential algebraic solver. The numerical method is validated through a series of convergence tests in section 4. The method is demonstrated with a Turing system in section 5. In section 6, we simulate a biologically relevant model system using a realistic cellular time-dependent geometry.
2. Mathematical Formulation
Spatial models of biochemical reaction networks are typically represented using partial differential equations consisting of advection, reaction, diffusion terms. For simplicity we restrict ourselves to two spatial dimensions x and y. Because our method is based on a finite volume approach, extending it to three dimensions should be straightforward. In a system consisting of n chemical species, the concentration of the ith species ci evolves in space and time according to the following equation:
| (2.1) |
The flux density is given by
| (2.2) |
where Di is the diffusion coefficient. The elements of the vector c are the concentrations of the n chemical species. The function fi(c) models reactions within the cell that affect ci. These reaction terms encompass processes such as activation, degradation, protein modifications and the formation of molecular complexes. They typically include nonlinear terms, such as those arising from Michaelis-Menten kinetics. The entire cell propagates according to the velocity field U⃗. Reactions also may occur on the cell membrane yielding nonlinear conditions on the time-dependent boundary ∂Ω(t),
| (2.3) |
Eqs. (2.1) and (2.3) are solved subject to appropriate initial conditions ci(x, y, 0) for each species in the system.
3. Numerical Methods
In this section, we detail the methods used to simulate models of signaling and regulatory pathways in realistic cellular geometries that are changing in time. This involves obtaining the domain from live-cell images and embedding the boundary in a signed distance function [43, 25]. We describe level set methods and the finite volume method used in the complete time update, which involves operator splitting. The advection operator is treated separately from the combined reaction-diffusion operator. Before discussing the splitting method in section 3.3, we discuss numerical methods for each operator individually.
3.1. Computational domain and level set methods
The computational domain can be specified explicitly or obtained from live cell images. For example, cell images can be smoothed with a Gaussian filter, and the boundary obtained by thresholding the smoothened image. A signed distance function is then constructed such that the zero level set is the boundary of the cell. The signed distance function denoted by φ(x, y, 0) is the initial value for equation of motion in level set methods. Note that φ(x, y, t) is defined on the Cartesian grid (x0+iΔx, y0+jΔy) for 0 ≤ i ≤ N and 0 ≤ j ≤ M. The stepsizes are defined as Δx = 1/N and Δy = 1/M.
Level set methods are algorithms for tracking the time evolution of boundaries and interfaces. The evolution of the signed distance φ is given by the level set equation originally presented in [35],
| (3.1) |
where F is the speed in the normal direction to the boundary, which can be a function of various quantities such as normal direction, curvature, etc. U⃗ is the advection velocity that does not depend on the boundary itself, but may depend on space and time. In this manuscript, we consider the latter term. However, for more complicated models where concentration on the cell membrane affects the motion of the membrane, the former term will be necessary. In order to numerically solve the partial differential equation in Eq. (3.1), spatial and temporal operators must be discretized. The boundary that we wish to capture may be continuous, but not differentiable. Schemes developed to numerically solve hyperbolic conservation laws can be applied to Eq. (3.1). We implemented a second order upwinding scheme to discretize the advection operators in Eq. (3.1). Specifically, we used an essentially non-oscillatory (ENO) scheme to approximate spatial derivatives [14]. The finite difference schemes can also be found in [42].
A second order Runge Kutta method is used to update Eq. (3.1) in time. Following [2] Eq. (3.1) is written as
Then the time update is
| (3.2) |
The time step tn is defined as nΔt. In section 3.3, we describe the role of the level set update in the complete update for state of the advection-reaction-diffusion system.
3.2. Finite volume method
The reaction and diffusion terms in Eq. (2.1) with boundary equations Eq. (2.3) are advanced according to the finite volume method presented in [43]. The concentration over a control volume Vij is stored at cij,
| (3.3) |
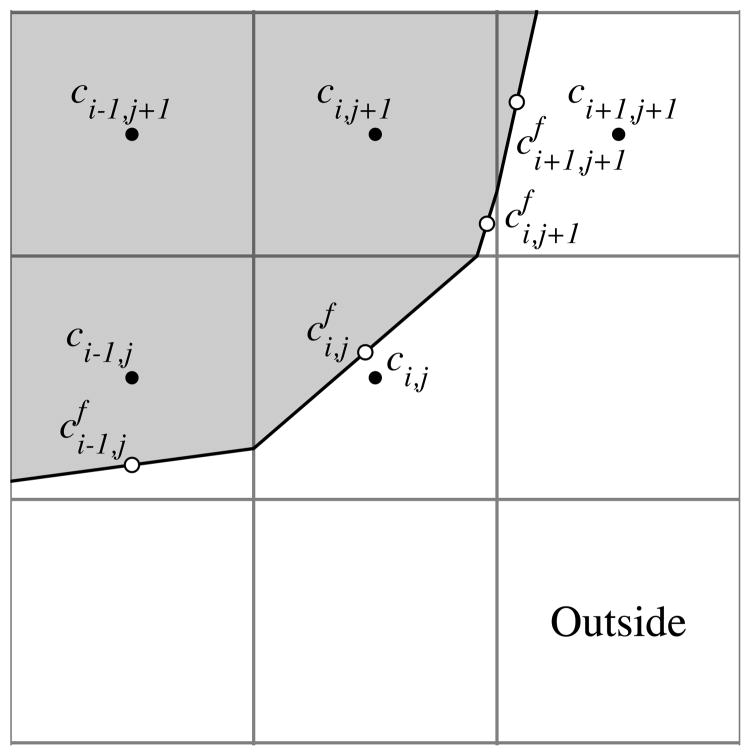
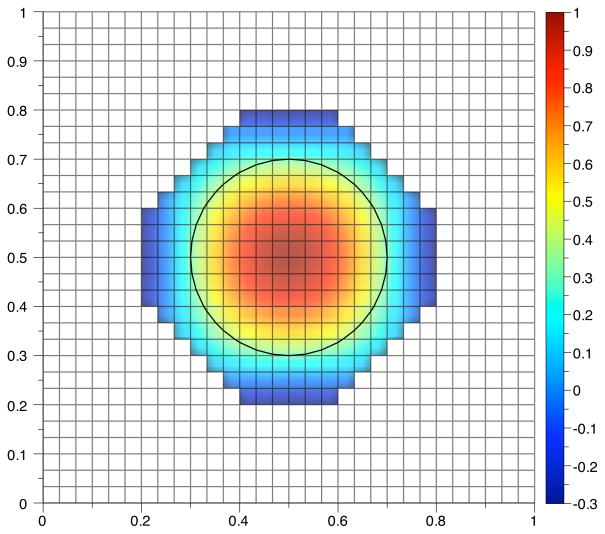
The grid where concentration values are located is different from the grid where signed distance values are stored. For the description of the finite volume method, the (i, j) grid points are cell centered, and are located at (x0 + (i + 1/2)Δx, y0 + (j + 1/2)Δy) for 0 ≤ i ≤ N and 0 ≤ j ≤ M. In contrast, the signed distance function is defined on edge-centered grid points so that the zero level set defines control volumes. Fig. 3.1 illustrates the computational points in the finite volume method. Boundary values are located at the midpoint of the piecewise linear boundary approximation.
Fig. 3.1.
The solid line indicates a piecewise linear approximation to the zero level set of the signed distance function. The black points labeled ci,j indicate values that lie on a Cartesian grid. White points labeled indicate values associated with the boundary.
Inserting Eq. (3.3) into the reaction and diffusion terms in Eq. (2.1) produces
| (3.4) |
The divergence theorem gives us
| (3.5) |
For interior grid cells, we have
| (3.6) |
where and . Approximation of the integrals in Eq. (3.6) with the midpoint rule yields
| (3.7) |
In computational grid cells with volume Vi,j = ΔxΔy, approximating the gradient terms with centered differences yields the standard five point Laplacian approximation.
We refer to computational cells where 0 < Vi,j < ΔxΔy as cut cells. The volume of the polygon can be calculated exactly by a boundary integral or triangulation. The centroid of the cut cell can be computed similarly. The average value over a cut cell is approximated by the value of the centroid when initializing the solver. In general, there are up to five surface integrals to approximate when constructing the right hand side of Eq. (3.5) for a cut cell. If each approximate integral is denoted by the surface fluxes Ji,j, then Eq. (3.5) becomes,
| (3.8) |
We proceed to define each term on the right hand side of the above equation. On a Cartesian cell edge with length Δx or Δy, the standard cell-centered approximation of the gradient at the midpoint of the face is used. For example, the flux across the left face in the (i, j + 1) control volume in Fig. 3.1 is
| (3.9) |
The length of a cut cell edge is denoted by ai±1/2,jΔy or ai,j±1/2Δx. In order to find,
| (3.10) |
where xa = xi+1/2 − ai−1/2,jΔy and xb = xi+1/2, we approximate the gradient at the midpoint of the partial edge with linear interpolation of discretized gradients located at the midpoint of two full edges. A linear interpolation formula between two points y1 and y2 as a function of a parameter μ ∈ [0, 1] is,
| (3.11) |
In the case of a cut cell edge, μ = (1 + A)/2, where A = ai±1/2,j or ai,j±1/2. For example, to construct the flux Ji−1/2,j in the (i, j) cut cell in Fig. 3.1, the discretized gradient at (xi−1/2, yj) is y2 in the interpolation formula (and the approximate gradient at (xi−1/2, yj+1) is y1), and
| (3.12) |
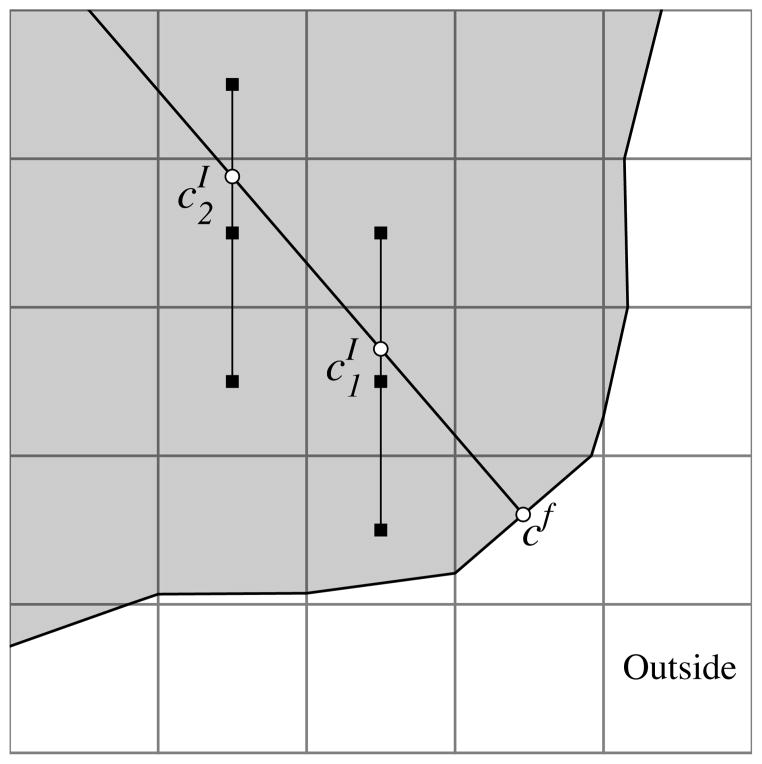
To calculate the flux through a boundary, e.g. , we compute the gradient along a line normal to the boundary and centered at the boundary midpoint. To find function values on the normal line, we interpolate using three equally spaced cell centered points (Fig. 3.2). If the normal line is oriented with an angle of π/4 < |θ| < 3π/4 relative to the horizontal grid lines, horizontal grid points are used to compute the values on the line. Otherwise vertical points are used. The two points computed along the normal line and the value on the boundary are then used to construct a quadratic polynomial. The concentration gradient is calculated by differentiating the quadratic polynomial and evaluating the result at the boundary point cf,
Fig. 3.2.
Circles indicate interpolated values that depend on the grid-based values.
| (3.13) |
where and are the interpolated values along the normal line and d1 and d2, respectively, are the distances of these two points from the boundary. The flux in Eq. (3.8) is calculated by multiplying Gf by the area of the cut cell edge af and the diffusion coefficient D. The discretization of the boundary condition Eq. (2.3) becomes the algebraic equation
| (3.14) |
3.2.1. Temporal update for the finite volume method
The time update in Eq. 3.5 is handled by the differential-algebraic solver DASPK [6] because of the additional algebraic constraints from the discretized boundary conditions in Eq. (3.14). The general form for a differential-algebraic system is
| (3.15) |
where C is an (Ng + Nb) × 1 vector. The first Ng entries are associated with Cartesian grid based values in the differential-algebraic system from the discretization of Eq. (2.1) for the chemical species concentrations. These entries have an explicit time derivative term. The Nb remaining entries arise from discretizing the boundary conditions. DAPSK uses backward differentiation formulas (BDF) to discretize the time derivative in Eq. (3.15). BDF formulas involve replacing time derivatives with derivatives of interpolating polynomials. With this approximation, the time derivative of Cn+1 is given by
| (3.16) |
The coefficients of the BDF are given by αi and the order of the BDF method is indexed by k. The implicit equation to be solved at each time step is
| (3.17) |
where n is the time index. The time step Δtn+1 is chosen based on the behavior of the solution [4]. The above equation can be written as
| (3.18) |
where v is a vector that depends on previously computed time values. Details of choosing stepsize, starting selection, and variable order strategies are found in [4]. The nonlinear system is solved with a modified Newton’s method, given by
| (3.19) |
where ζ is a constant chosen to speed up convergence and m is the iteration index. We use a sparse matrix representation to invert the iteration matrix
| (3.20) |
Specifically the Generalized Minimal Residual (GMRES) method [39] with an incomplete LU (ILU) preconditioner from [38] is used to solve the linear system.
3.3. Overview of complete temporal update
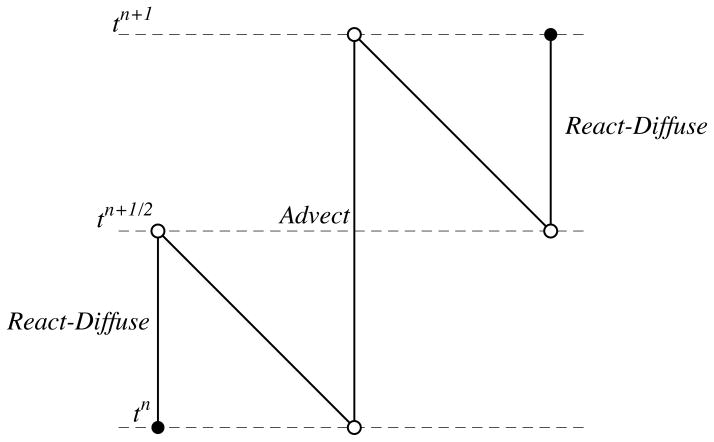
The complete numerical scheme involves splitting the advection operator from combined reaction-diffusion operator. We implemented the second order Strang operator splitting method. Fig. 3.3 illustrates the separation of the operators as the system is updated in one time step Δt from tn to tn+1. For a given chemical species c(x, y, t), the reaction-diffusion operator with the appropriate boundary conditions is solved using the finite volume method on the fixed boundary Ω(tn) for a half time step Δt/2, tn to tn+1/2. The time steps are uniform for complete temporal update. However, the method described in section 3.2.1 uses variable time stepping to increase the accuracy and stability. As a result, the requested output at tn+1/2 may be interpolated with methods described in [4] to obtain the solution at tn + Δt/2. Chemical species and the boundary are advected for a full time step Δt from tn to tn+1 with the fixed time step method given by Eqs. (3.2). The reaction-diffusion solver is reinitialized. The reaction-diffusion equation is then solved on the fixed domain Ω(tn+1) from tn+1/2 until tn+1. This concludes the update. By splitting the operators this way, the implicit solver has the same domain discretization at the beginning and end of the simulation. In the cut cell method, there are three types of points: interior, cut cells and boundary points. In the remainder of this section, we proceed to discuss the details involved in the process of updating and reinitializing these values during a time step.
Fig. 3.3.
Strang splitting scheme.
3.3.1. Interior advection scheme
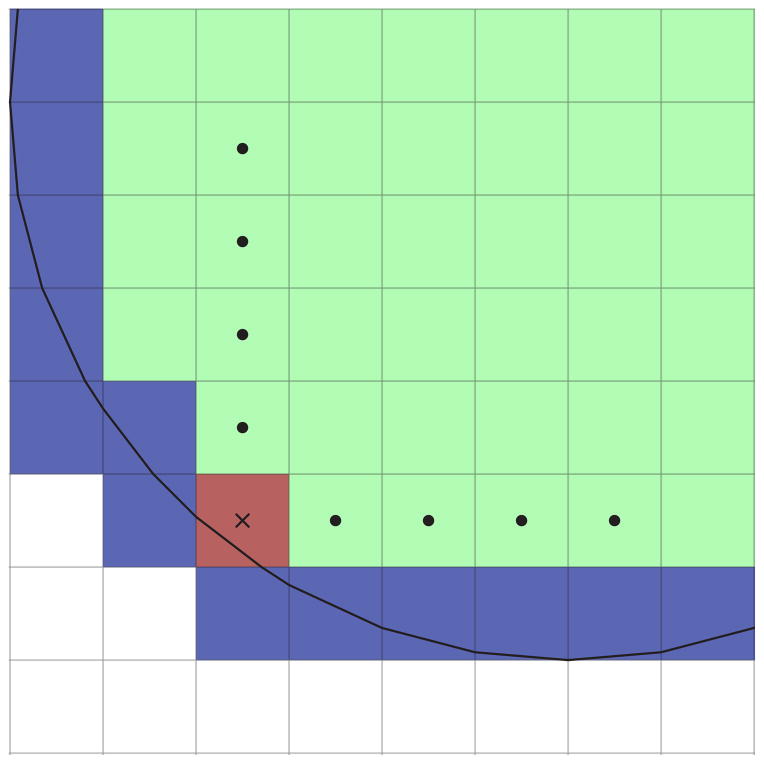
To approximate the gradient operator with second order upwinding, ghost cells are needed. Minimally two cells in the north, south, east, and west direction are required to create a valid advection update for interior cells. The values in cut cells are recomputed because they do not correspond to values at grid points. The extension values are calculated with bicubic interpolation that is exact for cubic polynomials in p(x), q(y) and p(x) · q(y). The values for the interpolation are located along grid lines. If more than one choice is available, interpolation is performed along each line and the resulting value is the average of these interpolations (Fig. 3.4.) The scheme shown in Fig. 3.4 requires the grid cell containing the interpolation value to lie horizontally or vertically (i.e. not diagonally) of an interior grid cell. The cell directly left of the red grid cell in Fig. 3.4 does not satisfy this requirement. This type of cell is marked for the next band of interpolation. The interpolation continues in bands until sufficient coverage for an advection update. Fig. 3.5 shows an extension computed by interpolation the function,
Fig. 3.4.
Interpolation diagram. Interior values are colored green. Cut cell values are colored blue. Circles mark the interior points used to interpolate at the point marked with a cross.
Fig. 3.5.
Example of an interior extension.
from interior points with a grid size of Δx = 1/30. The extension is larger than two bands in certain places to ensure a valid extension when the front moves.
3.3.2. Boundary advection scheme
The advection scheme requires concentration values to be located on a Cartesian grid. Information from boundary values is lost after the advection update. One possible solution is to employ the same bicubic interpolation scheme to extrapolate boundary values from interior values. The new boundary values can be input into the reaction-diffusion solver. Rather than bootstrap these values, we advect the boundary values separately for the purpose of reinitializing the reaction-diffusion solver.
We accomplish this by implementing a method for advecting a scalar on a propagating front originally presented in [2]. We summarize as follows. A scalar function S(x, y, t) on a boundary that advects with a specified velocity field U⃗ and speed function F satisfies the equation,
| (3.21) |
where n⃗ = (nx, ny) is the normal to the surface at the point (x, y) and κ is the curvature operator. The notation ux denotes the partial derivative with respect to x of the first component of the velocity vector. The extra second term on the left hand side and curvature terms come from simplifying the conservative advection equation. The derivation can be found in [2]. The scalar S is extended off the interface so that finite differences can be used to discretize the various operators. The extension is based on methods for construction extension velocities presented in [1]. A temporary signed distance function φtemp is constructed near the zero level set. This function satisfies the equation
| (3.22) |
The above construction ensures that the level set function φ remains the signed distance function when the function propagates with an extension velocity over time [1]. As φtemp is constructed, Eq. (3.22) is solved. The numerical solution is computed with a method that is similar to solving the Eikonal equation with fast marching methods [26].
4. Convergence Tests
To test the numerical method, the computed solution to the advection-reaction-diffusion equation is compared to the fixed boundary solution computed by the finite volume algorithm in Section 3.2. Given a specified constant velocity field U⃗ = (u, v) and initial condition f(x, y, 0), the advection-reaction-diffusion equation is numerically solved until tend. To compare to the fixed boundary solution, the reaction-diffusion solver is initialized with the value f(x−utend, y−vtend) and the exact boundary Γ(tend). The solution on a fixed domain is solved from t = 0 until tend for comparison to the advection-reaction-diffusion solution. The output from the simulation is compared to the solution for the problem with advection. In the following tests, the ratio Δx/Δt = 4 is fixed. During a grid refinement, the time step is also reduced by the same factor as the spatial step.
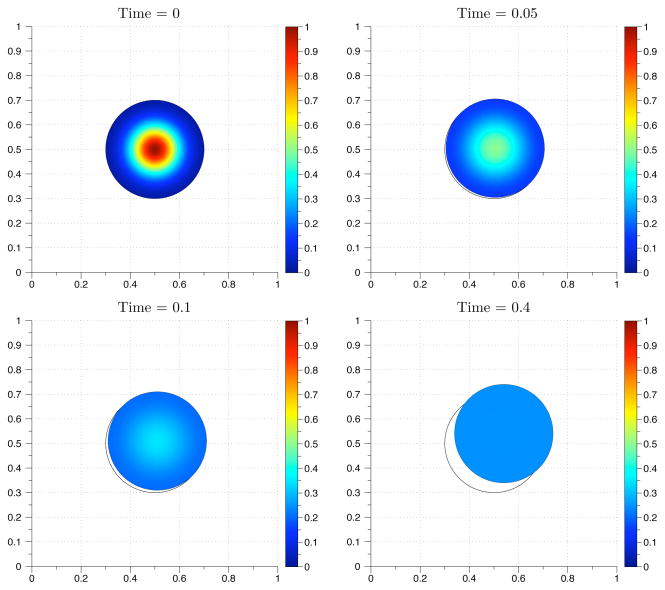
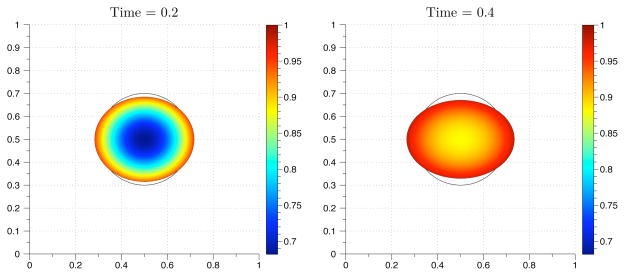
First we test our method by solving an advection-diffusion equation propagating with constant velocity on the unit box. In our first example, the initial condition is a Gaussian function
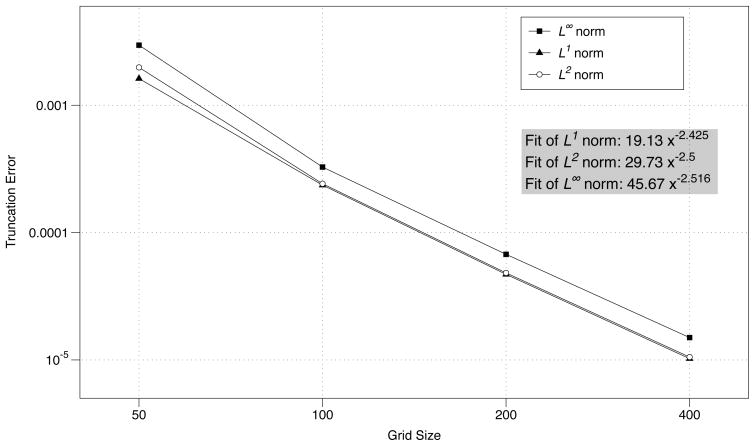
The boundary condition is no flux on the boundary given by the zero level set of the signed distance function φ, denoted Γ(t). A time series from the computed solution to the advection-diffusion equation is shown in Fig. 4.1. The truncation error is show in Fig. 4.2. The norms are defined as in [17],
Fig. 4.1.
Time values from the computed solution of an advection-diffusion equation solved on a circle with Gaussian initial conditions. The diffusion coefficient for this simulation was 0.05. The grid size is 200 × 200. The initial boundary is the circle indicated by a solid black line.
Fig. 4.2.
Truncation error for the diffusion equation at the time value of 0.4.
| (4.1) |
and the infinity norm is defined as the maximum value over the domain. The convergence rate r is calculated as
| (4.2) |
where e1 and e2 are errors computed in norms with grid spacing Δx1 and Δx2. The data suggests the method is second order accurate.
For our next example, we consider a two species system of advection-reaction-diffusion equations.. A protein C can exist in two distinct chemical states: active and inactive. The reactions that convert the protein between the two states are assumed to follow Michaelis-Menten kinetics, which describes the kinetics of many enzymatic reactions including phosphorylation and dephosphorylation events [18]. The protein C is deactivated in the interior of the computational domain. The reaction-diffusion terms are the same as a model from [43]. Chemical species advect with constant velocity U⃗ = (0.1, 0.1). The interior equations are
| (4.3) |
where Ci and Ca are the concentrations of inactive and active protein, respectively, k2 is the maximum deactivation rate, and Km2 is the Michaelis constant. Activation occurs on the boundary, Γ(t), according to the following boundary conditions:
| (4.4) |
where k1 is the maximum activation rate and Km1 is the Michaelis constant. The equations are solved in the domain
| (4.5) |
shifted to the center of the unit box. The initial concentration of inactive protein is assumed to be constant and equal to 1. There is initially no active protein. Fig. 4.3 shows time values from a simulation. Table 4.1 lists the constants used to generate the figure and convergence data. The constants were arbitrarily chosen to generate a gradient. The convergence data was generated as in the previous example. The moving boundary solution was subtracted from the fixed boundary solution to the reaction-diffusion equation. A log-log plot of the truncation error with power fits is given in Fig. 4.4. The data suggests the order of the method is reduced to first order. There are several sources of error to consider that were not encountered with the previous example. First, the boundary extension in the method uses first order interpolation. In [2], second order accuracy is shown. However, the boundary extension in our method is recalculated after every time step, which is not the case in [2]. Also, values on the boundary lie on a piecewise linear approximation to the true boundary. Boundary values in [2] lie on the boundary given by the zero level set. Another source of error is the centroid approximation. In our method, bicubic interpolation gives the values to initialize cut cells for the reaction-diffusion solver. Initialization with centroid values is already an approximation to the integral of the function over the control volume. Higher order embedded boundary methods are suggested in [25]. More accurate flux construction and cut cell initialization may be needed to increase the convergence rate to second order.
Fig. 4.3.
Time values from the computed solution of nonlinear advection-reaction-diffusion equations solved on a moving boundary. The grid size is 200 × 200. The initial boundary is indicated by a solid black line.
Table 4.1.
Constants for the two species model.
| Constant | Value |
|---|---|
| D | 0.2 |
| S | 1.0 |
| k1 | 1.0 |
| k2 | 1.0 |
| Km1 | 0.2 |
| km2 | 0.2 |
Fig. 4.4.
Truncation error for nonlinear advection-reaction-diffusion equations at the time value of 0.4.
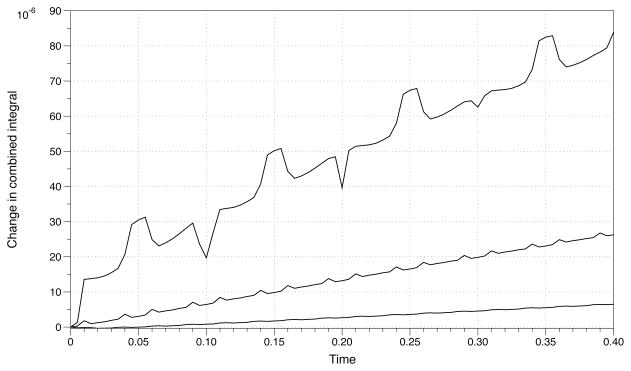
Next we consider the change in total concentration over time for the system given by Eqs. (4.3) and (4.4). When numerically solving the system in a fixed boundary, the total concentration for the system is conserved to machine precision. This is not the case for the moving boundary problem. Fig. 4.5 shows the integral sampled over time subtracted from the integral of the initial condition. The change in area converges to the initial value with second order accuracy.
Fig. 4.5.
Numerical integral of Ci(x, y, t) + Ca(x, y, t) subtracted from the initial value. The top plot is for a grid size of 100 × 100 followed by 200 × 200 and 400 × 400 on the bottom.
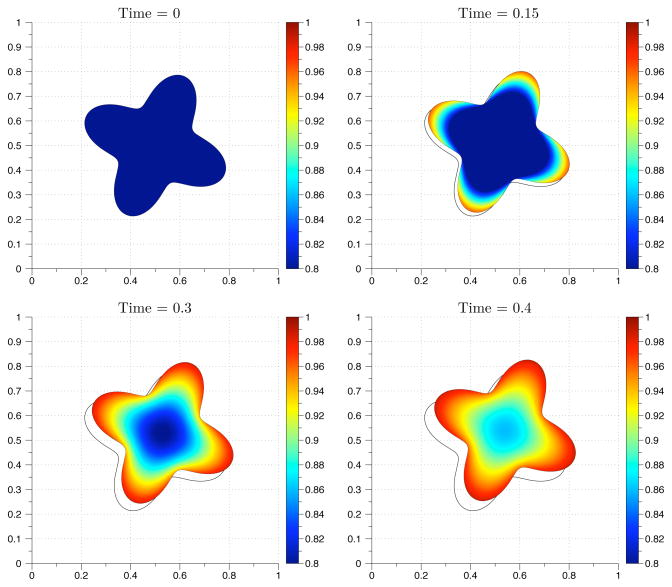
To demonstrate the method on a boundary propagating with non-constant velocity, we simulated the model in Eqs.(4.3) and (4.4) propagating with the velocity field
| (4.6) |
Fig. 4.6 shows the computed solution at several time values. For this example the error is defined as the difference between successive grid refinements as in [43]. The truncation error function E(x, y, t) is defined on interior values of the coarser grid. Computed solution values located in coarse grid cut cells are excluded from the domain. This includes some values located in interior points for the more refined grid. The truncation error function is defined as
Fig. 4.6.
Time values from the computed solution of nonlinear advection-reaction-diffusion equations solved on a moving boundary. The initial boundary is a circle indicated by a solid black line. The grid size is 200 × 200.
| (4.7) |
The coarse grid values are located in the center of a box defined by four refined grid values. Four refined grid values are averaged and subtracted from one coarse value. Table 4.2 lists convergence data for species Ci. The data are the same for Ca. The results are similar to the constant velocity convergence data for the same system. We conclude that complicated boundary dynamics lower the convergence rate of the method to first order.
Table 4.2.
The norms and convergence rates for the two species model advecting with non-constant velocity at the time value of 0.4.
| Species Ci | |||||||
|---|---|---|---|---|---|---|---|
| Grid size | Time step | L2 norm | r | L1 norm | r | L∞ norm | r |
| 50 × 50 | 5.000e-03 | – | – | – | – | – | – |
| 100 × 100 | 2.500e-03 | 2.79e-03 | – | 3.05e-04 | – | 3.51e-03 | – |
| 200 × 200 | 1.250e-03 | 9.53e-04 | 1.55 | 1.10e-04 | 1.47 | 1.28e-03 | 1.45 |
| 400 × 400 | 6.250e-04 | 4.21e-04 | 1.18 | 5.00e-05 | 1.14 | 5.65e-04 | 1.18 |
5. Substrate depletion model
Generating robust spatial patterns is important for many problems in developmental biology, and occurs in many biological systems. Pattern formation can be established through local activation and global inhibition of reacting chemical species. Turing originally proposed the idea that symmetry breaking can occur via a diffusion driven instability, leading to spatial patterns of interacting chemical species [44]. Turing instabilities have been proposed as a mechanism to explain pattern formation in many systems including morphogenesis in Drosophila [7], animal coat markings [31], and the rapid polarization of proteins involved in the yeast mating response pathway [13]. It is well known that domain size is a bifurcation parameter in Turing systems [5]. Geometry also contributes to pattern formation [7, 31]. In this section we explore the effects of a deforming geometry on pattern formation for a model system.
In the model system from [16], a Turing instability is caused by a slow diffusing protein locally activated through positive feedback. This protein depletes the fast diffusing substrate [11]. We model a signaling protein that exists in two forms: a membrane bound active guanosine triphosphate (GTP)-bound form and a cytosolic, inactive GDP-bound form. Let [Ri] and [Ra] denote the inactive and active concentrations of the protein. This protein’s active form diffuses more slowly than the cytosolic inactive form [45]. We assume a top down view of a three dimensional cell as in [29, 10] where membrane bound GTP-forms are modeled with smaller diffusion coefficient.
The substrate depletion model is given by the following equations,
| (5.1) |
| (5.2) |
The boundary conditions are no flux for both chemical species.
First, we allow the system to reach steady state on an initial geometry, then advect the system with a nonzero velocity field. For the first 200 time units, the simulation is run with the velocity U⃗ = 0. The initial domain is a circle centered at the point (0.5, 0.5) with radius r = 0.2. The initial conditions are
| (5.3) |
The Gaussian term in the initial concentration of [Ri] represents small perturbations to the spatially homogenous initial condition. Table 5.1 lists the values of constants used in the model simulation. The steady state solution to the substrate depletion model on a circlular domain is spatially homogeneous in spite of the initial perturbation and is given by
Table 5.1.
Values of constants in the first substrate depletion model simulation.
| Constant | Value | ||
|---|---|---|---|
|
| |||
| D1 | 5.00 | ||
| D2 | 0.05 | ||
| d0 | 0.03 | ||
| k0 | 0.10 | ||
| k2 | 3.00 | ||
| k2p | 7.00 | ||
| k2r | 4.00 | ||
| km1 | 1.65 | ||
| γ | 1.2 | ||
| (5.4) |
We conclude that no diffusion driven Turing instability forms for the circular geometry with the specified parameters. To investigate the effects of geometry on the stability of Eqs. (5.1) and (5.2), we simulated the equations with the velocity field
| (5.5) |
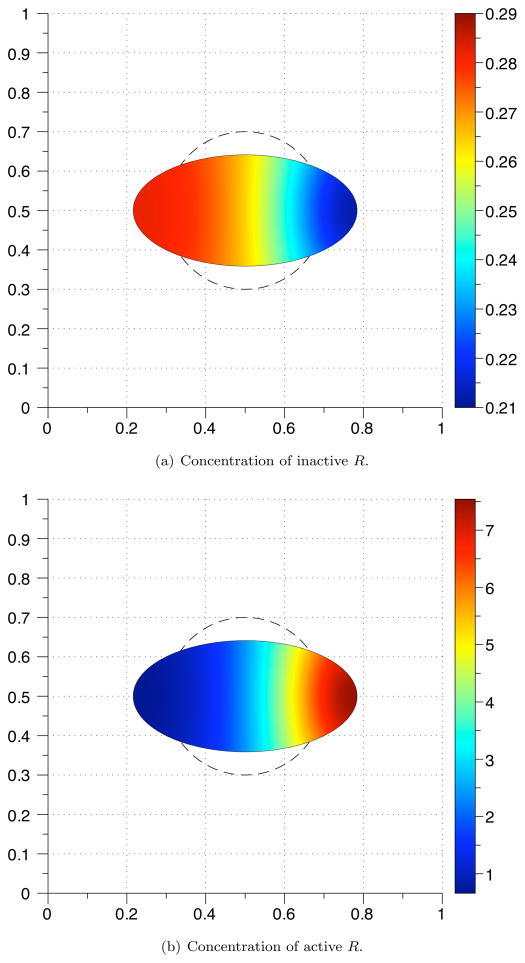
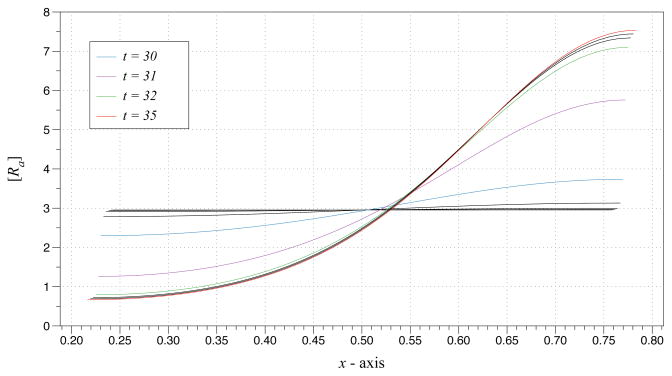
with initial concentrations and cellular geometry from the steady state solution Eq. (5.4). As the boundary deforms, an instability forms in an area of high curvature (Figs. 5.1(a) and 5.1(b)). Fig. 5.2 shows the active concentration through the center of the horizontal domain at time values near the formation of the instability. Even though the area of the domain is unchanged, the arc length increases. This change drives the system into forming a Turing instability. To explain this behavior, stability analysis of the system formed by Eqs. (5.1) and (5.2) is provided in Appendix A.
Fig. 5.1.
Concentration of R at t = 35. The initial geometry is indicated by a dashed line. The grid size used was 100 × 100.
Fig. 5.2.
Active R mesh slice through the line y = 0.5 for t = 25 until 35. Several time values are color-labeled.
Next, we consider the case with two initial perturbations,
| (5.6) |
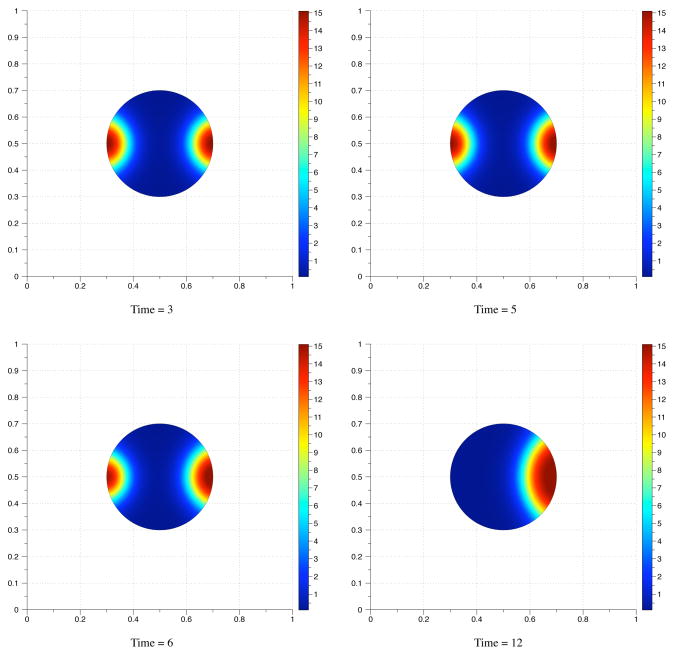
When the system is simulated using parameter values given in Table 5.2 on a stationary circular domain, peaks of activation initially form on both sides of the domain. However, the right peak exists transiently and eventually the cell is polarized toward the left side (Fig. 5.3). If the domain is changed to an stationary ellipse, the steady state profile has two peaks (Fig. 5.4, upper left panel). To investigate the stability of the two peak solution in a dynamically changing geometry, we enforce an oscillatory boundary deformation. Using an ellipse as an initial geometry, we allow the chemical species to form a stable polarized concentration profile at t = 15. The species are then advected with the velocity field,
Table 5.2.
Values of constants in the second substrate depletion model simulation.
| Constant | Value | ||
|---|---|---|---|
|
| |||
| D1 | 5.00 | ||
| D2 | 0.05 | ||
| d0 | 0.03 | ||
| k0 | 0.10 | ||
| k2 | 3.00 | ||
| k2p | 7.00 | ||
| k2r | 4.00 | ||
| km1 | 1.88 | ||
| γ | 17 | ||
Fig. 5.3.
Time values for [Ra] in the substrate depletion model with two initial perturbations and U⃗ = 0. The grid size used was 150 × 150.
Fig. 5.4.
Time values for [Ra] in the substrate depletion model with two initial perturbations. The boundary oscillates with a period of 5 seconds. The initial ellipsoid and circular geometries are indicated with a solid line. The grid size used was 100 × 100
| (5.7) |
The sign switches when the ellipse achieves a circular configuration. The period of the oscillation is one second. Ten periods of the simulation are shown in Movie S1. The peak on the right side of the geometry begins to vanish at the simulation time t = 25. When the period was reduced by a factor of five seconds, the same concentration profile was observed, which leads to a stable single peak profile (Fig. 5.4 and Movie S2). For these simulations, the signed distance function was reset at t = 20 for the fast oscillating boundary and t = 30 for the slower simulation. The numerical simulations suggest that for a dynamically changing geometry, the single peak solution is the only stable one, independent of the frequency.
6. Rho family GTPase model
In this section, we model a crawling fibroblast to investigate the role of cell morphology and speed of migration on signaling proteins. We use the same model from [43] with six species: inactive and active forms of Cdc42, Rac, and Rho. Cdc42 is the master regulator of cell polarity that triggers downstream effectors leading to the polarization of Rac and Rho. The active form of these proteins leads to actin polymerization and cytoskeletal reorganization. Rac generates protrusive forces, while Cdc42 generates filopodia. Rho activity is associated with the formation of stress fibers, focal adhesions, and myosin-based contractility [3, 8].
For simplicity, we concentrate on the basic hypothesized biochemical interactions proposed in [8] with a schematic of interactions illustrated in Fig. 6.1. In the model, an extracellular signal such as platelet-derived growth factor (PDGF) leads to activation of Cdc42 on the cell edge [15]. The active form of Cdc42 activates Rac. In turn, Rac activates Rho. Active Rho deactivates Rac. The active forms of Rac, Rho, and Cdc42 are deactivated in in the cell interior. Positive feedback increases the concentration of active Cdc42 and Rac species. The cell migrates with a velocity field the stretches the cell in the y direction, with compression and translation of the cell in the positive x direction,
Fig. 6.1.

Schematic of interactions
| (6.1) |
The velocity field is consistent with the movies of migrating fibroblasts from [36].
The model equations for the system are given by Eqs. (6.2) – (6.5). Activation of Cdc42 on the cell edge is modeled by the boundary condition,
| (6.2) |
The deactivation of active Cdc42 and the positive feedback loop that increases the activation of Cdc42 are included in the equations for the cell interior,
| (6.3) |
Rac is activated by Cdc42, and a positive feedback loop increases the concentration of active Rac. Active Rho increases the deactivation of Rac in the cytosol, modeled by
| (6.4) |
Rho is activated by the active form of Rac and deactivated in the interior,
| (6.5) |
The boundary conditions for Rac and Rho species are no flux.
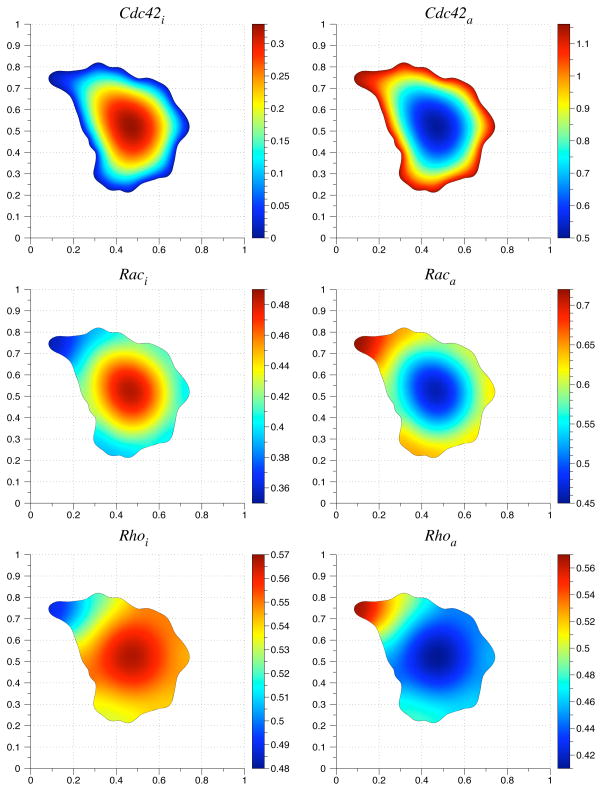
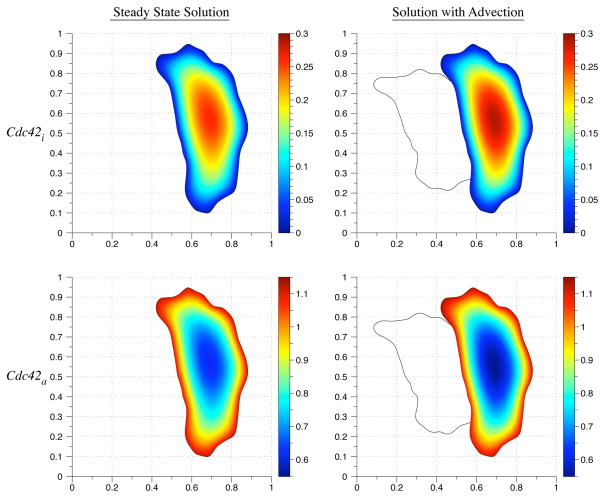
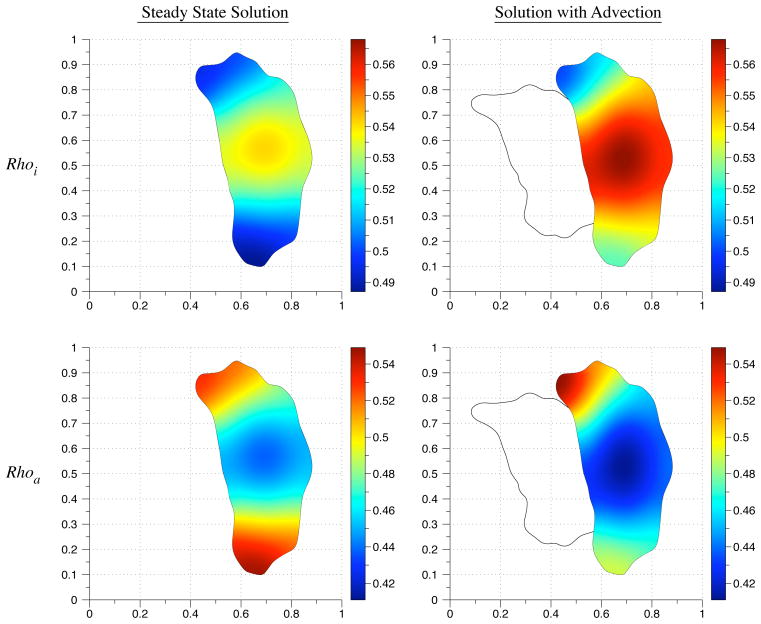
In the simulation, the initial conditions are 0 for the active species Cdc42a, Raca, and Rhoa. The initial condition for the inactive species Cdc42i, Raci, and Rhoi is 1. We simulate polarization in response to an extracellular signal before migration by simulating the reaction-diffusion equation until a stable gradient forms (Fig. 6.2). Then we simulate migration by including an advective term with the velocity field from Eq. (6.1). The constants used in the simulation are listed in Table 6.1. The diffusion coefficient used for inactive species was 0.1. The diffusion coefficient for the active species was 0.05. The initial geometry is based on live cell images of a migrating fibroblast from [36]. Figs. 6.3 – 6.5 show the concentration profiles after advecting for 150 time steps. The reaction-diffusion equations were solved from simulation time t = 0 until t = 3.25. The advection-reaction-diffusion equation was simulated from t = 3.25 until t = 3.5. In general, the gradient in the concentration profiles obtained by solving the advection-reaction-diffusion equation is steeper than the steady state concentration profiles. The maximum values of the active forms of Rac and Rho are located where the initial protrusion was located whereas the maximum is located at the bottom of the cell in the steady state concentration profiles (Figs. 6.4 and 6.5). This suggests that migration speed can play a role in enhancing a transient signal from a thin protrusion with high phosphorylation levels.
Fig. 6.2.
Initial condition for the advection-reaction-diffusion equation. The grid size used was 150. The time step was set to one-fourth of the spatial step size.
Table 6.1.
Reaction constants used in the simulation of the Rho GTPase model.
| Parameter | Value |
|---|---|
| S | 1.0 |
| k1 | 5.0 |
| k2 | 3.0 |
| k3 | 1.0 |
| k4 | 3.0 |
| k5 | 3.0 |
| k6 | 5.0 |
| k7 | 1.0 |
| k8 | 3.0 |
| k9 | 5.0 |
| Km1 | 0.2 |
| km2 | 0.2 |
| Km7 | 0.2 |
| Km8 | 0.2 |
| km9 | 0.2 |
| km10 | 0.2 |
| Km3 | 0.2 |
| Km4 | 0.2 |
| km5 | 0.2 |
| km6 | 0.2 |
| Km11 | 0.2 |
| Km12 | 0.2 |
| km13 | 0.2 |
| k14 | 0.2 |
Fig. 6.3.
A comparison of the steady state Cdc42 concentration values with the computed solution to the advection-reaction-diffusion equations. The solid line indicates the initial cell geometry.
Fig. 6.5.
A comparison of the steady state Rho concentration values with the computed solution to the advection-reaction-diffusion equations. The solid line indicates the initial cell geometry.
Fig. 6.4.
A comparison of the steady state Rac concentration values with the computed solution to the advection-reaction-diffusion equations. The solid line indicates the initial cell geometry.
7. Conclusions
We have presented a novel numerical method to simulate systems of advection-reaction-diffusion equations in complex time-dependent geometries. Because the advection operator is split from the reaction and diffusion operators, it is straightforward to extend the method to the case where concentration on the cell-membrane affects the velocity field. For example, an extension velocity can be constructed to advect the boundary [1]. In this case, the challenge then becomes a modeling one. A model is needed to couple internal mechanisms to force generation. The examples presented here have used divergence-free velocity fields, but the method is not limited to a specific type of velocity field. Although the method is only approximately numerically conservative, it matches the conservation properties of level set methods which scale with second order accuracy. Because the methods presented here are based on a Cartesian grid, they can be extended to three-dimensions. The numerical accuracy of the method is overall first order. For some problems, such as the advection-diffusion equation in section 4, second order accuracy can be achieved.
Recent work suggests that higher order methods can be developed for embedded boundary methods through implicit function representation [25]. Taylor series approximations of boundary fluxes can be computed from moments. These ideas could be incorporated to increase the accuracy of the finite volume method. Numerical schemes for hyperbolic conservation laws from [9, 30] can be used to advect concentration values instead of the scheme described here. This would allow for numerical conservation of chemical species.
In the examples presented here, our main goal was to observe morphological effects on biochemical protein concentrations. Cell motility is a complex biophysical process. A realistic mathematical model must take into account the mechanochemical events leading to cell protrusion, extension, and retraction. Our goal here is to present starting point to numerically simulate two and three dimensional models of cell motility and signaling. In the future, the methods presented here will be coupled with a mechanical model driving the boundary deformation.
Acknowledgments
This work was supported by NIH grants R01-GM079271 and R01-GM078994.
Appendix A. Stability analysis of the substrate depletion model
In this appendix, we analyze the linear stability of the system formed by Eqs. (5.1) and (5.2). Specifically, we investigate the role of geometry in the analysis. For simplicity, we denote u as the activator and v as the inhibitor with D2 > 1. The equations of the substrate depletion model are rewritten as
| (A.1) |
| (A.2) |
where reaction terms for each species are given by,
| (A.3) |
The boundary conditions are no flux for both chemical species.
Given the spatially homogeneous steady state solution system, (u0, v0), let
| (A.4) |
Then the linearized reaction-diffusion system can be written as
| (A.5) |
where
| (A.6) |
d = D2/D1, γ̃ = γ/D1, and
| (A.7) |
Let W(x, y) be the solution of the spatial eigenvalue problem
| (A.8) |
with boundary conditions n⃗ · ∇W|∂Ω = 0. To obtain an explicit formula for the eigenvalues, we consider the rectangular domain defined by the lower point (0, 0) and upper point (a, b). Then solutions that satisfy the boundary conditions have the form
| (A.9) |
where n, m are integers. If we define the eigenvalue or wavenumber, k, as
| (A.10) |
then Eq. (A.8) is satisfied. Denoting Wk(x, y) as the eigenfunction corresponding the the wavenumber k, solutions to the linearized problem Eq. (A.5) have the form
| (A.11) |
Substituting the above equation into Eq. (A.5), we obtain
| (A.12) |
for each wavenumber k. The characteristic equation for the system is
| (A.13) |
Then Eq. A.13 becomes
| (A.14) |
where
| (A.15) |
Because the spatially homogenous steady state solution is stable,
| (A.16) |
To obtain an instability with regard to spatial perturbations, we require that
| (A.17) |
This condition occurs if the coefficient in front of λ is less than zero or if h(k2) < 0. The condition (A.16) requires that (fu+gv) < 0. The term k2(1+d) is always positive for nonzero k, and we have
| (A.18) |
Hence, the only way to satisfy the condition (A.17) is to have h(k2) < 0.
Let us consider the system given by Eqs. (A.1) and (A.2), with constants listed in Table A.1. The spatially homogeneous steady state solution is given by
Table A.1.
Values of constants for the substrate depletion model.
| Constant | Value | ||
|---|---|---|---|
|
| |||
| D1 | 0.05 | ||
| D2 | 5.00 | ||
| d0 | 0.03 | ||
| k0 | 0.10 | ||
| k2 | 3.00 | ||
| k2p | 7.00 | ||
| k2r | 4.00 | ||
| km1 | 1.65 | ||
| γ | 0.5 | ||
| (A.19) |
The entries of the Jacobian matrix A are given by
| (A.20) |
Using the steady state values and parameters from Table 5.1, we have
| (A.21) |
and det(A) = 0.664889. The polynomial Eq. (A.15) is given by
| (A.22) |
and shown in Fig. A.1. The roots of h(k2) are k2 = 0.020, 33.93, or k = ±0.140, ±5.83.
Fig. A.1.
Plot of h(k2). The dashed line is k = 0. An instability will form for wavenumbers such that h(k2) is negative.
The question is whether there are wavenumbers for which h(k2) is negative. On a rectangular domain, the wavenumbers are given by Eq. (A.10). For a square with length equal to 0.4, the smallest wavenumber (in absolute value) is k ≈ 7.85. We simulated the system on a square domain centered in the unit box with length 0.4. The initial conditions were,
| (A.23) |
As expected, no Turing instability develops during the simulation. For a rectangular domain with the same area with length equal to 0.2 and width equal to 0.8, the smallest wavenumber (in absolute value) is k ≈ 3.93. The system was simulated with the initial conditions
| (A.24) |
Fig. A.2(a) illustrates the initial condition for u. The Turing instability is shown in Fig. A.2(b). Given a fixed area
 , the following equations determine the values for a and b that satisfy h(k2) = 0,
Fig. A.2.
Turing instability in a rectangular geometry.
| (A.25) |
where a > b, and ω is the largest positive root of h(k2). The notation k(n,m)(a, b) indicates the integers n and m are fixed, and k(n=1,m=0)(a, b) is a function of a and b.
The results of this analysis extend to a circular domain. Geometry plays an important role in the stability of the system. Changing geometries over time will affect the stability of the system by potentially selecting unstable wave modes.
Contributor Information
WANDA STRYCHALSKI, Email: wandastr@email.unc.edu.
DAVID ADALSTEINSSON, Email: david@unc.edu.
TIMOTHY C. ELSTON, Email: telston@med.unc.edu.
References
- 1.Adalsteinsson D, Sethian JA. The fast construction of extension velocities in level set methods. J Comput Phys. 1999;148:2–22. [Google Scholar]
- 2.Adalsteinsson D, Sethian JA. Transport and diffusion of material quantities on propagating interfaces via level set methods. J Comp Phys. 2003;185:271–288. [Google Scholar]
- 3.Alberts B, Johnson A, Lewis J, Raff M, Roberts K, Walter P. Molecular Biology of the Cell. 4. Garland Science; 2002. [Google Scholar]
- 4.Brenan KE, Campbell SL, Petzold LR. Society for Industrial and Applied Mathematics. 2. 1996. Numerical Solution of Initial-Value Problems in Differential-Algebraic Equations. [Google Scholar]
- 5.Britton NF. Essential mathematical biology. Springer; London: 2003. [Google Scholar]
- 6.Brown PN, Hindmarsh AC, Petzold LR. Using Krylov methods in the solution of large-scale differential-algebraic systems. SIAM J Sci Comput. 1994;15:1467–1488. [Google Scholar]
- 7.Bunow B, Kernevez JP, Joly G, Thomas D. Pattern formation by reaction-diffusion instabilities: application to morphogenesis in Drosophila. J Theor Biol. 1980;84:629–649. doi: 10.1016/s0022-5193(80)80024-5. [DOI] [PubMed] [Google Scholar]
- 8.Burridge K, Wennerberg K. Rac and Rho take center stage. Cell. 2004;116:167–179. doi: 10.1016/s0092-8674(04)00003-0. [DOI] [PubMed] [Google Scholar]
- 9.Colella P, Graves DT, Keen BJ, Modiano D. A Cartesian grid embedded boundary method for hyperbolic conservation laws. J Comput Phys. 2006;211:347–366. [Google Scholar]
- 10.Dawes AT, Edelstein-Keshet L. Phosphoinositides and Rho proteins spatially regulate actin polymerization to initiate and maintain directed movement in a one-dimensional model of a motile cell. Biophys J. 2007;92:744–768. doi: 10.1529/biophysj.106.090514. [DOI] [PMC free article] [PubMed] [Google Scholar]
- 11.Gierer A, Meinhardt H. Theory of biological pattern formation. Kybernetik. 1972;12:30–39. doi: 10.1007/BF00289234. [DOI] [PubMed] [Google Scholar]
- 12.Glazier JA, Graner F. Simulation of the differential adhesion driven rearrangement of biological cells. Phys Rev E. 1993;47:2128–2154. doi: 10.1103/physreve.47.2128. [DOI] [PubMed] [Google Scholar]
- 13.Goryachev AB, Pokhilko AV. Dynamics of Cdc42 network embodies a Turing-type mechanism of yeast cell polarity. FEBS Lett. 2008;582:1437–1443. doi: 10.1016/j.febslet.2008.03.029. [DOI] [PubMed] [Google Scholar]
- 14.Harten A, Engquist B, Osher S, Chakravarthy SR. Uniformly high order accurate essentially non-oscillatory schemes, 111. J Comput Phys. 1987;71:231–303. [Google Scholar]
- 15.Jimenez C, Portela RA, Mellado M, Rodriguez-Frade JM, Collard J, Serrano A, Martinez-A C, Avila J, Carrera AC. Role of the PI3K regulatory subunit in the control of actin organization and cell migration. J Cell Biol. 2000;151:249–262. doi: 10.1083/jcb.151.2.249. [DOI] [PMC free article] [PubMed] [Google Scholar]
- 16.Jin M, Behar M, Nayak S, Mather W, Hasty J, Errede B, Dohlman HG, Elston TC. Computational modeling and experimental analysis reveal Bar1’s role in yeast chemotrophic growth. 2009 In preparation. [Google Scholar]
- 17.Johansen H, Colella P. A Cartesian grid embedded boundary method for Poisson’s equation on irregular Domains. J Comput Phys. 1998;147:60–85. [Google Scholar]
- 18.Kholodenko BN, Brown GC, Hoek JB. Diffusion control of protein phosphorylation in signal transduction pathways. Biochem J. 2000;350:901–907. [PMC free article] [PubMed] [Google Scholar]
- 19.Kholodenko BN. Cell-signalling dynamics in time and space. Nat Rev Mol Cell Biol. 2006;7:165–176. doi: 10.1038/nrm1838. [DOI] [PMC free article] [PubMed] [Google Scholar]
- 20.Kraynov VS, Chamberlain C, Bokoch GM, Schwartz MA, Slabaugh S, Hahn KM. Localized Rac activation dynamics visualized in living cells. Science. 2000;290:333–337. doi: 10.1126/science.290.5490.333. [DOI] [PubMed] [Google Scholar]
- 21.Lawson C, Wolf S. ICAM-1 signaling in endothelial cells. Pharmacol Rep. 2009;61:22–32. doi: 10.1016/s1734-1140(09)70004-0. [DOI] [PubMed] [Google Scholar]
- 22.Lehninger AL, Nelson DL, Cox MM. Lehninger principles of biochemistry. 4. W. H. Freeman; New York: 2005. [Google Scholar]
- 23.Levine H, Kessler DA, Rappel WJ. Directional sensing in eukaryotic chemotaxis: A balanced inactivation model. PNAS. 2006;103:9761–9766. doi: 10.1073/pnas.0601302103. [DOI] [PMC free article] [PubMed] [Google Scholar]
- 24.Li M, Zhou Y, Feng G, Su SB. The critical role of toll-like receptor signaling pathways in the induction and progression of autoimmune diseases. Curr Mol Med. 2009;9:365–374. doi: 10.2174/156652409787847137. [DOI] [PubMed] [Google Scholar]
- 25.Ligocki TJ, Schwartz PO, Percelay J, Colella P. Embedded boundary grid generation using the divergence theorem, implicit functions, and constructive solid geometry. J Phys Conf Ser. 2008;125 012080(5pp) [Google Scholar]
- 26.Malladi R, Sethian JA, Vemuri BC. A fast level set based algorithm for topology independent shape modeling. J Math Imaging Vis. 1996;6:269–290. [Google Scholar]
- 27.Marée A, Jilkine A, Dawes A, Grieneisen VA, Edelstein-Keshet L. Polarization and movement of keratocytes: A multiscale modelling approach. Bull Math Biol. 2006;68:1169–1211. doi: 10.1007/s11538-006-9131-7. [DOI] [PubMed] [Google Scholar]
- 28.Metropolis N, Rosenbluth AE, Rosenbluth MN, Teller AH, Teller E. Equation of state calculations by fast computing machines. J Chem Phys. 1953;21:1087–1092. [Google Scholar]
- 29.Meyers J, Craig J, Odde DJ. Potential for Control of Signaling Pathways via Cell Size and Shape. Curr Biol. 2006;16:1685–1693. doi: 10.1016/j.cub.2006.07.056. [DOI] [PubMed] [Google Scholar]
- 30.Modiano D, Colella P. A higher-order embedded boundary method for time-dependent simulation of hyperbolic conservation law. ASME 2000 Fluids Engineering Division Summer Meeting; 2000. pp. 1–17. [Google Scholar]
- 31.Murray JD. Mathematical biology II: Spatial models and biochemical applications. 3. Vol. 2. Springer; New York: 2003. [Google Scholar]
- 32.Nalbant P, Hodgson L, Kraynov V, Toutchkine A, Hahn KM. Activation of endogenous Cdc42 visualized in living cells. Science. 2004;305:1615–1619. doi: 10.1126/science.1100367. [DOI] [PubMed] [Google Scholar]
- 33.Neves SR, Tsokas P, Sarkar A, Grace EA, Rangamani P, Taubenfeld SM, Alberini CM, Schaff JC, Slizter RD, Moraru II, Iyengar R. Cell shape and negative links in regulatory motifs together control spatial information flow in signaling networks. Cell. 2008;133:666–680. doi: 10.1016/j.cell.2008.04.025. [DOI] [PMC free article] [PubMed] [Google Scholar]
- 34.Osher S, Fedkiw RP. Applied mathematical sciences. Vol. 153. Springer; New York: 2003. Level set methods and dynamic implicit surfaces. [Google Scholar]
- 35.Osher S, Sethian JA. Fronts propagating with curvature-dependent speed: algorithms based on Hamilton-Jacobi formulation. J Comput Phys. 1988;79:12–49. [Google Scholar]
- 36.Pertz O, Hodgson L, Klemke R, Hahn K. Spatiotemporal dynamics of RhoA activity in migrating cells. Nature. 2006;440:1069–1072. doi: 10.1038/nature04665. [DOI] [PubMed] [Google Scholar]
- 37.Rubinstein B, Jacobson K, Mogilner A. Multiscale two-dimensional modeling of a motile simple-shaped cell. Multiscale Model Simul. 2005;3:413–439. doi: 10.1137/04060370X. [DOI] [PMC free article] [PubMed] [Google Scholar]
- 38.Saad Y. SPARSKIT: A basic tool-kit for sparse matrix computations (Version 2) 2005 Mar; http://www-users.cs.umn.edu/~saad/software/SPARSKIT/sparskit.html.
- 39.Saad Y, Schultz MH. GMRES: A generalized minimal residual algorithm for solving nonsymmetric linear-systems. SIAM J Sci Stat Comp. 1986;7:856–869. [Google Scholar]
- 40.Schaff JC, Slepchenko BM, Choi Y, Wagner J, Resasco D, Loew L. Analysis of nonlinear dynamics on arbitrary geometries with the Virtual Cell. Chaos. 2001;11:115–131. doi: 10.1063/1.1350404. [DOI] [PubMed] [Google Scholar]
- 41.Schneider IC, Parrish EM, Haugh JM. Spatial analysis of 3′ phosphoinositide signaling in living fibroblasts, III: influence of cell morphology and morphological polarity. Biophys J. 2005;89:1420–1430. doi: 10.1529/biophysj.105.061218. [DOI] [PMC free article] [PubMed] [Google Scholar]
- 42.Sethian JA. Level set methods and fast marching methods: Evolving interfaces in computational geometry, fluid mechanics, computer vision, and materials science. 2. Cambridge University Press; Jun, 1999. [Google Scholar]
- 43.Strychalski W, Adalsteinsson D, Elston TC. A cut cell method for simulating spatial models of biochemical reaction networks in arbitrary geometries. Commun Appl Math Comp Sci. 2010;1:31–53. doi: 10.2140/camcos.2010.5.31. [DOI] [PMC free article] [PubMed] [Google Scholar]
- 44.Turing A. The chemical basis of morphogenesis. Phylosphical Transactions of the Royal Society. 1952;237:37–72. [Google Scholar]
- 45.Valdez-Taubas J, Pelham HRB. Slow diffusion of proteins in the yeast plasma membrane allows polarity to be maintained by endocytic cycling. Curr Biol. 2003;13:1636–1640. doi: 10.1016/j.cub.2003.09.001. [DOI] [PubMed] [Google Scholar]
- 46.Zienkiewicz OC, Taylor RL. The Finite Element Method: Its Basis and Fundamentals. 6. Elsevier/Butterworth-Heinemann; 2005. [Google Scholar]


