Abstract
Quantitative measurement of collagen gel contraction plays a critical role in the field of tissue engineering because it provides spatial-temporal assessment (e.g., changes of gel area and diameter during the contraction process) reflecting the cell behaviors and tissue material properties. So far the assessment of collagen gels relies on manual segmentation, which is time-consuming and suffers from serious intra- and inter-observer variability. In this study, we propose an automatic method combining various image processing techniques to resolve these problems. The proposed method first detects the maximal feasible contraction range of circular references (e.g., culture dish) and avoids the interference of irrelevant objects in the given image. Then, a three-step color conversion strategy is applied to normalize and enhance the contrast between the gel and background. We subsequently introduce a deformable circular model (DCM) which utilizes regional intensity contrast and circular shape constraint to locate the gel boundary. An adaptive weighting scheme was employed to coordinate the model behavior, so that the proposed system can overcome variations of gel boundary appearances at different contraction stages. Two measurements of collagen gels (i.e., area and diameter) can readily be obtained based on the segmentation results. Experimental results, including 120 gel images for accuracy validation, showed high agreement between the proposed method and manual segmentation with an average dice similarity coefficient larger than 0.95. The results also demonstrated obvious improvement in gel contours obtained by the proposed method over two popular, generic segmentation methods.
Keywords: Color Conversion, Deformable Circular Model, Quantitative Measurement, Collagen Gel Contraction, Gel Segmentation
1. Introduction
Fibroblast-mediated collagen gels have been widely utilized to develop artificial tissues such as skin, blood vessel, and tendon, as well as to evaluate cell growth and tissue repair potential. Moreover, tracking the contraction process of collagen gels in controlled imaging conditions is important for deriving cell contractility (e.g., mechanical force) and investigating biological mechanisms of wound healing. How to efficiently and accurately quantify the gel contraction to facilitate understanding of cell properties and tissue wound healing has become a critical issue in the biomaterials and tissue engineering fields [1-8]. The aim of this paper is to design an efficient image analysis method for automatic segmentation of collagen gel boundaries and quantitative measurement of gel contraction from digital images.
To achieve this goal, three major difficulties in automatic segmentation and measurement of collagen gel must be properly resolved. It can be seen from figures 1(a)-1(c), illustrating three different contraction stages, the gel first contacts the dish perimeter (DP) and then gradually contracts radially inward toward the cloning ring perimeter (CRP). Gel boundaries at different contraction stages present a variety of intensities and shapes, which complicates automatic boundary detection. Moreover, the collagen gel boundaries are often fuzzy (indicated by yellow arrows in figure 1(b)), which makes accurately locating gel borders a challenge. Pixel coloration of the gel regions among images is inconsistent due to variations of imaging conditions and gel contraction properties. For example, the average color value of the gel in figure 1(a) is (R: 146, G: 132, B: 57) while that of the gel in figure 1(b) is (R: 148, G: 142, B: 104). Such differences usually lead to unreliable characterization of collagen gel colors and makes detection of the gel pixels by color values difficult.
Figure 1.

Illustrations of difficulties in automatic segmentation of collagen gels; (a)-(c) three examples acquired by a digital camera at different contraction stages, each accompanied to the right by a smaller image delineating the gel boundary. Rulers in the images are used scale the measurement results. Difficulty I: variations of intensity and shape appearances; Difficulty II: fuzzy boundaries; Difficulty III: color distribution inconsistency.
Image segmentation methods addressing issues associated with quantitative measurements of both biomedical and industrial applications have been actively investigated [9-12]. Although the importance of quantitative measurement of collagen gel contraction has been discussed in the aforementioned literature, to the best of our knowledge, little or no research has been performed addressing automatic analysis techniques applied to collagen gel images. Potential segmentation methods that may be applied to this problem fall into three categories: pixel classification-based, region-based, and deformable model-based methods. Each technique has merits and drawbacks when applied to this specific application. In general, pixel classification-based (e.g., Otsu’s thresholding [13]) and region-based (e.g., watershed [14]) methods mainly consider the intensity homogeneity in the segmentation process and, therefore, often suffer from the edge-leaking problem in the presence of fuzzy boundaries (i.e. difficulty II). Moreover, these same method categories are sensitive to the intensity/color inconsistency appearing in the images (i.e. difficulty III). Methods which are purely based on pixel classification or regions are likely to generate unsatisfactory segmentation results for gel image analysis.
As to the deformable model-based methods, the active contour model [15] and active shape model [16] are two typical approaches. The two methods achieve segmentation by deforming the model toward the accentuated edges of target objects. The model deformation not only utilizes the image-based features (e.g., intensity, gradient, or entropy), but also takes the model’s shape properties into account. Deformable model-based methods can avoid severe segmentation errors resulting from fuzzy boundaries. However, variations in gel intensities and shapes among the images (i.e. difficulties I and III) certainly complicate definition of a specific measure for attracting the model to fit the images with stability. Additionally, the initial position and shape of the deformable model are major concerns in this method category. Convergence to the true solution is very likely to fail if the distance between the target contours and the model is too large. In other words, there is no deformable model-based solution currently available to segment and measure gel contraction images.
In this paper, we propose a new computerized image analysis system guided by a deformable circular model (DCM) to automatically segment collagen gels and quantitatively measure gel contraction parameters from digital images. Major features of the proposed system are described below. We present a three-step strategy combining gel color transfer, intensity adjustment and contrast stretch to convert the collagen gel images from RGB to grayscale domain. Using the proposed strategy, the difficulty of color distribution inconsistency (difficulty III) can be successfully resolved. Moreover, the proposed deformation method, which not only utilizes the regional intensity contrast to attract the DCM but also adopts the circular shape constraint to avoid excessive distortion, can achieve accurate segmentation of collagen gels. Furthermore, a contraction stage-adaptive weighting scheme is designed to control the behavior of the DCM, so that our method can accommodate the variations of gel boundary appearances (difficulties I and II). Experimental results showed that using the proposed system can obtain accurate segmentation and measurement results in a fully-automated process.
2. Collagen gel fabrication and image acquisition
Cell-seeded gel lattices, which can be used to approximate biological structures of real tissues, are usually measured during the contraction process (e.g., tracking the rate of area change) to assess material properties [2, 4]. In this study Vitrogen sterile type I bovine dermal collagen (Cohesion Technologies, Palo Alto, CA) was prepared for investigating subsynovial connective tissue characteristics and its potential role in carpal tunnel syndrome. Briefly, the collagen solution was made from 10 ml of sterile, chilled Vitrogen collagen mixed with 3 ml of sterile 5X minimal essential medium (MEM), 1.05 ml of sterile 0.167 M NaOH, and 0.95 ml distilled water, to make 15 ml of temporary collagen/MEM solution on ice. The resulting concentrations of collagen and fetal bovine serum were 2.0 mg/ml and 10%, respectively, at a pH of 7.4 ± 0.2. The target cell-populated collagen gel solution (0.5 x 10⁶ cells/ml cell suspension in 1.0 mg/ml collagen/MEM solution) was prepared by mixing one volume of 2.0 mg/ml collagen solution with one volume of 1.0 x 10⁶ cells/ml 1X MEM suspension. Then, 2 ml aliquots of the cell-seeded collagen solution were added to each well of the six-well plates, wherein each well/dish has a cloning ring at its center with both a diameter and height of 8 mm. More details of the cell-seeded gel fabrication can be found in the work of Chen et al. (2007) [17].
Progression of gel contraction was captured at specific time points using a digital camera (Sony DSC-TX9) mounted at a consistent height of 55 mm above the plate. The imaging conditions were manually adjusted to assure the quality of acquired gel images (lighting sensitivity: ISO 125; shutter speed: 1/500 sec; aperture value: f/4.5; exposure value: 0). The surface images of the prepared gels were captured every 8 hours on days 1-6, 8, 10, 12, and 14. Rulers were included in photographs to scale measurements, and a transilluminator was used to stabilize lighting conditions (figure 2). At the end of the contraction period (the 14th day), all collagen gels had tightly contracted around the cloning rings. The acquired images recording the gel contraction process were stored for offline analysis.
Figure 2.
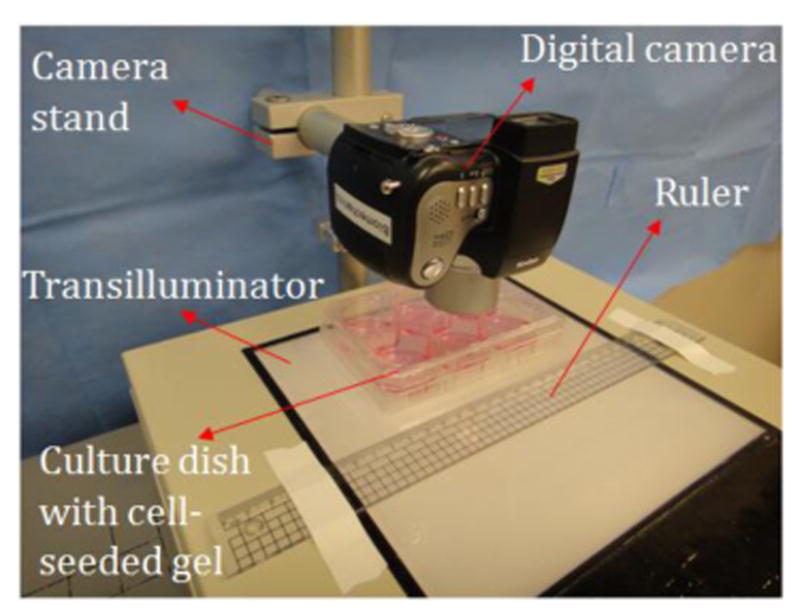
Configuration for imaging the collagen gel contraction.
3. Segmentation and measurement of gel contraction images
In order to accurately segment the collagen gel in each image, the proposed method incorporated a model-guided framework with image processing techniques addressing the aforementioned difficulties. As there are several irrelevant objects in each image which interfere with the segmentation, the first step of the proposed method was to find the maximal feasible contraction range via detection of circular references. Then, a three-step color conversion strategy was designed to convert the collagen gel images from RGB-channel to grey-level domain. We subsequently adapted the DCM based on the contraction stage-adaptive weighting scheme in order to segment the collagen gels. Lastly, quantitative measurements of collagen gels were then readily obtained based on the segmented results.
3.1. Detection of maximal feasible contraction region
To prevent interference from irrelevant objects during the segmentation process, the method first detected circular references (i.e., DP and CRP) which bounded the feasible region of gel contraction. The circular references in the proposed method were represented by the parametric curve C in a polar coordinate system (see figure 3(a)):
Figure 3.
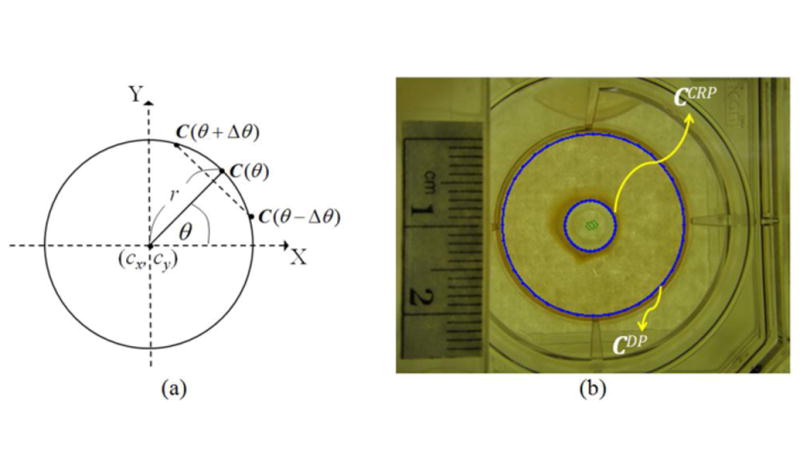
Detection of maximal feasible region of gel contraction; (a) circular reference parameterization; (b) detection results of the circular references.
| (1) |
where (cx, cy) represents the coordinate of center, r is the radius, and θ is an angle from a fixed direction of the circular reference.
It was observed that both the two circular references are located at the transition from bright to dark regions in a given image I. Therefore, we detected the two references by the argument of the minimum of the directed intensity gradient:
| (2) |
where IL is the illumination/intensity channel obtained by the average of red (IR), green (IG) and blue (IB) channels from the image I; Δθ is the angle offset determining the sampling density and N = 360 / Δθ is the number of sampled contour points on the curve C; n(C(θ)) which is the outer-pointing normal at C(θ) is defined as the vector from the center to C(θ). In our implementation, was assigned a value of 10, an initial guess for (cx, cy) was set as the center of the image, and the radii of DP and CRP were assigned as 91 and 25 pixels, respectively. The DP and CRP were detected via optimization of equation (2) from the two initial conditions, respectively. The detected DP and CRP are denoted as CDP and CCRP respectively, and the feasible region of gel contraction can be specified as the region enclosed by CDP and excluded from CCRP (see figure 3(b)).
3.2. Three-step strategy for image color conversion
Due to changes in imaging conditions throughout gel contraction stages, the images usually present inconsistent color distributions and low contrast, prone to making the segmentation process unstable. Therefore, we proposed a three-step color conversion strategy from RGB to grayscale images to address this issue. The proposed strategy consisted of gel color transfer, intensity adjustment, and contrast stretch steps. First, the color transfer was performed to cope with the color distribution inconsistency among the gel images [18]. A set of reference images presenting typical color distributions of collagen gels was selected by the scientist conducting the experiment (Tai-Hua Yang). The average means (μ) and standard deviations (σ) of color values for each axis in the lαβ color space were then computed from the reference images and denoted as respectively, to characterize the desired color distribution. The calculation for the reference distribution was performed only once for the method. Afterwards, for each individual image the means and standard deviations of pixel colors in the lαβ space were similarly calculated and denoted as . The reference color distribution was then transferred to each image by applying the following shifting and scaling operations to the l, α, and β values of each pixel:
| (3) |
where l’, α’, and β’ are the resulting color values of the pixel in the lαβ space. By mapping them back to the RGB space, we generated a color-transferred gel image and updated its intensity channel IL for segmentation purposes.
In the intensity adjustment step, we observed that the intensity-channel image provided the luminance information from the colored gel image, while the local contrast between the dish and gel regions mainly originated from the yellow color component (gel pixels contain heavier yellow). We hence adjusted the intensity appearance of the gel image via the yellow content weighting process:
| (4) |
After the adjustment we decreased the intensity of gel pixels while relatively enhancing that of dish pixels. The last step of intensity contrast stretching, which is adaptive to the average intensity of the input image, was carried out via the following equation:
| (5) |
The entire color conversion process was performed only for the cropped, rectangular image that completely encloses the detected DP to reduce computational cost. Figure 4 demonstrates two examples which originally show different colors (e.g., the top image has lower illumination and heavier yellow). It can be observed that the color distributions of both images become quite similar after the color transfer process, and the boundaries enclosing the gels are consistently enhanced after the color conversion.
Figure 4.
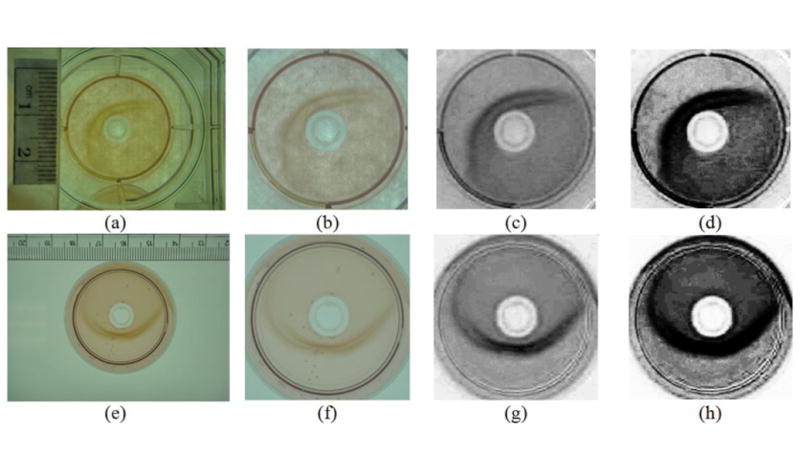
Three-step strategy for color-intensity conversion; (a)-(d) and (e)-(h) display two examples showing original image, gel color transfer, intensity adjustment, and contrast stretch results, respectively.
3.3. Gel segmentation using deformable circular model (DCM)
3.3.1. Model initialization
The DCM which is used to approximate the collagen gel contour was specified by the parametric curve D:
| (6) |
where dx and dy are the global position parameters, and s is the local shape parameter of the DCM. In figure 5, the contour of the DCM was sampled in the angle offset Δθ, and it thus contains N=360 / Δθ contour points. Its position was determined by dx and dy, and the shape was controlled by a set of shape parameters S = (s1, s2, …, si,…, sN-1, sN). If all the shape parameters are given the same value, the DCM forms a circle; otherwise, it constitutes an arbitrary shape via the change of shape parameters. With the two circular references (i.e., DP and CRP) delineating the feasible region of gel contraction, we could reasonably assign the detected DP as the initial contour of the DCM. The values of dx and dy were set as the coordinate of DP’s center, and each element of the shape vector S was assigned to the DP’s radius.
Figure 5.
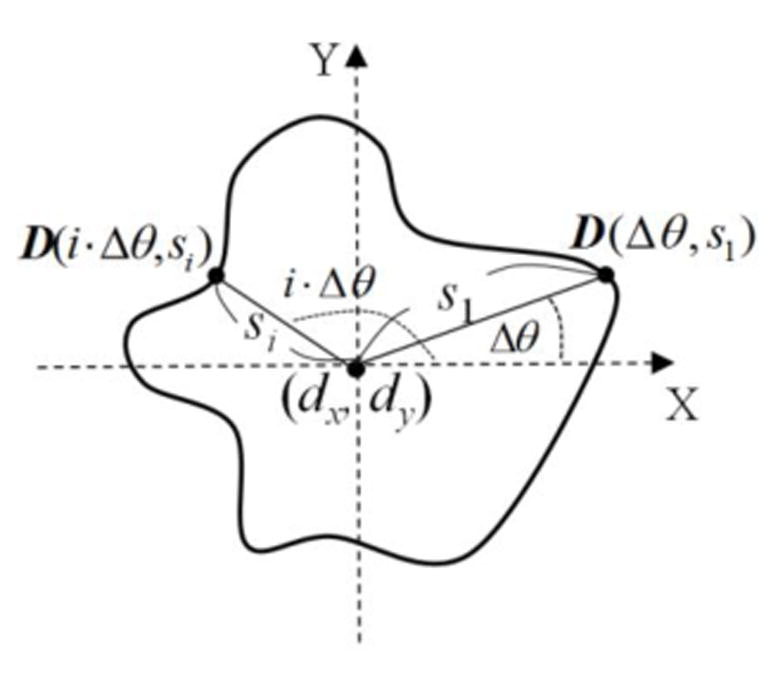
Parameterization of the deformable circular model.
3.3.2. Energy functions
The energy functions were defined in terms of deformation degrees of deformable model, and image evidences for specifying target boundaries. The energy value increases as the model deforms away from the target object. In the proposed method, the model deformation process was achieved by solving the shape parameters S that minimized the energy function EDCM:
| (7) |
where Econtrast is the contrast energy and Eshape is the shape energy to be defined in the next paragraph; α is a weight value determining the relative importance of the two energies. Generally, the gel boundary can be defined as the transition from dark to bright regions in the image However, the gel boundary usually presents a low-sloped intensity profile like a halo as shown in figure 6(a), creating uncertainty in defining the border of the collagen gel. Moreover, the gel image usually contains disordered edge information as indicated by the gray curve segments in the Sobel gradient image (see figure 6(b)). Use of a conventional intensity gradient as the boundary evidence for attracting the DCM is very likely to locate undesirable strong edges.
Figure 6.

Boundary appearance of collagen gel; (a) converted image and the horizontal intensity profile of a collagen gel (yellow line); (b) Sobel gradient image of converted image for better illustrating the confusing edge (dashed curve) and true gel boundary (solid curve), as well as the disordered edge distribution.
In order to attract the DCM to the true gel boundary, we designed the contrast energy based on the regional intensity gradient:
| (8) |
| (9) |
where n(D(θ, s)) represents the outer-pointing normal (radial direction) of the DCM contour at D(θ, s); Imax is a normalization constant and L is used to define the neighborhood around the contour of DCM. If the model is trapped by the confusing edges, the value of λ will be smaller, making the contrast energy value larger. The proposed contrast energy can attract the model to the position with strong regional intensity gradient and high intensities outside the DCM contour. Thus, the model is able to be properly located at the transition from the gel to dish regions.
The shape energy indicating the local shape curvature of the deformable model was defined as follows:
| (10) |
While the DCM contour is attracted by image noises with large gradient magnitudes, it probably results in a rather irregular shape. The shape energy EShape hence gives a large value and the energy function EDCM will be penalized. Overall, the contrast energy can accurately capture the desired gel boundary, while the shape energy properly constrains the degree of contour deformation to maintain smoothness and avoid excessive distortions.
During the implementation, equation (7) was minimized by iteratively adjusting the positions of the points on the DCM contour (i.e., updating the shape parameters) to fit the gel boundary along the radial directions of the contour. The iteration converges and stops when the sum of the displacements of points between the previous and current iterations is less than 5, or when the number of iterations reaches 15. The value of L defining the size of the neighborhood was set as 5, and Imax was assigned the value of 255.
3.3.3. Contraction stage-adaptive weighting scheme
The behavior of the DCM is controlled by the weighting factor α. As shown in figure 1, the gel intensity and shape appearances vary as the contraction progresses. Use of a single-valued weighting factor is inadequate to make the model accommodate these variations (i.e. difficulty I). We hence designed the contraction stage-adaptive weighting scheme to cope with this difficulty. In the proposed system, the gel contraction was divided into three stages based on the spatial configuration between the gel boundary and DP. The first stage covered the “no contraction” state (i.e., the entire gel stays on the DP). The second stage represented “intermediate contraction” (i.e., partial gel boundary movement and partial attachment to the DP). The third stage was “obvious contraction” (i.e., the entire gel boundary moves away from the DP toward the CRP). The proposed weighting scheme refers to the gel edge saliency within the feasible contraction region to automatically discriminate the contraction stages, and assign respective weighting values to the DCM.
Given two corresponding points of the detected circular references, the edge saliency ES on the line between the two points was calculated via the argument of maximization:
| (11) |
where represent the coordinates of corresponding contour points on the DP and CRP, respectively; Q is the distance between ;t(θ) is the unit vector from In general, a larger value of ES(θ) indicates a more obvious gel contraction in the radial direction indexed by θ. We subsequently calculated the total of edge saliency within the feasible contraction region:
| (12) |
| (13) |
where N = 360 / Δθ is the number of contour points on the circular references; U is the shifted unit step function and η is its shift value. Having the total saliency value, the gel contraction stage of the given image was estimated based on the following criterion:
| (14) |
where T1 and T2 are the thresholds differentiating the three contraction stages.
In estimating the contraction stage, the shift value η was given by 40, and T1 and T2 were empirically assigned as 20% and 90%, respectively. For stages I and III, the values of the weighting factor α were set to 1.0 and 0.1, respectively. Regarding stage II, we view the intermediate contraction as a fuzzy stage between stages I and III (i.e., partial gel attachment and partial obvious contraction). To properly segment the gel image in stage II, we partitioned the DCM contour into several connected segments based on the values of U(ES(θ) – η, as shown in figure 7. For each negative segment, its deformation degree was limited by setting the weighting factor α to 1.0. For positive segments, the weight was assigned as 0.1 to allow a more flexible deformation to capture obvious gel contraction.
Figure 7.
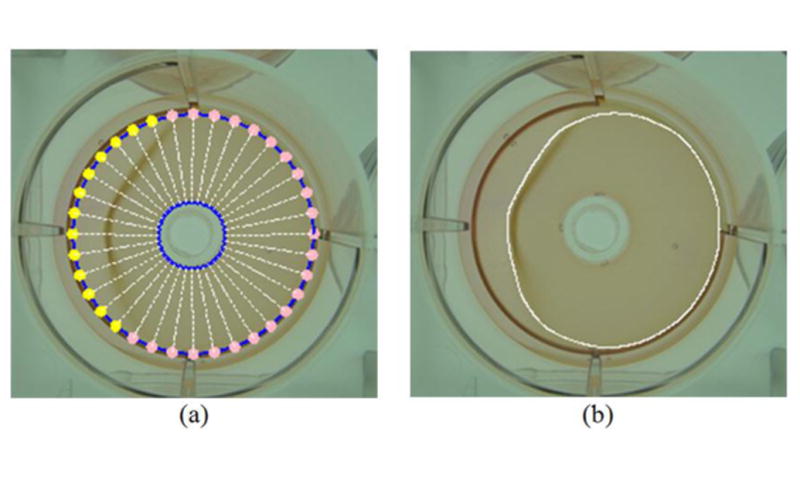
Example of the stage-II gel image; (a) the DCM is partitioned into two parts to have a more flexible behavior. Pink and yellow points are given weighting values of 1.0 and 0.1, respectively; (b) final segmentation result of collagen gel.
3.4. Quantitative measurements of collagen gel contraction
Two measurements of gel contraction, the area and diameter, are of interest in tissue engineering applications because they are frequently used to infer the tissue material properties. In general, the rate of area contraction reflects chemical and mechanical intra- and inter-reaction between the entire seeded cell and microenvironment [19]. The area is defined as the number of pixels enclosed by the gel contour and excluded from the CCRP. On the other hand, the diameter change of the collagen gel can also be used to indicate the degree of collagen contraction [20]. Different from the area, it allows further evaluation of the local contraction at specific cross-sections for testing tissue mechanical forces [20]. Since the shape of the gel is not perfectly circular due to variations of material tension, its diameter cannot simply be represented by a single radius value. To address this issue, existing studies of gel contraction analysis used methods that required users to manually select a number of different cross-sections and then calculate the mean diameter from these selections. A cross-section can be determined along the radial direction of a collagen gel. Since each cross-section specifies the diameter of a local gel region, the resulting mean diameter is representative of the diameter of the entire gel. In general, if the gel cross-sections are sampled more densely, the manual selection bias of cross-section could be reduced, and the average diameter will be more representative. However, in a practical applied measuring process, users are often limited to selecting a small sample of cross-sections because of time and resource constraints. For example, Linge et al. (2005) [21] measured the diameter by averaging five random diameters of a gel. In addition to efficiency concerns, manual selection of cross-sections is likely to suffer from intra- and inter-operator variability, making the measurement experiments unrepeatable. In contrast, the proposed system can uniformly and densely sample points on the segmented gel boundary (the sampling density is determined by Δθ), such that more accurate and objective measurements can be achieved in a fully-automated process. The diameter in the proposed system was defined as which is the average length of the section lines between segmented gel contour and CCRP. The two measurements can be efficiently obtained based on the gel segmentation results.
4. Experimental results
The experiments included an evaluation of accuracy of collagen gel segmentation, statistical analysis of gel contraction measurements, and a comparison study. In this study, we collected and cultured 10 subsynovial connective tissues from 5 rabbits (retired breeder female New Zealand white rabbits) and made them into 3 cell-seeded collagen gels. In total, 1800 gel contraction images were recorded; 360 out of them were excluded because of the artifacts of gel break occurring at days 10th, 12th and 14th, and the other 1440 images served as the validation image set for measuring the contraction parameters of collagen gels. Since manual segmentation of the whole data set would have been tedious and impractical, we randomly selected 120 images for the three experiments, and the numbers of gel images for the contraction stages I, II and III were equal. For each image in the experiments, we applied the proposed method to automatically segment the collagen gel and measure the contraction parameters. The proposed method consisted of the three-step color conversion strategy which effectively reduced the effects of color and contrast variations among different images. Thus, the system parameters in the DCM were able to be empirically determined via observing the contrast values of gel regions on color-converted images. The same parameters were utilized throughout the entire experiment.
4.1. Accuracy evaluation of gel segmentation
A qualitative evaluation was performed by visually inspecting the quality of fit of the automatic results to the true boundaries of collagen gels. Figure 8 includes the stage I image (figure 8(a)), the stage II images (figures 8(b)-8(f)), and the stage III images (figures 8(g)-8(i)). The segmentation results of the collagen gels were superimposed onto the original images, accompanied with arrows accentuating difficulties cause by the fuzzy boundaries.
Figure 8.
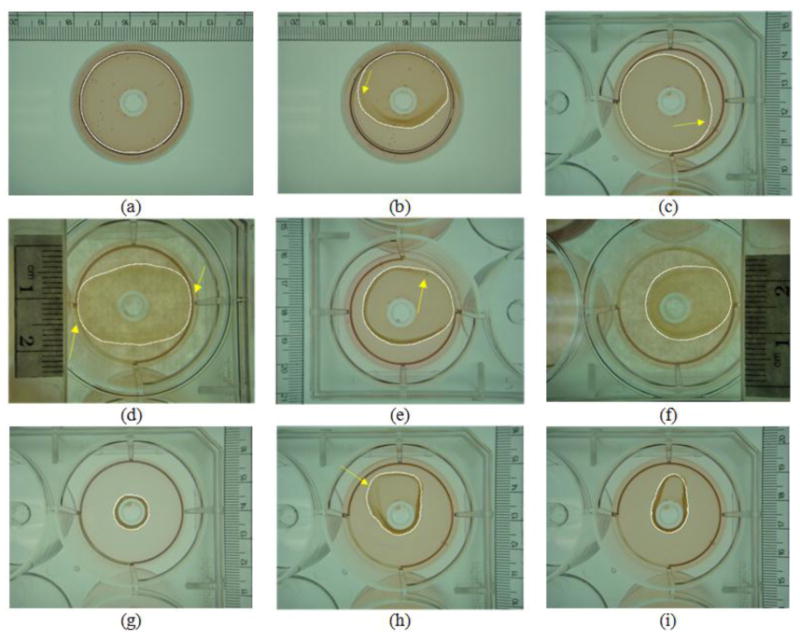
Visual evaluation for the automatic segmentation results of collagen gel images.
Beyond the qualitative evaluation, the segmentation results by the proposed automatic method were compared against the average of manual results of three study participants, which constituted the ground truth to validate accuracy of the proposed method. In practice, the three participants were allowed to manually identify the gel boundaries with joint reference to both the original and color-converted images (obtained using the proposed color conversion strategy in section 3.2). Since the two images provide the original gel color information as well as the contrast-enhanced gel region, the three participants can determine the gel boundaries confidently. The comparison for each image was then achieved based on three metrics, including the mean error (ME), the root mean square error (RMSE), and the dice similarity coefficient (DSC) [22]:
| (15) |
| (16) |
| (17) |
where ai is the i-th contour point of the automatic result; bj is the j-th contour point of the ground truth that is the closest to ai; N is the number of contour points of the automatic result; A and G are the sets of pixels classified as the collagen gels in the automatic result and the ground truth, respectively. The ME and RMSE represent the contour distance deviations between the automatic result and the ground truth. The DSC measures the spatial dependency between two segmented gel regions, and its value ranges from zero, indicating no overlap, to one, indicating complete overlap. The evaluation results were listed in table 1. The average ME was 0.612±0.488 pixel, the average RMSE was 1.034±0.645 pixel, and the average DSC was 98.113±1.124 %.
Table 1.
Means and standard deviations of the accuracy measures of the DSC, ME and RMSE estimated from the 120 collagen gel images.
| Image Stage | ME (pixel) | RMSE (pixel) | DSC (%) |
|---|---|---|---|
| Stage I (40 images) | 0.632±0.351 | 0.952±0.429 | 98.881±0.618 |
| Stage II (40 images) | 0.821±0.751 | 1.401±0.899 | 97.885±1.616 |
| Stage III (40 images) | 0.385±0.360 | 0.750±0.607 | 97.572±1.137 |
| Mean ± Standard deviation | 0.612±0.488 | 1.034±0.645 | 98.113±1.124 |
4.2. Statistical analysis on the measurement of collagen gel contraction
In addition to the validation of collagen gel segmentation, a statistical analysis for the results of the two gel contraction parameters (area and diameter) were performed. The ground truth in this experiment was given by the average manual measurement results, which were obtained by the original three participants. A Bland–Altman plot and linear regression analysis were generated to quantify agreement between the average measured parameters and the ground truth for the validation images, as shown in figure 9. The solid and dashed lines in the Bland-Altman plot indicate the mean bias and the limits of agreement, respectively. Regarding the regression analysis, the regression line is shown as a solid line, accompanied with the 95% confidence interval and the 95% prediction interval (the dashed orange curves). Note that the confidence interval is quite tight, practically overlapping the regression line.
Figure 9.
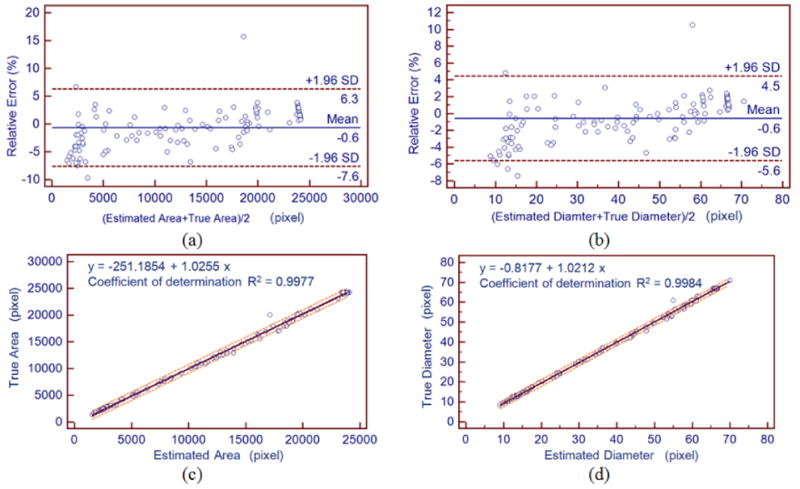
Statistical analysis on the contraction measurements; (a)-(b) Bland–Altman analysis comparing the proposed method to the ground truth for the gel area and diameter, resepctively; (c)-(d) The linear regression between the estimated parameters and the ground truth for the gel area and diameter, resepctively.
4.3. Comparison study
Image segmentation, which can provide spatial details of objects of interest, is a critical step for quantitative measurement/analysis. Although there have been a number of studies dedicated to development of image segmentation algorithms, they do not present solutions for handling the aforementioned difficulties of collagen gel segmentation. Adapting these methods to accommodate challenges presented by gel images would require significant modification of the original segmentation algorithms. However, two popular, generic methods which are potentially suitable for collagen gel image segmentation, including Otsu’s thresholding (OT) [13] and Chan-Vese level set evolution (CVLSE) [23], were selected for comparison with the proposed method in this experiment. To carry out an objective comparison, the OT and CVLSE methods were performed within the feasible range of gel contraction obtained in section 3.1, so that there were no falsely detected background objects disturbing the comparison. The comparison was first achieved by visually evaluating the segmentation results obtained by both the proposed method and the other two methods. Four examples are demonstrated in figure 10, wherein the 1st column shows four gel images in the validation experiments, and the 2nd through 4th columns demonstrate the segmentation results using OT, CVLSE, and the proposed method, respectively.
Figure 10.
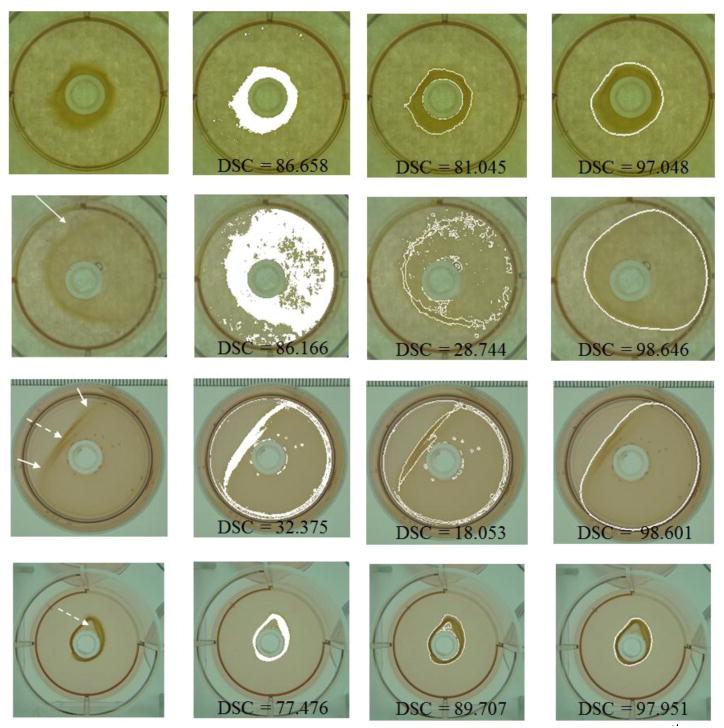
Comparison of the segmentation results for the collagen gel images; (1st column) original images; (2nd through 4th columns) segmentation results using Otsu’s thresholding, Chan-Vese level set evolution, and the proposed method, respectively.
In addition to the visual comparison, a quantitative evaluation was conducted on the four examples to achieve a more objective comparison. The quantitative evaluation was performed using the measure of spatial dependency, i.e., the DSC in equation (17). The evaluation results for the four examples obtained using the proposed method and the two existing methods are specified on each subfigure. It can be clearly observed from this quantitative evaluation that the accuracy of the proposed method is much better than either the OT or CVLSE methods.
5. Discussions
5.1. Accuracy evaluation
The proposed method utilized the circular shape constraint to adequately place the model at the positions of fuzzy boundaries (difficulty II), indicated by the arrows in figure 8. Moreover, it was found that the variations of gel boundary appearances (difficulty I) among different contraction stages can be successfully handled based on the proposed adaptive weighting scheme. Regarding the quantitative evaluation in table 1, the average MEs and RMSEs were less than 1.5 pixels (most are in sub-pixel segmentation error) and the average DSCs were above 0.95, indicating a good overlap between the automatic results and the ground truth [22].
On the other hand, observer variability which may potentially affect the reliability of the ground truth, is a concern when evaluating the accuracy of an image segmentation method. In order to assure this study of a reliable ground truth, an additional experiment, the details of which are not included this paper, was carried out to evaluate the observer variability. We calculated the ME, RMSE and DSC for each manual segmentation with respect to the average of the three manual results (i.e., the ground truth). Small inter-observer variability with small standard deviations of ME, RMSE and DSC (0.320, 0.391, and 0.654) were obtained in this experiment. Therefore, the reliability of the ground truth is confirmed in some sense in this case of collagen gel segmentation.
5.2. Statistical Analysis
Beyond the assessment of gel segmentation results, we further performed a statistical analysis for the collagen gel contraction measurements (including the area and diameter) using the Bland-Altman plot and linear regression in figure 9. The Bland-Altman plots revealed no obvious systematic biases of contraction parameter estimation and demonstrated a satisfactory degree of agreement (95% limits of agreement: -7.6 to 6.3 and -5.6 to 4.5 for the area and diameter measurements, respectively). The regression analysis of contraction parameters demonstrated significant correlation between the automatic and manual measurements (P-value < 0.001) and a coefficient value, R2 greater than 0.9. Moreover, most estimates fell within the 95% prediction interval, indicating good reliability of the proposed automatic method.
5.3. Comparison study
Figure 10 illustrates the comparison results of the three segmentation methods including the OT, CVLSE, and the proposed method. The OT method is based on the optimal binarization of the image intensity histogram, so it is sensitive to variations of color distribution within the gel region, as indicated by the dashed arrows in figure 10. For such cases (the 3rd and 4th examples of figure 10), the OT method obtained unsatisfactory segmentation results with only partial gel regions. On the other hand, the CVLSE method identifies regions by evolving the level set curve based on the color homogeneity, so it is weak in differentiating regions with similar colors and is hard to cope with fuzzy boundaries (indicated by the solid arrows). Moreover, neither the OT nor CVLSE method incorporates prior shape knowledge of collagen gel during the segmentation process. They are thus likely to yield a large number of fragmental regions, as shown in the 2nd and 3rd examples of figure 10.
Compared to the two conventional methods, the proposed method yielded much more desirable segmentation results (see the 4th column of figure 10), which were very close to the true gel boundaries and presented higher values of DSC. The proposed method utilizes the information of regional intensity gradient and circular shape constraint in the segmentation process, while its behavior is properly coordinated by the contraction stage-adaptive weighting scheme. Therefore, it can overcome the aforementioned difficulties of gel segmentation as well as achieve better segmentation results for the collagen gels.
5.4. System Performance
When evaluating an automatic segmentation method, its computational efficiency should be a major concern because processing time is an indicator of the practicality of the method in real applications. We assessed the computational time needed for segmenting a gel image using the proposed automatic measurement method on a computer with an Intel® Core™ i3-2310M processor (2.10 GHz) and 4.0 GB of memory. The average time costs for the color conversion, detection of maximal feasible contraction region, and DCM deformation were 94 ms, 137.2 ms, and 156.2 ms, respectively. A total average time required to completely automatically segment a gel image is 387.4 ms. Overall, the proposed system is able to obtain the two contraction measurements in less than half a second through a fully-automated process for a single gel image, while the resulting measurements are consistent with those achieved manually by trained researchers. Compared to the manual segmentation, which takes around one minutes to obtain precise gel segmentation and contraction measurements, the proposed system substantially reduces analysis time and demonstrates satisfactory computational performance for tissue contraction monitoring and material property estimation.
Due to the translucent characteristics of collagen gels and low-density cell aggregation around the gel boundaries, collagen gels may not be well-stained in rare cases resulting in low contrast levels between gel and dish regions, in which case the gel boundary is hard to directly observe, even by human eyes. The proposed system is likely to yield a larger segmentation error compared with the ground truth, which is a potential limitation. To make the proposed system more practical and reliable in real applications, a user-friendly software interface, not discussed in this paper, was designed for users to perform manual adjustments to segmentation results generated by automatic segmentation.
6. Conclusions
This paper has presented a new image analysis system for automatic segmentation of the collagen gels and quantitative measurement of the gel contraction. Major achievements of this paper were summarized as follows. A three-step color conversion strategy was developed to reduce the inconsistency of color distributions among gel images as well as to enhance the gel boundary evidence. Moreover, the regional intensity contrast, circular shape constraint, and prior knowledge of gel contraction stage changes were incorporated into the DCM segmentation process, so that the proposed DCM can accommodate the variations in intensities and shapes that develop during gel contraction. Both qualitative and quantitative experiments showed that the proposed method was able to achieve accurate gel segmentation and measurement results in a fully-automated process with 387 ms in average.
In the future, the system demonstrated in this work can be applied to improve repeatability in experiments evaluating contractility and force in tissue-engineering matrices. Moreover, the proposed DCM segmentation framework can be extended to automatically delineate the geometric and morphologic information for other tissues of interest contained in a circular reference (e.g. a culture dish). We believe that the proposed method has great potential to aid researchers in more efficiently collecting and analyzing a large amount of reproducible biological/biomaterial imaging data.
Acknowledgments
This work was supported by a grant from NIH/NIAMS R01 AR49823. The author acknowledges the guidance and support of Dr. Yu-Long Sun during this research.
References
- 1.Chapuis JF, Agache P. A new technique to study the mechanical properties of collagen lattices. J Biomech. 1992;25(1):115–120. doi: 10.1016/0021-9290(92)90250-5. [DOI] [PubMed] [Google Scholar]
- 2.Chen MY, et al. Substrate adhesion affects contraction and mechanical properties of fibroblast populated collagen lattices. Journal of Biomedical Materials Research Part B-Applied Biomaterials. 2008;84B(1):218–223. doi: 10.1002/jbm.b.30863. [DOI] [PubMed] [Google Scholar]
- 3.Germain L, et al. Human Wound-Healing Fibroblasts Have Greater Contractile Properties Than Dermal Fibroblasts. Journal of Surgical Research. 1994;57(2):268–273. doi: 10.1006/jsre.1994.1143. [DOI] [PubMed] [Google Scholar]
- 4.Li B, Wang JH. Fibroblasts and myofibroblasts in wound healing: force generation and measurement. J Tissue Viability. 2011;20(4):108–120. doi: 10.1016/j.jtv.2009.11.004. [DOI] [PMC free article] [PubMed] [Google Scholar]
- 5.Montesano R, Orci L. Transforming growth factor beta stimulates collagen-matrix contraction by fibroblasts: implications for wound healing. Proc Natl Acad Sci USA. 1988;85(13):4894–4897. doi: 10.1073/pnas.85.13.4894. [DOI] [PMC free article] [PubMed] [Google Scholar]
- 6.Moulin V, et al. Fetal and adult human skin fibroblasts display intrinsic differences in contractile capacity. J Cell Physiol. 2001;188(2):211–222. doi: 10.1002/jcp.1110. [DOI] [PubMed] [Google Scholar]
- 7.Weinberg CB, Bell E. A Blood-Vessel Model Constructed from Collagen and Cultured Vascular Cells. Science. 1986;231(4736):397–400. doi: 10.1126/science.2934816. [DOI] [PubMed] [Google Scholar]
- 8.Ilagan R, et al. Linear measurement of cell contraction in a capillary collagen gel system. Biotechniques. 2010;48(2):153–155. doi: 10.2144/000113349. [DOI] [PubMed] [Google Scholar]
- 9.Chen HC, et al. Registration-based segmentation with articulated model from multipostural magnetic resonance images for hand bone motion animation. Medical Physics. 2010;37(6):2670–2682. doi: 10.1118/1.3395580. [DOI] [PubMed] [Google Scholar]
- 10.Chen HC, et al. Automatic Insall-Salvati ratio measurement on lateral knee x-ray images using model-guided landmark localization. Physics in Medicine and Biology. 2010;55(22):6785–6800. doi: 10.1088/0031-9155/55/22/012. [DOI] [PubMed] [Google Scholar]
- 11.Peloschek P, et al. An automatic model-based system for joint space measurements on hand radiographs: initial experience. Radiology. 2007;245(3):855–862. doi: 10.1148/radiol.2452061281. [DOI] [PubMed] [Google Scholar]
- 12.Miao Q, et al. Multimodal 3D Imaging of Cells and Tissue, Bridging the Gap Between Clinical and Research Microscopy. Annals of Biomedical Engineering. 2012;40(2):263–276. doi: 10.1007/s10439-011-0411-5. [DOI] [PubMed] [Google Scholar]
- 13.Otsu N. Threshold selection method from grey-level histograms. IEEE Trans Syst Man Cybern. 1979;SMC-9(1):62–66. [Google Scholar]
- 14.Vincent L, Soille P. Watersheds in Digital Spaces - an Efficient Algorithm Based on Immersion Simulations. IEEE Transactions on Pattern Analysis and Machine Intelligence. 1991;13(6):583–598. [Google Scholar]
- 15.Kass M, Witkin A, Terzopoulos D. Snakes: Active contour models. International Journal of Computer Vision. 1988;1(4):321–331. [Google Scholar]
- 16.Cootes TF, et al. Active Shape Models - Their Training and Application. Computer Vision and Image Understanding. 1995;61(1):38–59. [Google Scholar]
- 17.Chen MY, et al. Factors related to contraction and mechanical strength of collagen gels seeded with canine endotenon cells. Journal of Biomedical Materials Research Part B-Applied Biomaterials. 2007;82B(2):519–525. doi: 10.1002/jbm.b.30757. [DOI] [PubMed] [Google Scholar]
- 18.Reinhard E, et al. Color transfer between images. IEEE Computer Graphics and Applications. 2001;21(5):34–41. [Google Scholar]
- 19.Chieh HF, et al. Effects of cell concentration and collagen concentration on contraction kinetics and mechanical properties in a bone marrow stromal cell-collagen construct. Journal of Biomedical Materials Research Part A. 2010;93A(3):1132–1139. doi: 10.1002/jbm.a.32606. [DOI] [PMC free article] [PubMed] [Google Scholar]
- 20.Simon SR. Orthopaedic Basic Science. Rosemont: American Academy of Orthopaedic Surgeons; 1994. pp. 397–446. [Google Scholar]
- 21.Linge C, et al. Hypertrophic scar cells fail to undergo a form of apoptosis specific to contractile collagen-the role of tissue transglutaminase. J Invest Dermatol. 2005;125(1):72–82. doi: 10.1111/j.0022-202X.2005.23771.x. [DOI] [PubMed] [Google Scholar]
- 22.Zou KH, et al. Statistical validation of image segmentation quality based on a spatial overlap index. Acad Radiol. 2004;11(2):178–189. doi: 10.1016/S1076-6332(03)00671-8. [DOI] [PMC free article] [PubMed] [Google Scholar]
- 23.Chan TF, Vese LA. Active contours without edges. IEEE Transactions on Image Processing. 2001;10(2):266–277. doi: 10.1109/83.902291. [DOI] [PubMed] [Google Scholar]


