

Abstract
Retinoids (vitamin A and its metabolites) are essential micronutrients that regulate many cellular processes. Greater than 70% of the body’s retinoid reserves are stored in the liver as retinyl ester (RE). Chronic alcohol consumption induces depletion of hepatic retinoid stores, and the extent of this has been correlated with advancing stages of alcoholic liver disease. The goal of this study was to analyze the mechanisms responsible for depletion of hepatic RE stores by alcohol consumption. A change in the fatty-acyl composition of RE in alcohol-fed mice was observed within two weeks after the start of alcohol consumption. Specifically, alcohol-feeding was associated with a significant decline in hepatic retinyl palmitate levels; however, total RE levels were maintained by a compensatory increase in levels of usually minorRE species, particularly retinyl oleate. Our data suggests that alcohol feeding initially stimulates a futile cycle of RE hydrolysis and synthesis, and that the change in RE acyl composition is associated with a change in the acyl composition of hepatic phosphatidylcholine. The alcohol-induced change in RE acyl composition was specific to the liver, and was not seen in lung or white adipose tissue. This shift in hepatic RE fatty acyl composition is a sensitive indicator of alcohol consumption and may be an early biomarker for events associated with the development of alcoholic liver disease.
Keywords: Vitamin A, Retinyl ester, Phosphatidylcholine, Hepatic stellate cells, Liver metabolism, Alcoholic liver disease
1. Introduction
Dietary retinoids (vitamin A and its metabolites) are required to maintain many important physiological processes [1]. The active retinoid metabolites include 11-cis-retinal, which is required for chromophore formation in vision [2], and all-trans- and 9-cis-retinoic acids, which are required for normal cell proliferation, differentiation, and apoptosis [1, 3, 4]. The liver is of central importance in whole body retinoid metabolism; it is the primary site of retinoid storage in the body and it also mediates distribution of stored retinoid to other tissues through the secretion of retinol bound to retinol-binding protein [5, 6]. Chronic alcohol consumption decreases hepatic retinoid stores, as reviewed [7]. In a seminal study, Leo and Lieber demonstrated that alcoholics have decreased hepatic retinoid content and that as the severity of alcoholic liver disease (ALD) progresses, there is a progressive decline in hepatic retinoid levels [8]. Subsequent studies in animal models confirmed this observation and established that loss of hepatic retinoid is not due to dietary-insufficiency, but rather a direct effect of alcohol on hepatic retinoid homeostasis [7].
Approximately 70% of total retinoid present in the body is located in the liver. Within this tissue, greater than 90% of this retinoid is stored as retinyl ester (RE) within the lipid droplets of hepatic stellate cells (HSC) [5]. The synthesis of RE in HSCs is catalyzed by lecithin:retinol acyltransferase (LRAT), and the substrates for this reaction are retinol and the fatty acyl group present at the sn-1 position of phosphatidylcholine (PC) [9–11]. In addition to LRAT, a second RE synthesizing activity has been identified, termed acyl CoA:retinol acyltransferase (ARAT), which uses fatty acyl-CoA as a substrate for RE synthesis [12]. Diacylglycerol acyltransferase 1 (DGAT1) has been shown to act as an ARAT in the skin and intestine [13, 14]. Although an ARAT activity was previously reported to be present in liver homogenates [15], the complete absence of hepatic RE stores in Lrat-null (Lrat−/−) mice establishes that LRAT is essential and solely responsible for RE synthesis in the liver under normal physiological conditions [16–18]. The enzyme responsible for the hydrolysis of HSC RE stores is less well understood; while several enzymes have been proposed to possess retinyl ester hydrolase (REH) activity, definitive identification of physiologically significant REHs in HSCs is lacking [19, 20]. Nevertheless, it is clear that the central mechanism controlling HSC RE levels is the balance between RE synthesis and hydrolysis.
During our studies of the pathogenesis of ALD in experimental mice, we observed that alcohol consumption is associated with a marked alteration in the fatty acyl composition of hepatic RE stores, which precedes their loss from the liver. The data reported in this manuscript examines the effect that alcohol consumption has on hepatic RE, and includes a series of follow-up studies addressing the potential mechanism(s) mediating this change. We interpret these data to indicate that alcohol stimulates a futile cycle of HSC RE synthesis and hydrolysis that starts during the initial phase of chronic alcohol consumption. We propose that the observed change in fatty acyl composition of RE has the potential to serve as an early biomarker of alcohol consumption. Our data further suggest that this change reflects an underlying switch in the fatty acyl composition of hepatic PC, which we believe has implications for the development of ALD.
2. Methods
2.1. Animal husbandry and alcohol feeding protocol
All animal experiments were performed according to the criteria established by the National Academy of Science as described in the “Guide for the Care and use of Laboratory Animals”, and were approved by the Institutional Animal Care and Use Committee at Columbia University. The majority of our experiments were carried out using 3 month old male C57BL/6J mice. The generation of Lrat−/− and Dgat1 null (Dgat1−/−) mice has been previously described [16, 21], and these mice have been previously used in our laboratory to study retinoid physiology [13]. Both Lrat−/− and Dgat1−/− mice were in congenic C57BL/6J backgrounds and were bred and maintained in our colony at Columbia University. Note that the Dgat1−/− mice used in these studies were 6 months old, which explains the higher baseline levels of hepatic RE in these mice. All mice were maintained in an environmentally controlled animal facility with a 12-h light:dark cycle. Prior to the start of our alcohol feeding studies, mice were maintained on a standard rodent chow diet. At the start of each alcohol feeding experiment, mice were randomized into groups receiving control or alcohol-containing Lieber–DeCarli liquid diets (control: F5937SP, alcohol: F5938SP; Bio-Serv, Frenchtown, NJ). This alcohol feeding paradigm is well established in the literature and has previously been employed by our laboratory to study the effect of alcohol on hepatic lipid metabolism [22, 23]. In the vitamin A-deficient (VAD) diet study, custom diets were identical to the vitamin A-sufficient (VAS) control and alcohol-containing liquid diets, except that they were devoid of any source of vitamin A (VAD control: F6360SP, VAD alcohol: F6361SP; Bio-Serv). All experimental mice were individually housed and diet consumption in the alcoholfed mice was measured to allow pair-feeding of control animals. Our alcohol feeding protocol is shown schematically in Fig. 1A. In brief, mice underwent an alcohol adaptation period that included 1 week consuming the control diet, followed by 1 week of 2.1% v/v alcohol and 1 week of 4.2% v/v alcohol. Following the adaptation period, mice were fed 6.4% v/v alcohol for up to 4 weeks. At the end of the alcohol feeding experiments, plasma, liver, lung and epigonadal white adipose tissue (WAT) samples were collected and snap frozen in liquid N`, and then stored at −80 °C prior to analysis. Additional alcohol feeding protocols using the low-fat formulation of the Lieber-DeCarli liquid diet and ethanol added to the drinking water of mice have been previously described [24, 25].
Fig. 1.
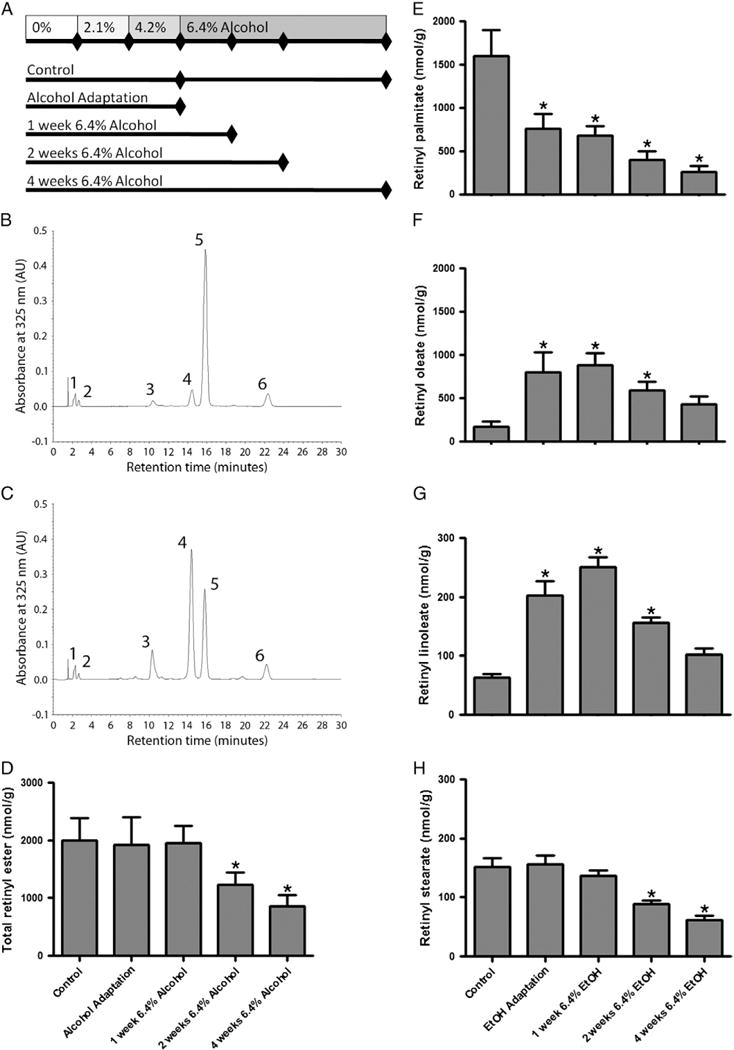
Alcohol feeding is associated with an alteration in the fatty acyl composition of hepatic retinyl ester. A diagram showing the alcohol feeding protocol used in this study is provided (A). Tissue was collected from mice in the control group after 3 or 7 weeks of consuming the alcohol-free liquid diets. Tissue was collected from alcohol-fed mice after the adaptation period and after consuming 6.4% alcohol for 1, 2 and 4 weeks. Representative HPLC chromatograms are shown for control (B) and alcohol-fed mice (C) for liver tissue collected immediately after the alcohol adaptation period. Numbered peaks correspond to 1) retinol, 2) retinyl acetate (internal standard), 3) retinyl linoleate, 4) retinyl oleate, 5) retinyl palmitate and 6) retinyl stearate. Quantification of retinyl esters revealed a significant decline in total hepatic retinyl ester concentration after 2 and 4 weeks of consuming 6.4% alcohol (D). Hepatic levels of retinyl palmitate were significantly decreased following the alcohol adaptation period (E). Hepatic levels of retinyl oleate were significantly increased in association with alcohol consumption (F). We also observed alcohol-induced changes in the hepatic levels of the less abundant retinyl ester species, retinyl linoleate (G) and retinyl stearate (H). Data analyzed by one-way ANOVA; * p < 0.05 versus control.
2.2. Measurement of tissue retinoid content
Tissue RE levels were measured by reverse phase HPLC. This protocol is well established in our laboratory and has been previously described [13, 26, 27]. In brief, retinoids present in tissue homogenates were mixed with an equal volume of ethanol containing a known amount of retinyl acetate (Sigma-Aldrich Co., St Louis, MO) as an internal standard, and then extracted using hexane that was then evaporated under a stream of N2. Extracted retinoids were then dissolved in benzene and separated using a 4.6 × 250 mm Waters Symmetry C18 column (Waters Corp., Milford, MA); the mobile phase was 70% acetonitrile, 15% methanol, and 15% methylene chloride, running at a flow rate of 1.8 ml/min. Absorption was measured at 325 nm, and retinoids present in tissue extracts were identified by comparing the retention time and spectral data of HPLC chromatograms with those of purified standards. Quantification of tissue retinoid levels were calculated using integrated peak areas and were adjusted relative to the recovery of the internal standard.
Highly sensitive ultra performance liquid chromatography mass spectrometry (LC/MS) was used to measure plasma RE levels. Samples were extracted using 100 μl of serum diluted in 400 μl of PBS in a clean glass tube. Five hundred microliters of absolute ethanol containing 100 pmol of retinyl acetate (Sigma-Aldrich Co.) was then added as an internal standard. Subsequently, 4 ml of hexane was added, the samples were thoroughly mixed, and then centrifuged for 10 min at 2000 g. The organic upper phase was then transferred into a clean glass tube and was evaporated under a gentle stream of N2. The dried lipid was resuspended in 50 μl of methanol and transferred to an autosampler vial (Waters Corp.) for analysis.
All LC/MS analyses were carried out using a Waters Xevo TQ MS Acquity UPLC system (Waters Corp.), controlled by MassLynx software V4.1. Prior to injection, samples were maintained at 4 °C in the autosampler. Samples were injected into an Acquity UPLC BEH Phenyl column (Waters Corp., 3.0 mm inner diameter × 100 mm; with 1.7 μm particles). Throughout sample analysis, the column was maintained at 40 °C. The flow rate was 300 μl/min in a binary gradient mode, with the following mobile phase gradient: initiated with 5% mobile phase A (water containing 0.2% formic acid and 1 mM ammonium formate) and 95% mobile phase B (methanol containing 0.2% formic acid and 1 mM ammonium formate). The gradient for mobile phase B was increased linearly to 97.5% for 5 min. The column was then washed with 99% methanol for 1 min and the next sample was injected. Positive ESI-MS mass spectrometry with selected ion recording mode was performed using the following parameters: capillary voltage −4.0 kV, source temperature 150 °C, desolvation temperature 500 °C, and desolvation gas flow 1000 l/h. Retinol and RE were detected using m/z 269.25 (retinol anhydrate[M + H]+) and identified by comparing the retention times of experimental compounds with those of authentic standards. Concentrations of RE in the serum were quantitated by comparing integrated peak areas for those of each retinoid against those of known amounts of purified standards. Loss during extraction was accounted for by adjusting for the recovery of the internal standard added before extraction.
2.3. Measurement of hepatic phosphatidylcholine composition
Liquid chromatography tandem mass spectrometry (LC/MS/MS) was used to measure hepatic PCs. Samples for PC analysis were extracted using 2:1 (v/v) chloroform/methanol. Briefly, approximately 100 mg of liver was homogenized in 2 ml of PBS using a Tissue-Tearor (BioSpec Products, OK, USA), then 20 μl of the tissue homogenate was transferred to a clean glass tube and mixed with 2 ml chloroform and 1 ml methanol, containing 2 nmol 17:0/17:0 PC as an internal standard. After thorough mixing, 0.5 ml of PBS was added to allow for phase separation. The mixture was thoroughly mixed a second time and then centrifuged at 3000 g for 10 min to separate phases. Following centrifugation, the lower organic phase was transferred to a clean glass tube and 2 ml of chloroform was added to the residual aqueous phase, which was then vigorously mixed and centrifuged at 3000 g for 10 min, to extract any remaining lipids. The lower organic phases were pooled and evaporated to dryness under N2. The extracted lipids were reconstituted in 1.5 ml of acetonitrile/methanol (v:v = 1:1) and 200 μl was transferred to an autosampler vial (Waters Corp.) for analysis.
All PC analyses were carried out using a Waters Xevo TQ MS Acquity UPLC system (Waters Corp.), controlled by MassLynx software V4.1. Samples were injected into the same column as described above. The flow rate was 500 μl/min in a binary gradient mode with the following mobile phase gradient: initiated with 8% mobile phase A (water containing 0.2% formic acid and 1 mM ammonium formate) and 92% mobile phase B (methanol containing 0.2% formic acid and 1 mM ammonium formate). The gradient of mobile phase B was increased linearly to 100% over 6 min, the column was then washed with 100% methanol for 2 min, and subsequently the initial gradient was restored for 30 s before the next sample was injected. The phosphatidylcholines of interest were eluted between 1.5 and 5 min. Positive ESI-MS/MS in the multiple reaction monitoring (MRM) mode was performed using the following parameters: capillary voltage, 3.85 kV; source temperature, 150 °C; desolvation temperature, 500 °C; desolvation gas flow, 1000 l/h; and collision gas flow, 0.18 ml/min. The optimized cone voltage was 42 V, collision energy for multiple reactions monitoring mode was 30 eV. For MRM analysis, m/z of [M + H]+ was used for each parent ion, and m/z of 184.2 was used for all the daughter ions. PC concentration was calculated as described above for plasma RE levels. PC reference standards and the 17:0/17:0 PC internal standard were obtained from Avanti Polar Lipids (Alabaster, AL).
2.4. Western blotting
Western blotting was performed using standard techniques, as previously described by our laboratory [27]. For all proteins examined, 30 μg of total liver protein was analyzed. Membranes were probed with a primary antibody raised against LRAT (1:2000; a gift from Dr. Krystof Palczewski, Case Western Reserve University, Cleveland, OH). Protein loading and relative quantification of protein expression were normalized using the reference protein, β-actin (1:1000; sc-10731; Santa Cruz Biotechnology, Santa Cruz, CA). Protein bands were visualized using an enhanced chemiluminescence system (GE Healthcare Worldwide, Little Chalfont, UK), films were digitally scanned and analyzed using ImageJ to generate relative protein expression data [28].
2.5. Quantitative real-time PCR (qPCR)
RNA extraction, cDNA synthesis and qPCR were carried out according to standard protocols in our laboratory, as recently described [23]. The primer sequences used to amplify Gpat1 were as follows: forward, 5′-TTC GTG GGA AGG TGC TGC TA-3′ and reverse, 5′-CCA TCC TCT GTG CCT TGT GT-3′; the amplicon size was 129 bp. The primer sequences used to amplify Gpat4 were as follows: forward, 5′-GGC TTA GGA GTG CTG ATT CGG-3′, reverse, 5′-TCT CCC ATT TGG CAG GTA TCC AAC-3′; the amplicon size was 120 bp. Expression levels of target genes were expressed relative to the reference gene 18 s (forward primer, 5′-CCA TCC AAT CGG TAG TAG CG-3′, reverse primer, 5′-GTA ACC CGT TGA ACC CCA TT-3′; amplicon size = 150 bp).
2.6. Statistical analysis
Statistical analysis was performed using Prism5 (GraphPad software, La Jolla, CA). Data are presented as the mean ± standard deviation, unless otherwise stated. Depending on the group size and experimental design, data were analyzed by Student’s t-test, one-way ANOVA (using a Tukey multiple comparisons post-hoc test) or two-way ANOVA (using a Bonferroni post-hoc test), as specified below. A p-value < 0.05 was considered a statistically significant difference. There was no difference in RE levels for control mice between the adaptation period and the end-point of the experiment, thus these data were pooled for statistical analyses.
3. Results
3.1. Alcohol consumption alters the fatty acyl composition of hepatic retinyl ester
C57BL/6J mice were chronically fed with 6.4% v/v alcohol for up to 4 weeks. Hepatic RE levels were assessed by reverse-phase HPLC; during analysis of HPLC chromatograms a pronounced change in the fatty acyl composition of hepatic RE was observed in alcohol-fed mice versus pair-fed control animals (Fig. 1). Specifically, we noted that in alcohol-fed mice, retinyl palmitate was no longer the predominant RE species in the liver (Fig. 1C; peak 5) rather, retinyl oleate became the most abundant (Fig. 1C; peak 4). Quantitative analysis of the total RE content (Fig. 1D), as well as the absolute abundance of retinyl palmitate (Fig. 1E) and retinyl oleate (Fig. 1F) revealed striking alcohol-induced changes in the levels of these retinoids. The total level of RE was unchanged during the adaptation period and after one week of consuming 6.4% alcohol; however, after two weeks of consuming 6.4% alcohol the total level of RE significantly declined and continued to drop at the 4 week time point. Although there was no significant decline in total RE levels during or immediately after the adaptation period, pronounced changes in the relative levels of retinyl palmitate and retinyl oleate were observed. At this early time point, there was a greater than 50% drop in the level of retinyl palmitate, whereas levels of retinyl oleate increased more than 500%. Throughout the alcohol feeding protocol, levels of retinyl palmitate continued to drop, while retinyl oleate levels reached a peak after one week of consuming 6.4% alcohol, and then began to slowly decline in parallel with total RE levels. We also observed a transient increase in the level of retinyl linoleate, which followed the same trend as retinyl oleate, though at a quantitatively lower level (Fig. 1G). Levels of retinyl stearate remained relatively constant until the second week of consuming 6.4% alcohol, at which point they too significantly declined (Fig. 1H). Given the dramatic early change in hepatic RE fatty acyl composition, our subsequent studies focused on the adaptation period of the alcohol feeding protocol.
3.2. The effect of chronic alcohol consumption on the fatty acyl composition of hepatic retinyl ester is reversible
In a separate alcohol feeding study, we asked if the alcohol-induced change in fatty acyl composition of hepatic RE was reversible (Fig. 2). As expected, the total hepatic RE levels in mice fed-alcohol for two weeks (i.e. the adaptation period) were unchanged relative to control-fed mice and animals that were first fed alcohol for two weeks and then returned to an alcohol-free diet for four weeks (Fig. 2A). Consistent with our first alcohol feeding experiment, alcohol-fed mice had significantly lower hepatic retinyl palmitate levels than control-fed mice (Fig. 2B). Strikingly, animals that were fed with alcohol and then allowed to recover on an alcohol-free diet had hepatic retinyl palmitate levels that were identical to control-fed mice (Fig. 2B). An opposite effect was observed for hepatic retinyl oleate (Fig. 2C) and linoleate levels (Fig. 2D); alcohol feeding was associated with significant increases in the level of these RE species, which returned to their baseline levels after the withdrawal of alcohol from the diet.
Fig. 2.

The change in hepatic fatty acyl composition of retinyl ester is reversible following the withdrawal of alcohol from the diet. Hepatic retinyl esters were examined in mice fed with the control liquid diet (control), the alcohol-containing liquid diet for the adaptation period (alcohol), or the alcohol-containing liquid diet for the adaptation period and then an alcohol-free diet for a further 4 weeks (recovery). The total hepatic retinyl ester (A), retinyl palmitate (B), retinyl oleate (C), and retinyl linoleate (D) levels are shown. Data analyzed by one-way ANOVA; * p < 0.05 versus control.
3.3. Alcohol feeding is associated with a significant change in circulating retinyl esters
In addition to hepatic RE, we also explored whether alcohol feeding had an effect on levels of RE circulating in the blood (Fig. 3). Although retinol can be easily measured in the circulation by HPLC, we used the more sensitive LC/MS methodology to measure circulating RE because of the relatively lower levels of RE and the small volume of blood available for analysis from mice. Our results indicate that the level of retinyl palmitate was not different in control and alcohol-fed mice (Fig. 3A). There was, however, a statistically significant (~70%) increase in the level of retinyl oleate in the circulation of alcohol-fed mice, which was consistent with the increase in hepatic levels of retinyl oleate (Fig. 3B). This increase in circulating retinyl oleate was also associated with a significant shift in the ratio of circulating retinyl palmitate to retinyl oleate (Fig. 3C). Thus, in addition to alcohol’s effect on hepatic RE, alcohol feeding was also associated with a significant change in circulating RE levels and fatty acyl composition.
Fig. 3.

Alcohol feeding is associated with an alteration in the fatty acyl composition of plasma retinyl ester. Circulating levels of retinyl palmitate are not significantly different in control and alcohol-fed mice (A). However, alcohol feeding is associated with a significant increase in the circulating level of retinyl oleate (B). The retinyl palmitate:retinyl oleate ratio is significantly altered in alcohol-fed mice (C). Data analyzed by Student’s t-test; * p < 0.05 versus control.
3.4. Alcohol consumption does not significantly alter the fatty acyl composition of retinyl ester in the lung and white adipose tissue
In order to determine if alcohol consumption also affected the fatty acyl composition of RE in other tissues, RE levels were investigated in the lung and WAT (Table 1). Lung tissue was chosen because it is one of the few tissues in the mouse, in addition to the liver, which stores significant amounts of RE in an LRAT-dependent manner, in pulmonary stellate cells [16, 29–31]. WAT was chosen because it also stores significant quantities of RE; however; RE storage in this tissue is LRAT-independent [17]. Consistent with the notion that alcohol consumption induces a mobilization of hepatic retinoid to extra-hepatic tissues [7], total lung and WAT RE levels were increased in response to alcohol feeding (Table 1). In the lung, total RE levels were increased following the adaptation period and remained high throughout the alcohol feeding protocol. In contrast to the liver, levels of retinyl palmitate, oleate, and linoleate increased proportionately with total RE levels; specifically, an immediate and sustained increase following the alcohol adaptation period (though retinyl stearate levels were unchanged). In the WAT, there was a trend for an increase in total RE levels after the adaptation period, although this change did not become significant until the second week of consuming 6.4% alcohol. A similar pattern was seen for retinyl palmitate, oleate, and linoleate in WAT; with an immediate increase in the tissue levels of these RE species observed after the alcohol adaptation period, which became significant with continued alcohol consumption.
Table 1.
Quantitative analysis of lung and white adipose tissue retinyl esters in C57BL/6J mice fed alcohol.a
| Group | n | Total retinyl ester | Retinyl palmitate | Retinyl oleate | Retinyl linoleate | Retinyl stearate |
|---|---|---|---|---|---|---|
| Lung tissue | ||||||
| Control | 12 | 720 ± 26 | 434 ±139 | 49 ± 33 | 24 ± 14 | 211 ±82 |
| Alcohol adaptation | 6 | 1354 ± 386* | 841 ± 271* | 130 ±96* | 78 ± 48* | 299 ± 63 |
| 1 week 6.4% alcohol | 6 | 1305 ± 230* | 822 ±140* | 168 ±43* | 76 ± 17 | 236 ± 40 |
| 2 weeks 6.4% Alcohol | 6 | 1302 ± 178* | 772 ±124* | 196 ±48* | 84 ± 10 | 246 ± 50 |
| 4 weeks 6.4% alcohol | 4 | 1337 ± 230* | 730 ±145* | 257 ± 33* | 92 ± 11* | 254 ± 55 |
| White adipose tissue | ||||||
| Control | 12 | 3.95 ± 3.0 | 1.71 ± 1.1 | 1.42 ±1.2 | 0.82 ± 0.8 | n.d. |
| Alcohol adaptation | 6 | 19.23 ± 23.9 | 6.49 ± 7.6 | 7.54 ± 9.7 | 5.21 ± 6.5 | n.d. |
| 1 week 6.4% alcohol | 6 | 19.94 ± 5.3 | 6.65 ±1.6 | 8.56 ± 2.3 | 4.74 ±1.5 | n.d. |
| 2 weeks 6.4% Alcohol | 6 | 26.73 ± 7.8* | 8.49 ± 3.0* | 11.70 ± 3.1* | 6.54 ± 2.0* | n.d. |
| 4 weeks 6.4% alcohol | 4 | 34.26 ± 15.1* | 11.42 ± 4.8* | 14.9 ± 6.8* | 7.95 ± 3.6* | n.d. |
n.d.: not detectable.
All data are mean ± SD and are expressed in nmol/g.
p < 0.05 versus control (one-way ANOVA).
3.5. Alcohol’s effect on RE is not mediated by DGAT1 but is dependent on LRAT expression
The major alcohol-induced change in hepatic RE fatty acyl composition was the transition from predominantly retinyl palmitate in control mice to retinyl oleate in alcohol-fed mice. Interestingly, retinyl oleate has been identified as the predominant product formed by an ARAT activity involved in the synthesis of RE [12, 13], leading us to speculate that alcohol feeding may have induced an acyl-CoA-dependent pathway for RE synthesis, possibly via DGAT1. This hypothesis was first tested in alcohol-fed Dgat1−/− mice. As seen from Table 2, a switch to predominantly retinyl oleate from retinyl palmitate was observed in alcohol-fed Dgat1−/− mice, indicating that this enzyme was not contributing to the change in fatty acyl composition of hepatic RE. This finding led us to two alternate hypotheses: 1) alcohol-feeding induced a previously uncharacterized hepatic ARAT enzyme, or 2) LRAT was responsible for the increased synthesis of normally minor RE isoforms. These hypotheses were tested in Lrat−/− mice (Table 2). Nohepatic REs were detectable in Lrat−/− mice fed with the control diet, an observation consistent with previous descriptions of these mice fed with a chow diet [16–18]. The absence of RE in livers of alcohol-fed Lrat−/− mice disproves the hypothesis that alcohol feeding induced an unknown ARAT activity, and demonstrates that LRAT expression is required for the synthesis of RE in alcohol-fed mice. Given the central role of LRAT in RE synthesis within the liver, we examined protein expression levels of LRAT in control and alcohol-fed livers. Following the adaptation period to the alcohol-containing liquid diets, there was a non-significant increase in LRAT expression that became statistically significant after 1, 2 and 4 weeks of consuming 6.4% alcohol (Fig. 4).
Table 2.
Quantitative analysis of hepatic retinyl esters in age- and gender-matched Dgat1−/− and Lrat−/− mice fed alcohol.a
| Group | n | Total retinyl ester | Retinyl palmitate | Retinyl oleate | Retinyl linoleate | Retinyl stearate |
|---|---|---|---|---|---|---|
| Dgat1−/− | ||||||
| Control | 4 | 5077 ± 499 | 4193 ± 490 | 335 ± 33 | 190 ± 8 | 359 ± 34 |
| Alcohol | 5 | 3594 ± 715* | 1151 ± 311* | 1663 ± 255* | 427 ± 79* | 297 ± 67 |
| Lrat−/− | ||||||
| Control | 4 | n.d. | n.d. | n.d. | n.d. | n.d. |
| Alcohol | 5 | n.d. | n.d. | n.d. | n.d. | n.d. |
n.d.: not detectable.
Dgat1−/− and Lrat−/− mice were on a congenic C57BL/6J background; tissue was collected following the alcohol adaptation period; all data are mean ± SD and are expressed in nmol/g.
p < 0.05 versus control (Student’s t-test).
Fig. 4.

Hepatic LRAT protein expression is increased by chronic alcohol consumption. Representative Western blot data for LRAT and β-ACTIN are shown for liver tissue collected during chronic alcohol feeding (A). Quantification of LRAT (B) protein expression relative to β-actin is also shown, indicating that chronic alcohol consumption increases LRAT protein expression level. Data analyzed by Student’s t-test; * p < 0.05 versus control.
3.6. Synthesis of RE in the alcohol exposed liver is independent of dietary retinoid intake
The above experiments were designed to identify the enzymes that may be important in mediating the observed change in hepatic fatty acyl composition of RE. In addition to this mechanistic insight, we were also interested in determining the origin of the substrates for the apparently newly synthesized retinyl oleate in the liver of alcohol-fed mice. The question of whether dietary retinol was being preferentially incorporated into newly synthesized RE was answered in control and alcohol-fed mice maintained on VAS and VAD diets. Interestingly, alcohol-fed mice fed either a VAS or a VAD diet had no significant differences in the total hepatic RE content, or in the levels of the individual RE species (Table 3). Similar to the results described above, regardless of the retinoid content of the diet, the livers of alcohol-fed mice contained significantly less retinyl palmitate, whereas levels of retinyl oleate, linoleate and stearate were significantly increased.
Table 3.
Quantitative analysis of hepatic retinyl esters in matched control and alcohol-fed C57BL/6J mice provided with vitamin A-sufficient and vitamin A-deficient liquid diets.a
| Vitamin A sufficient
|
Vitamin A deficient
|
2-way ANOVA (p-value)
|
|||||
|---|---|---|---|---|---|---|---|
| Control (4) | Alcohol (6) | Control (5) | Alcohol (7) | A | VA | I | |
| Total Retinyl ester | 1471 ± 80 | 1375 ± 203 | 1556 ±188 | 1565 ±112 | n.s. | n.s. | n.s. |
| Retinyl palmitate | 1229 ± 58 | 531 ± 57* | 1310 ± 152 | 590 ± 59* | <0.05 | n.s. | n.s. |
| Retinyl oleate | 95 ± 15 | 564 ±115* | 95 ± 18 | 660 ± 58* | <0.05 | n.s. | n.s. |
| Retinyl linoleate | 43 ± 4 | 162 ± 30* | 42 ± 6 | 174 ± 14* | <0.05 | n.s. | n.s. |
| Retinyl stearate | 101 ± 10 | 112 ± 19 | 105 ± 19 | 137 ± 12* | <0.05 | n.s. | n.s. |
Tissue was collected following the alcohol adaptation period; all data are mean ± SD and are expressed in nmol/g; n for each group is given in brackets; data analyzed by two-way ANOVA; A = dietary alcohol; VA = dietary vitamin A content; I = interaction; n.s.: not significant.
p < 0.05 between control and alcohol-fed mice.
3.7. Alterations in the fatty-acyl composition of RE are alcohol-dependent, and occur independent of dietary fat content and alcohol-feeding paradigm
The results described above were obtained from mice being fed the high-fat formulation of the Lieber–DeCarli liquid diet, which contains high levels of 18-carbon fatty acids, which may have promoted the synthesis of RE with 18-carbon substrates (i.e. retinyl oleate and linoleate). The maximum duration of time that mice were fed with the alcohol-containing liquid diets was seven weeks (including the adaptation period plus a further four weeks of feeding). In order to ascertain that feeding the high-fat containing liquid diet for this duration did not significantly alter the fatty acyl composition of RE, we compared the hepatic RE fatty acyl composition of mice fed only the control diet for the adaptation period versus mice consuming the control diet for seven weeks (Fig. 5A). Mice consuming alcohol-free high-fat liquid diets for up to seven weeks do not show a significant decline in hepatic retinyl palmitate levels or increased retinyl oleate levels, as was observed in alcohol-fed mice over the same duration. Indeed, while there was no change in relative retinyl palmitate levels over this time course, there was actually a small but statistically significant decrease in retinyl oleate (p = 0.049), which was in the opposite direction of the change seen in alcohol-fed mice. Thus, the changes observed in the fatty acyl composition of hepatic REs were alcohol-dependent.
Fig. 5.
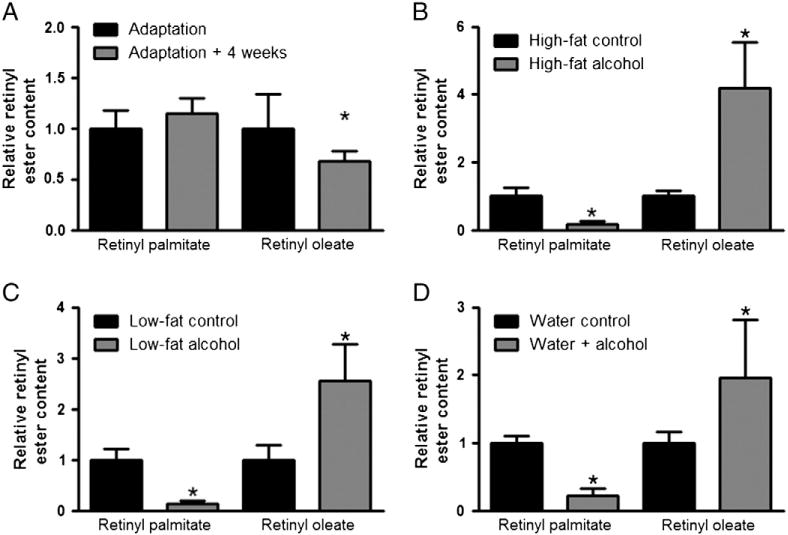
Altered fatty acyl composition of retinyl ester is observed using multiple protocols for chronic alcohol feeding. The relative retinyl ester content for hepatic retinyl palmitate and retinyl oleate is shown in all panels. Chronic consumption of the high-fat formulation of the alcohol-free Lieber–DeCarli liquid diet was not associated with a decrease in hepatic retinyl palmitate or increased retinyl oleate levels (A). However, chronic consumption of the high-fat formulation of the alcohol-containing Lieber–DeCarli liquid diet was associated with a significant decline in hepatic retinyl palmitate levels, with a corresponding increase in retinyl oleate (B). A significant decline in hepatic retinyl palmitate levels and an increase in retinyl oleate was also observed in mice consuming the alcohol-containing low-fat formulation of the Lieber–DeCarli diet (C), as well as in those mice provided with alcohol in their drinking water (D). Data analyzed by Student’s t-test; * p < 0.05 versus control.
While the above data were obtained from mice fed the high-fat formulation of the Lieber–DeCarli liquid diet (35% of calories from fat), we also analyzed hepatic REs in mice fed with the low-fat formulation of the Lieber–DeCarli liquid diet (8% of calories from fat) for 6 weeks. As was found in mice fed with the alcohol-containing high-fat liquid diet (Fig. 5B), mice fed with the low-fat liquid diet had significantly reduced levels of total hepatic RE, and most importantly, there was also a relative change in the fatty acyl composition of these hepatic REs, such that retinyl palmitate was significantly decreased and retinyl oleate increased (Fig. 5C). We also obtained liver samples from chow-fed mice provided with alcohol in their drinking water for 12 weeks [24]. Consistent with our observations in mice fed with the low- and high-fat alcohol-containing liquid diets, these animals had a relative decrease in hepatic retinyl palmitate, mirrored by a relative increase in retinyl oleate (Fig. 5D).
3.8. Alcohol feeding significantly alters the fatty acyl composition of hepatic phosphatidylcholine, but not Gpat expression
Since we were unable to establish that changes in hepatic enzyme activities or dietary fatty acyl composition were responsible for the alcohol-induced changes in hepatic RE composition, we assessed whether a change in fatty acyl composition of hepatic PC, which provides the fatty acyl substrate for RE synthesis by LRAT, might be responsible for this observation. To test this possibility, hepatic PC levels and compositions were determined using LC/MS/MS. Our data shows that total PC levels are significantly elevated in the livers of alcohol-fed mice (Fig. 6A). The basis for this increase was higher levels of multiple composite PC species; specifically, 12 of the 20 PC species we quantified were found at significantly higher levels in alcohol-fed mice. The effect of alcohol-feeding on PC species was categorized according to their abundance and graphed as major (Fig. 6B; >1.0 nmol/g), minor (Fig. 6C; 1 to 0.05 nmol/g), and low abundance PCs (Fig. 6D; <0.05 nmol/g). For the major PC species, we observed statistically significant increases in the levels of 34:2, 36:2 and 38:4 PC. For the minor PC species, we observed significant increases in 34:3, 36:5, 36:3, and 38:3 PC, while there was a significant decline in the levels of 32:0 and 40:8 PC. For the low abundance PCs, 32:2, 36:6, 38:7, 38:1 and 38:0 PC were all significantly increased.
Fig. 6.
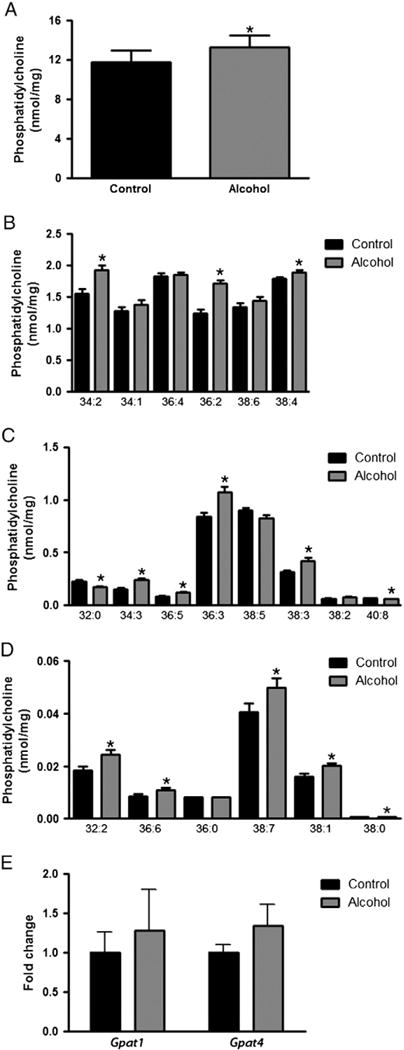
Hepatic phosphatidylcholine levels and GPAT expression in control and alcohol-fed mice. The total hepatic PC level in control and alcohol-fed mice is shown (A). Composite PC species were further categorized according to their relative abundance and graphed as major (B; > 1.0 nmol/g), minor (C; 1 to 0.05 nmol/g), and low abundance PCs (D; < 0.05 nmol/g). The mRNA expression level of Gpat1 and Gpat4, relative to the reference gene 18S, was also measured in control and alcohol-fed mice (E). Data analyzed by Student’s t-test; * p < 0.05 versus control.
As described above, alcohol consumption induced a significant decline in hepatic retinyl palmitate levels. It is known that LRAT transfers the fatty acyl moiety present at the sn-1 position of PC to retinol to synthesize RE [9–11], and that the sn-1 acyl identity of PC is established by glycerol-3-phosphate acyltransferases (GPATs). Furthermore, GPAT1 has a physiological preference for palmitoyl-CoA as a substrate, suggesting that its expression may have been affected by alcohol feeding [32]. Accordingly, we determined whether the expression level of hepatic GPATs (i.e. Gpat1-4) undergo alcohol-induced changes. Amplification of Gpat2 and Gpat3 occurred late in the qPCR cycling protocol, thus these genes were considered to have extremely low expression in the liver and were not statistically analyzed, although it was apparent that they were not changed by alcohol feeding (data not shown). We also found that the expression levels of Gpat1 and Gpat4, which were abundantly expressed in the liver, were not significantly altered in alcohol-fed vs. control mice (Fig. 6E). Thus, differences in hepatic GPAT mRNA expression were not directly responsible for the differences in hepatic RE and PC acyl compositions observed upon alcohol feeding.
4. Discussion
This is the first study to provide a quantitative analysis of RE concentration and fatty acyl composition at multiple time points in alcohol-fed mice. Although an alcohol-induced drop in total hepatic RE is well established [7], and relative changes in RE composition have been reported after chronic alcohol-feeding [33], our data reveal a surprisingly dynamic change in the fatty acyl composition of RE, with dramatic decreases in levels of retinyl palmitate and increases in levels of retinyl oleate occurring during the short adaptation period to dietary alcohol. The reversibility of this change following withdrawal of alcohol from the diet and the absence of a change in mice chronically fed the control diet support the conclusion that this is an alcohol-dependent effect. Furthermore, this highly reproducible finding was independent of genetic background, dietary fat content and mode of alcohol consumption. Thus, we believe that our findings can be broadly applied to provide a general understanding of alcohol’s effects on hepatic retinoid homeostasis. Our findings raise several questions that will be considered below: Is the alcohol-induced change in hepatic RE fatty acyl composition essential for facilitating the alcohol-induced loss of hepatic retinoids? What is the molecular mechanism for the alcohol-induced change in RE acyl composition? And, is this change potentially useful as a biomarker of alcohol consumption and identifying the early stages of ALD?
With regard to a link between alcohol’s effect on hepatic RE fatty acyl composition and alcohol-induced depletion of hepatic retinoid stores, our data clearly show that alcohol consumption stimulates RE hydrolysis (as evidenced by the precipitous decline in retinyl palmitate), which is initially compensated for by increased RE synthesis (as evidenced by increased LRAT expression and retinyl oleate levels), thus maintaining total RE levels. Our temporal data indicate that there is an equilibrium maintained between RE hydrolysis and synthesis during the alcohol adaptation period and up to one week of consuming 6.4% alcohol. After this period, this balance is apparently disrupted and total hepatic RE levels decline. Whether the equilibrium becomes unbalanced by an increase in RE hydrolysis or a decrease in RE synthesis is not clear, although the decline in hepatic RE content occurs in parallel with a decline in hepatic retinol content (data not shown), suggesting that a lack of retinol substrate for RE synthesis may precipitate the drop in RE. We believe that the retinol liberated by the hydrolysis of stored RE is quickly re-esterified to RE (primarily as retinyl oleate) within HSCs, as opposed to hepatocytes. This conclusion is supported by previous work showing that RE levels do not increase in the parenchymal cell fraction (i.e. hepatocytes) of alcohol-fed rats [33]; however, continuing studies in our lab studying retinoid metabolism in isolated hepatocytes and HSCs from alcohol-fed mice will be aimed at providing a definitive answer to this question.
Our data indicate that alcohol consumption stimulates hydrolysis of hepatic RE stores. As noted above, the majority of hepatic RE is stored in HSCs; however, the molecular identity of a REH(s) activity primarily responsible for mobilizing HSC RE stores is not established in the literature [3, 5, 19, 20]. For example, while rat carboxylesterase Es10 (also known as Ces3 [34]) possesses REH activity and is found associated with HSC lipid droplets, it is downregulated during HSC activation [35]. This downregulation argues against the possibility that it is a physiologically relevant REH in HSCs. Adipose triglyceride lipase (ATGL) is also expressed in HSCs, but while this enzyme will hydrolyze triglyceride, it will not use RE as a substrate [36, 37]. Hormone sensitive lipase (HSL) possesses an avid REH activity and acts physiologically in hydrolyzing RE in adipocytes [37, 38]; however it is reportedly not expressed in HSCs [36], and Hsl−/− mice have normal hepatic RE levels [38]. Moreover, the biochemical literature on substrate specificities of known REHs indicates that none of these enzymes show a strong substrate preference for one RE fatty acyl species over another [19]. Hence, it seems unlikely to us that the shift in fatty acyl composition of hepatic RE is directly responsible for the alcohol-induced loss of hepatic retinoid. Rather, it is more likely that retinol produced upon hydrolysis of RE stores is being lost from the liver in quantitatively greater amounts from livers chronically exposed to alcohol.
A corollary to the alcohol-induced decline in hepatic retinoids is an increase in extra-hepatic tissues [4, 5]. Our data are in strong agreement with this concept. In contrast to the marked decrease in RE seen in the liver, lung and WAT RE levels were significantly higher in alcohol-fed mice. Similarly, retinyl palmitate, oleate and linoleate levels were all increased in the lung and WAT of alcohol-fed mice, and the relative distributions of these RE species were unchanged in these tissues. Thus, alcohol consumption does not markedly affect the fatty acyl composition of RE in lung and WAT. Taken together, these data indicate that alcohol has a fundamentally different effect on RE fatty acyl composition in the liver, which is the primary organ of alcohol metabolism, than other major retinoid-storing tissues.
So, what is the molecular mechanism underlying the alcohol-induced change in hepatic RE acyl composition? This question was addressed in terms of enzymatic mediators and substrate availability. Initially, we hypothesized that alcohol consumption induced a change in hepatic enzymes involved in RE synthesis. Although LRAT is the sole enzyme responsible for hepatic RE synthesis, we wondered whether alcohol activated another enzyme(s) able to synthesize this product. DGAT1 has been shown to function as an ARAT, forming RE in skin and intestine [13, 14], and still other enzymes able to synthesize RE must exist, since Lrat−/−:Dgat1−/− double knockout mice still possess RE stores in adipose tissue [10]. However, we observed an alcohol-induced change in the fatty acyl composition of RE in Dgat1−/− mice, identical to that observed in wild-type mice, and subsequent experiments demonstrated that there were no detectable hepatic REs in alcohol-fed Lrat−/− mice. Thus, these data do not support the hypothesis that alcohol induced a previously unrecognized ARAT activity in the liver, and indicate that LRAT is responsible for the increased synthesis of retinyl oleate (and other usually minor RE species) in the livers of alcohol-fed mice. This conclusion is also consistent with the observed increase in LRAT protein expression levels in alcohol-fed mice.
The essential role of LRAT in synthesizing RE in the alcoholic liver pointed to the possibility that alcohol feeding must induce changes in the acyl composition of HSC PCs, which form the LRAT substrate pool. This would involve specific changes in the sn-1 position of PC, which LRAT preferentially uses for RE synthesis [9–11]. This hypothesis implies that alcohol-exposed HSCs experience a reduction in the relative abundance of palmitoyl groups in the sn-1 position of PC, and a relative increase in the abundance of oleoyl groups in the sn-1 position of PC. This shift would therefore account for the apparent switch from predominantly retinyl palmitate in control livers, to retinyl oleate in alcohol-exposed livers. Our LC/MS analysis of the fatty acyl composition of hepatic PC was unable to verify this hypothesis (data not shown); however, we believe that the changes in the fatty acyl composition may be specific to the LRAT substrate pool, i.e. HSCs, hence requiring the isolation and analysis of HSC microsomes from alcohol-fed mice. In support of our hypothesis, there are numerous studies which have found altered PC levels in alcohol exposed rodents [39–42]. Most salient to our study, Cunningham et al. reported that alcohol-fed rats had deceased levels of phospholipids containing palmitic acid (including PC), and increased levels of phospholipids which contain oleic acid [43]. In agreement with these published data, our LC/MS/MS analysis of the hepatic PC composition of control and alcohol-fed mice showed that concentrations of PC species with fully satura0ted acyl groups were either unchanged or significantly decreased in alcohol-fed mice, whereas concentrations of PC species possessing longer and unsaturated acyl groups were significantly elevated. Moreover, we recently reported that hepatic free fatty acid levels were increased in alcohol-fed mice, including significant increases in fatty acids with 18 carbon chain lengths (stearic, oleic, linoleic acids), but not 16 carbons (palmitic and palmitoleic acids) [23]. A similar pattern was seen for 18-carbon fatty acid ethyl esters, with alcohol-associated increases in the level of ethyl stearate, oleate and linoleate [23]. Interestingly, alcohol has been found to affect the levels of other phospholipids in addition to PC, including phosphatidylethanol, phosphatidylethanolamine, lyso-phosphatidylethanolamine, and lysophosphatidylcholine [39–42]; however, a systematic analysis of the individual fatty acyl composition of these phospholipids has not been performed and represents a significant scientific endeavor. As discussed below, the effect of alcohol on the fatty acyl composition of hepatic PC and other phospholipidsmay haveanimportant impactonthedevelopment of ALD.
As LRAT specifically transfers the sn-1 acyl moiety from PC to retinol and since the acyl moiety present in the sn-1 position of nascent PC is placed there through the actions of a hepatic GPAT, we also determined whether Gpat expression was altered in livers of alcohol-fed mice. However, we were unable to detect any differences in the levels of Gpat mRNA expression between control and alcohol-fed livers. Thus, we conclude that the metabolic event(s) responsible for the alcohol-induced change in RE acyl composition reflect a change in the PC substrate pool used by LRAT. While our data indicate that alcohol-induced changes in PC acyl composition reside upstream of GPAT, further research is required to fully understand this process. This research direction is particularly interesting because of previous studies linking altered phospholipid homeostasis in the liver and ALD; indeed there is an extensive literature describing the beneficial effects of feeding animals purified polyunsaturated PC in order to prevent the progression of ALD [44–46].
We have interpreted our data to indicate that alcohol stimulates RE hydrolysis, which is initially compensated for by an increase in LRAT-mediated RE synthesis. In addition to the PC substrate which provides the acyl moiety for RE synthesis, we were also interested in assessing the importance of dietary retinol as a substrate for RE synthesis in alcohol consuming mice. Interestingly, mice fed a VAD diet and alcohol synthesized equal quantities of retinyl oleate as their VAS-alcohol-fed counterparts. Thus, the absence of dietary retinol did not affect the balance between RE synthesis and hydrolysis observed in alcohol-fed mice, nor specifically the synthesis of retinyl oleate.Wetake thistoindicate that the observed change in REacyl composition involves retinoids which are already present in the hepatic ret-inoid storage pool. Collectively, these data support a model in which alcohol stimulates a futile cycle of RE hydrolysis and re-esterification soon after the initiation of alcohol consumption. While this is a novel concept for understanding hepatic retinoid storage and metabolism, a futile cycle of triglyceride/fatty acid recycling is well established [47]. Here, diglycerides and fatty acids liberated upon triglyceride hydrolysis are re-esterified back into triglyceride; indeed, the biochemistry of this triglyceride/fatty acid cycle is relatively well understood, involving coordinated actions of ATGL and diacylglycerol transferase 2 (DGAT2) [48]. Thus there is precedence in the literature regarding the futile cycling of lipid hydrolysis and synthesis.
We have described a change in the hepatic acyl composition of RE in alcohol-fed mice that occurs early in our alcohol-feeding protocol, which is also reflected in serum measures of RE, leading us to speculate on whether this change could be useful as a biomarker of alcohol consumption and the early development of ALD? While all of our observations were made in mice, we found one intriguing study from human patients with ALD that supports this proposition. Bell et al. reported that patients with alcoholic fatty liver have lower levels of hepatic retinoids as compared to patients with non-alcoholic fatty liver disease, and most significantly, the alcoholic patients were found to have relatively higher levels of retinyl oleate in their livers [49]. Thus, there is precedent within the literature to suggest that the fatty acyl composition of RE is changed in humans consuming alcohol, and that this change may prove to be a useful biomarker of alcohol consumption and ALD. While further research is required to understand this possibility, we suggest that it will be worthwhile to undertake investigations to determine whether hepatic or serum RE acyl compositions have predictive value for assessing early alcohol-induced changes in hepatic metabolism and health.
In summary, we have investigated the effect that alcohol has on hepatic RE stores, and report a previously uncharacterized change in the fatty acyl composition of hepatic RE. Interestingly, this shift is a sensitive indicator of alcohol consumption that occurs prior to an appreciable drop in total RE levels. We interpret our data to indicate that alcohol stimulates RE hydrolysis in the liver, with a compensatory increase in RE synthesis. This creates a futile cycle of RE hydrolysis and synthesis, which in the face of continued alcohol consumption shifts the equilibrium to favor RE hydrolysis, thus precipitating a significant decline in hepatic RE levels. We hypothesize that the changes in hepatic RE fatty acyl composition reflect an underlying change in the fatty acyl composition of PC, with pathogenic implications for the progression of ALD.
Acknowledgments
These studies were supported by grants RC2 AA019413 (WSB), R01 DK068437 (WSB), R01 DK079221 (WSB), R21 AA021336 (WSB), R01 HL45095 (IJG), R01 DK52401 (PDB) and R21 AA020561 (LSH) from the US Public Health Services, National Institutes of Health.
Abbreviations
- ARAT
Acyl:CoA retinol acyltransferase
- ALD
alcoholic liver disease
- GPAT
glycerol-3-phosphate acyltransferase
- LRAT
lecithin:retinol acyltransferase
- PC
phosphatidylcholine
- RE
retinyl ester
- VAD
vitamin A-deficient
- VAS
vitamin A-sufficient
- WAT
white adipose tissue
References
- 1.Gudas LJ, Sporn MB, Roberts AB. Cellular biology and biochemistry of the retinoids. In: Sporn MB, Roberts AB, Goodman DS, editors. The Retinoids: Biology, Chemistry, and Medicine. Raven Press; New York: 1994. pp. 445–520. [Google Scholar]
- 2.Wald G. Molecular basis of visual excitation. Science. 1968;162:230–239. doi: 10.1126/science.162.3850.230. [DOI] [PubMed] [Google Scholar]
- 3.D’Ambrosio DN, Clugston RD, Blaner WS. Vitamin A metabolism: an update. Nutrients. 2011;3:63–103. doi: 10.3390/nu3010063. [DOI] [PMC free article] [PubMed] [Google Scholar]
- 4.Balmer JE, Blomhoff R. Gene expression regulation by retinoic acid. J Lipid Res. 2002;43:1773–1808. doi: 10.1194/jlr.r100015-jlr200. [DOI] [PubMed] [Google Scholar]
- 5.Blaner WS, O’Byrne SM, Wongsiriroj N, Kluwe J, D’Ambrosio DM, Jiang H, Schwabe RF, Hillman EM, Piantedosi R, Libien J. Hepatic stellate cell lipid droplets: a specialized lipid droplet for retinoid storage. Biochim Biophys Acta. 2009;1791:467–473. doi: 10.1016/j.bbalip.2008.11.001. [DOI] [PMC free article] [PubMed] [Google Scholar]
- 6.Shirakami Y, Lee SA, Clugston RD, Blaner WS. Hepatic metabolism of retinoids and disease associations. Biochim Biophys Acta. 2012;1821:124–136. doi: 10.1016/j.bbalip.2011.06.023. [DOI] [PMC free article] [PubMed] [Google Scholar]
- 7.Clugston RD, Blaner WS. The adverse effects of alcohol on vitamin a metabolism. Nutrients. 2012;4:356–371. doi: 10.3390/nu4050356. [DOI] [PMC free article] [PubMed] [Google Scholar]
- 8.Leo MA, Lieber CS. Hepatic vitamin A depletion in alcoholic liver injury. N Engl J Med. 1982;307:597–601. doi: 10.1056/NEJM198209023071006. [DOI] [PubMed] [Google Scholar]
- 9.MacDonald PN, Ong DE. A lecithin:retinol acyltransferase activity in human and rat liver, Biochem. Biophys Res Commun. 1988;156:157–163. doi: 10.1016/s0006-291x(88)80818-0. [DOI] [PubMed] [Google Scholar]
- 10.Barry RJ, Canada FJ, Rando RR. Solubilization and partial purification of retinyl ester synthetase and retinoid isomerase from bovine ocular pigment epithelium. J Biol Chem. 1989;264:9231–9238. [PubMed] [Google Scholar]
- 11.Saari JC, Bredberg DL. Lecithin:retinol acyltransferase in retinal pigment epithelial microsomes. J Biol Chem. 1989;264:8636–8640. [PubMed] [Google Scholar]
- 12.Helgerud P, Petersen LB, Norum KR. Retinol esterification by microsomes from the mucosa of human small intestine. Evidence for acyl-coenzyme A retinol acyltransferase activity. J Clin Invest. 1983;71:747–753. doi: 10.1172/JCI110822. [DOI] [PMC free article] [PubMed] [Google Scholar]
- 13.Wongsiriroj N, Piantedosi R, Palczewski K, Goldberg IJ, Johnston TP, Li E, Blaner WS. The molecular basis of retinoid absorption: a genetic dissection. J Biol Chem. 2008;283:13510–13519. doi: 10.1074/jbc.M800777200. [DOI] [PMC free article] [PubMed] [Google Scholar]
- 14.Shih MY, Kane MA, Zhou P, Yen CL, Streeper RS, Napoli JL, Farese RV., Jr Retinol esterification by DGAT1 is essential for retinoid homeostasis in murine skin. J Biol Chem. 2009;284:4292–4299. doi: 10.1074/jbc.M807503200. [DOI] [PMC free article] [PubMed] [Google Scholar]
- 15.Rasmussen M, Helgerud P, Petersen LB, Norum KR. Microsomal esterification of retinol in human liver. Acta Med Scand. 1984;216:403–407. doi: 10.1111/j.0954-6820.1984.tb03824.x. [DOI] [PubMed] [Google Scholar]
- 16.Batten ML, Imanishi Y, Maeda T, Tu DC, Moise AR, Bronson D, Possin D, Van Gelder RN, Baehr W, Palczewski K. Lecithin–retinol acyltransferase is essential for accumulation of all-trans-retinyl esters in the eye and in the liver. J Biol Chem. 2004;279:10422–10432. doi: 10.1074/jbc.M312410200. [DOI] [PMC free article] [PubMed] [Google Scholar]
- 17.O’Byrne SM, Wongsiriroj N, Libien J, Vogel S, Goldberg IJ, Baehr W, Palczewski K, Blaner WS. Retinoid absorption and storage is impaired in mice lacking lecithin: retinol acyltransferase (LRAT) J Biol Chem. 2005;280:35647–35657. doi: 10.1074/jbc.M507924200. [DOI] [PMC free article] [PubMed] [Google Scholar]
- 18.Liu L, Gudas LJ. Disruption of the lecithin:retinol acyltransferase gene makes mice more susceptible to vitamin A deficiency. J Biol Chem. 2005;280:40226–40234. doi: 10.1074/jbc.M509643200. [DOI] [PubMed] [Google Scholar]
- 19.Harrison EH. Enzymes catalyzing the hydrolysis of retinyl esters. Biochim Biophys Acta. 1993;1170:99–108. doi: 10.1016/0005-2760(93)90058-h. [DOI] [PubMed] [Google Scholar]
- 20.Schreiber R, Taschler U, Preiss-Landl K, Wongsiriroj N, Zimmermann R, Lass A. Retinyl ester hydrolases and their roles in vitamin A homeostasis, Biochim. Biophys Acta. 2012;1821:113–123. doi: 10.1016/j.bbalip.2011.05.001. [DOI] [PMC free article] [PubMed] [Google Scholar]
- 21.Smith SJ, Cases S, Jensen DR, Chen HC, Sande E, Tow B, Sanan DA, Raber J, Eckel RH, Farese RV., Jr Obesity resistance and multiple mechanisms of triglyceride synthesis in mice lacking Dgat. Nat Genet. 2000;25:87–90. doi: 10.1038/75651. [DOI] [PubMed] [Google Scholar]
- 22.de la P, Hall M, Lieber CS, DeCarli LM, French SW, Lindros KO, Jarvelainen H, Bode C, Parlesak A, Bode JC. Models of alcoholic liver disease in rodents: a critical evaluation, Alcohol. Clin Exp Res. 2001;25:254S–261S. doi: 10.1097/00000374-200105051-00041. [DOI] [PubMed] [Google Scholar]
- 23.Clugston RD, Jiang H, Lee MX, Piantedosi R, Yuen JJ, Ramakrishnan R, Lewis MJ, Gottesman ME, Huang LS, Goldberg IJ, Berk PD, Blaner WS. Altered hepatic lipid metabolism in C57BL/6 mice fed alcohol: A targeted lipidomic and gene expression study. J Lipid Res. 2011;52:2021–2031. doi: 10.1194/jlr.M017368. [DOI] [PMC free article] [PubMed] [Google Scholar]
- 24.Ge F, Zhou S, Hu C, Lobdell Ht, Berk PD. Insulin- and leptin-regulated fatty acid uptake plays a key causal role in hepatic steatosis in mice with intact leptin signaling but not in ob/ob or db/db mice. Am J Physiol Gastrointest Liver Physiol. 2010;299:G855–G866. doi: 10.1152/ajpgi.00434.2009. [DOI] [PMC free article] [PubMed] [Google Scholar]
- 25.Lieber CS, DeCarli LM. Liquid diet technique of ethanol administration: 1989 update, Alcohol. Alcohol. 1989;24:197–211. [PubMed] [Google Scholar]
- 26.Kim YK, Quadro L. Reverse-phase high-performance liquid chromatography (HPLC) analysis of retinol and retinyl esters in mouse serum and tissues. Methods Mol Biol. 2010;652:263–275. doi: 10.1007/978-1-60327-325-1_15. [DOI] [PMC free article] [PubMed] [Google Scholar]
- 27.D’Ambrosio DN, Walewski JL, Clugston RD, Berk PD, Rippe RA, Blaner WS. Distinct populations of hepatic stellate cells in the mouse liver have different capacities for retinoid and lipid storage. PLoS One. 2011;6:e24993. doi: 10.1371/journal.pone.0024993. [DOI] [PMC free article] [PubMed] [Google Scholar]
- 28.Schneider CA, Rasband WS, Eliceiri KW. NIH Image to ImageJ: 25 years of image analysis. Nat Methods. 2012;9:671–675. doi: 10.1038/nmeth.2089. [DOI] [PMC free article] [PubMed] [Google Scholar]
- 29.Nagy NE, Holven KB, Roos N, Senoo H, Kojima N, Norum KR, Blomhoff R. Storage of vitamin A in extrahepatic stellate cells in normal rats. J Lipid Res. 1997;38:645–658. [PubMed] [Google Scholar]
- 30.Zolfaghari R, Ross AC. Lecithin:retinol acyltransferase expression is regulated by dietary vitamin A and exogenous retinoic acid in the lung of adult rats. J Nutr. 2002;132:1160–1164. doi: 10.1093/jn/132.6.1160. [DOI] [PubMed] [Google Scholar]
- 31.Senoo H, Kojima N, Sato M. Vitamin A-storing cells (stellate cells) Vitam Horm. 2007;75:131–159. doi: 10.1016/S0083-6729(06)75006-3. [DOI] [PubMed] [Google Scholar]
- 32.Takeuchi K, Reue K. Biochemistry, physiology, and genetics of GPAT, AGPAT, and lipin enzymes in triglyceride synthesis. Am J Physiol Endocrinol Metab. 2009;296:E1195–E1209. doi: 10.1152/ajpendo.90958.2008. [DOI] [PMC free article] [PubMed] [Google Scholar]
- 33.Rasmussen M, Blomhoff R, Helgerud P, Solberg LA, Berg T, Norum KR. Retinol and retinyl esters in parenchymal and nonparenchymal rat liver cell fractions after long-term administration of ethanol. J Lipid Res. 1985;26:1112–1119. [PubMed] [Google Scholar]
- 34.Holmes RS, Wright MW, Laulederkind SJ, Cox LA, Hosokawa M, Imai T, Ishibashi S, Lehner R, Miyazaki M, Perkins EJ, Potter PM, Redinbo MR, Robert J, Satoh T, Yamashita T, Yan B, Yokoi T, Zechner R, Maltais LJ. Recommended nomenclature for five mammalian carboxylesterase gene families: human, mouse, and rat genes and proteins. Mamm Genome. 2010;21:427–441. doi: 10.1007/s00335-010-9284-4. [DOI] [PMC free article] [PubMed] [Google Scholar]
- 35.Kristensen DB, Kawada N, Imamura K, Miyamoto Y, Tateno C, Seki S, Kuroki T, Yoshizato K. Proteome analysis of rat hepatic stellate cells. Hepatology. 2000;32:268–277. doi: 10.1053/jhep.2000.9322. [DOI] [PubMed] [Google Scholar]
- 36.Mello T, Nakatsuka A, Fears S, Davis W, Tsukamoto H, Bosron WF, Sanghani SP. Expression of carboxylesterase and lipase genes in rat liver cell-types. Biochem Biophys Res Commun. 2008;374:460–464. doi: 10.1016/j.bbrc.2008.07.024. [DOI] [PMC free article] [PubMed] [Google Scholar]
- 37.Zimmermann R, Strauss JG, Haemmerle G, Schoiswohl G, Birner-Gruenberger R, Riederer M, Lass A, Neuberger G, Eisenhaber F, Hermetter A, Zechner R. Fat mobilization in adipose tissue is promoted by adipose triglyceride lipase. Science. 2004;306:1383–1386. doi: 10.1126/science.1100747. [DOI] [PubMed] [Google Scholar]
- 38.Strom K, Gundersen TE, Hansson O, Lucas S, Fernandez C, Blomhoff R, Holm C. Hormone-sensitive lipase (HSL) is also a retinyl ester hydrolase: evidence from mice lacking HSL. FASEB J. 2009;23:2307–2316. doi: 10.1096/fj.08-120923. [DOI] [PubMed] [Google Scholar]
- 39.Loftus N, Barnes A, Ashton S, Michopoulos F, Theodoridis G, Wilson I, Ji C, Kaplowitz N. Metabonomic investigation of liver profiles of nonpolar metabolites obtained from alcohol-dosed rats and mice using high mass accuracy MSn analysis. J Proteome Res. 2011;10:705–713. doi: 10.1021/pr100885w. [DOI] [PMC free article] [PubMed] [Google Scholar]
- 40.Zhao Z, Yu M, Crabb D, Xu Y, Liangpunsakul S. Ethanol-induced alterations in fatty acid-related lipids in serum and tissues in mice. Alcohol Clin Exp Res. 2011;35:229–234. doi: 10.1111/j.1530-0277.2010.01338.x. [DOI] [PMC free article] [PubMed] [Google Scholar]
- 41.Zivkovic AM, Bruce German J, Esfandiari F, Halsted CH. Quantitative lipid metabolomic changes in alcoholic micropigs with fatty liver disease, Alcohol. Clin Exp Res. 2009;33:751–758. doi: 10.1111/j.1530-0277.2008.00892.x. [DOI] [PMC free article] [PubMed] [Google Scholar]
- 42.Fernando H, Kondraganti S, Bhopale KK, Volk DE, Neerathilingam M, Kaphalia BS, Luxon BA, Boor PJ, Shakeel Ansari GA. (1)H and (3)(1)P NMR lipidome of ethanol-induced fatty liver. Alcohol Clin Exp Res. 2010;34:1937–1947. doi: 10.1111/j.1530-0277.2010.01283.x. [DOI] [PMC free article] [PubMed] [Google Scholar]
- 43.Cunningham CC, Filus S, Bottenus RE, Spach PI. Effect of ethanol consumption on the phospholipid composition of rat liver microsomes and mitochondria. Biochim Biophys Acta. 1982;712:225–233. doi: 10.1016/0005-2760(82)90338-1. [DOI] [PubMed] [Google Scholar]
- 44.Lieber CS, Robins SJ, Li J, DeCarli LM, Mak KM, Fasulo JM, Leo MA. Phosphatidylcholine protects against fibrosis and cirrhosis in the baboon. Gastroenterology. 1994;106:152–159. doi: 10.1016/s0016-5085(94)95023-7. [DOI] [PubMed] [Google Scholar]
- 45.Navder KP, Baraona E, Lieber CS. Polyenylphosphatidylcholine attenuates alcohol-induced fatty liver and hyperlipemia in rats. J Nutr. 1997;127:1800–1806. doi: 10.1093/jn/127.9.1800. [DOI] [PubMed] [Google Scholar]
- 46.Aleynik SI, Leo MA, Aleynik MK, Lieber CS. Polyenylphosphatidylcholine protects against alcohol but not iron-induced oxidative stress in the liver. Alcohol Clin Exp Res. 2000;24:196–206. [PubMed] [Google Scholar]
- 47.Reshef L, Olswang Y, Cassuto H, Blum B, Croniger CM, Kalhan SC, Tilghman SM, Hanson RW. Glyceroneogenesis and the triglyceride/fatty acid cycle. J Biol Chem. 2003;278:30413–30416. doi: 10.1074/jbc.R300017200. [DOI] [PubMed] [Google Scholar]
- 48.Eichmann TO, Kumari M, Haas JT, Farese RV, Jr, Zimmermann R, Lass A, Zechner R. Studies on the substrate and stereo/regioselectivity of adipose triglyceride lipase, hormone-sensitive lipase, and diacylglycerol-O-acyltransferases. J Biol Chem. 2012;287:41446–41457. doi: 10.1074/jbc.M112.400416. [DOI] [PMC free article] [PubMed] [Google Scholar]
- 49.Bell H, Nilsson A, Norum KR, Pedersen LB, Raknerud N, Rasmussen M. Retinol and retinyl esters in patients with alcoholic liver disease. J Hepatol. 1989;8:26–31. doi: 10.1016/0168-8278(89)90158-x. [DOI] [PubMed] [Google Scholar]