

Abstract
The tensile and compressive properties of human glenohumeral cartilage were determined by testing 120 rectangular strips in uniaxial tension and 70 cylindrical plugs in confined compression, obtained from five human glenohumeral joints. Specimens were harvested from five regions across the articular surface of the humeral head and two regions on the glenoid. Tensile strips were obtained along two orientations, parallel and perpendicular to the split-line directions. Two serial slices through the thickness, corresponding to the superficial and middle zones of the cartilage layers, were prepared from each tensile strip and each compressive plug. The equilibrium tensile modulus and compressive aggregate modulus of cartilage were determined from the uniaxial tensile and confined compression tests, respectively. Significant differences in the tensile moduli were found with depth and orientation relative to the local split line direction. Articular cartilage of the humeral head was significantly stiffer in tension than that of the glenoid. There were significant differences in the aggregate compressive moduli of articular cartilage between superficial and middle zones in the humeral head. Furthermore, tensile and compressive stress-strain responses exhibited nonlinearity under finite strain while the tensile modulus differed by up to two orders of magnitude from the compressive aggregate modulus at 0% strain, demonstrating a high degree of tension-compression nonlinearity. The complexity of the mechanical properties of human glenohumeral cartilage was exposed in this study, showing anisotropy, inhomogeneity, and tension-compression nonlinearity within the same joint. The observed differences in the tensile properties of human glenohumeral cartilage suggest that the glenoid may be more susceptible to cartilage degeneration than the humeral head.
Keywords: articular cartilage, glenohumeral joint, mechanical properties, inhomogeneity, anisotropy, tension-compression nonlinearity
INTRODUCTION
Osteoarthritis (OA) is a degenerative disease of diarthrodial joints which usually begins with focal surface lesions on articular cartilage, and is accompanied by degradation of the tissue material properties. Previous studies of OA in the glenohumeral joint (GHJ) have indicated that cartilage lesions usually initiate on the glenoid and are often located in the central region (DePalma et al., 1950; Neer, 1961; Neer et al., 1982). Focal areas of GHJ cartilage degeneration have been observed to develop at the articular contact region when the arm elevation is between 60° and 100° (Neer, 1974), where maximal joint forces of 44% to 90% of body weight may occur according to theoretical predictions (Van der Helm, 1994), and anatomic measurements during static (Poppen and Walker, 1978) or dynamic (Apreleva et al., 2000) abduction. Conzen and Eckstein (2000) measured GHJ articular contact pressure and found that the maximum pressure of 5.1 MPa was recorded at the 90° of abduction with 90° external rotation. Furthermore, the surface area disparity (1:3 surface area ratio) between the glenoid and humeral head results in substantial differences in the duration of loading (duty cycle), with the glenoid cartilage subjected to a greater duty cycle during daily joint function (Soslowsky et al., 1992a). Thus it has been hypothesized that degenerative changes are due to more frequent high contact stresses acting on the glenoid cartilage.
With the progress made in the determination of GHJ contact area (Soslowsky et al., 1992b) and constitutive relations for characterizing the mechanical behavior of articular cartilage (Cohen et al., 1998; Fortin et al., 2000; Huang et al., 2001; Li et al., 2000; Mow et al., 1980; Soltz and Ateshian, 2000; Soulhat et al., 1999; Wang et al., 2001), as well as the implementation of finite element contact analyses (Donzelli et al., 1999), it remains necessary to obtain the material properties of glenohumeral cartilage for the determination of the state of stress within the articular layers during contact, and to investigate the potential disparity between properties of the humeral head and glenoid.
Experimental studies have demonstrated that the mechanical response of articular cartilage may vary as a function of duration and rate of loading or deformation (i.e. viscoelasticity) (Kempson et al., 1971; Mow et al., 1980; Setton et al., 1993; Woo et al., 1980); the tensile stiffness of articular cartilage differs when testing the tissue parallel and perpendicular to the split line directions (i.e. anisotropy) (Kempson et al., 1973; Roth and Mow, 1980; Woo et al., 1976, 1979); the measured properties in tension or compression may vary from the superficial to the deep zone of cartilage or among regions of a given articular surface (i.e. inhomogeneity) (Akizuki et al. 1986; Kempson et al., 1971; Roth and Mow, 1980; Schinagl et al., 1997; Woo et al., 1979, 1980); the material properties of articular cartilage may differ between two mating articular surfaces (Froimson et al., 1997). Furthermore, material properties of cartilage measured from various joints of different species have also indicated that the stiffness of cartilage in compression may be one to two orders of magnitude smaller than in tension (i.e. tension-compression nonlinearity). The depth dependence and tension-compression nonlinearity of cartilage material properties has been shown to significantly influence the mechanical behavior of the tissue in recent analyses (Cohen et al., 1998; Fortin et al., 2000; Huang et al., 2001, 2003; Li et al., 2000; Soltz and Ateshian, 2000; Soulhat et al., 1999; Wang et al., 2001).
The complex material properties of articular cartilage have been recognized in the literature. However, no single study has investigated the wide range of mechanical properties within cartilage from the same joint of a given species; this has prevented a direct confirmation that the wide spectrum of material properties observed in previous studies is due to the intrinsic complexity of the tissue rather than interspecies or joint-specific variations. Furthermore, since finite element analyses can accommodate complex material behavior and precise joint anatomy, an extensive set of cartilage material properties is essential for such analyses in the effort to accurately assess the state of stress within articular cartilage of a given joint. Therefore, the objective of the current study was to extensively assess the mechanical properties of human GHJ cartilage to provide the most detailed measurements to date of such properties from this joint. These measurements can serve to advance our understanding of GHJ biomechanics and, in the longer term, the pathomechanics of OA in this joint.
MATERIALS AND METHODS
One hundred and twenty rectangular strips and seventy cylindrical plugs were prepared from five fresh-frozen human GHJs (average age 57, range 51-66, 3 males, 2 females). Upon dissection, these joints exhibited no visual evidence of OA. For each joint, seven full-thickness compressive plugs (6.36 mm in diameter) were harvested from five regions on the humeral head and two regions on the glenoid (Figure 1). Twelve full-thickness rectangular tensile strips (4 mm × 9 mm) were obtained in two orientations, parallel and perpendicular to the split-line directions, from each of the regions of the humeral head and the glenoid (Figure 1). The overall pattern of split lines was determined on two extra GHJs using the technique described in previous studies (Hultkrantz, 1898; Woo et al., 1976) and the split line pattern outside the harvest site was also examined individually for each specimen. Two serial slices (250 μm thick for tensile testing and 350 μm thick for compressive testing), corresponding to the superficial and middle zones of the cartilage layers, were obtained from each tensile strip and each compressive plug using a freezing stage sledge microtome. All specimens were stored in physiological saline solution and kept frozen at −80°C until the day of testing. Since recent studies have shown that the collagen network of meniscal cartilage and the biomechanical response of intervertebral disc remain unchanged after frozen storage (Gleizes et al., 1998; Salai et al., 1997), the effects of freezing were assumed to be minimal in this study.
Figure 1.

(a) Typical pattern of split lines and (b) harvest sites of tensile strips and compressive plugs on the humeral head and glenoid. (S: superior, I: inferior, A: anterior, P: posterior)
Tensile testing
Preparation and dimensional measurements of each tensile testing specimen were performed using a previously reported method (Akizuki et al., 1986). Tensile specimens were trimmed down to the typical dimensions of 250 μm thick, 1.5 mm wide, and 8 mm long. To avoid slippage during tensile testing, sandpaper (400 grid) were affixed to both ends of the specimen with a very small amount of Permabond Industrial Grade 240 plastic bonding adhesive. Typically, the length of the specimen held in the sandpaper was 1.5 mm on each side, and the initial grip-to-grip length of the specimen was 5 mm. Each tensile specimen was mounted in an Automated Tensile Apparatus (Akizuki et al., 1986) and subjected to a tare load of 0.02 N for 1000 seconds. In the ensuing tensile stress-relaxation test, the specimen was stretched using an increasing sequence of step strains (ε1=change in length/ initial length= 2%, 4%, 6%, 8%, 10%, 12%, 14%, 16%, 20%, and 25%), and held for 20 minutes at each strain increment (Figure 2). The amount of stretch was predetermined by a micrometer (Oriel Instruments, Stratford, CT, 1 μm accuracy) while force was measured by a load cell (model 31, Sensotec, Columbus, OH, 0.01 N accuracy). The specimen was bathed in physiological saline solution with protease inhibitors (2mM Ethylenediamine tetra-acetic acid, 5mM Benzamidine, 10mM N-Ethylmaleimide, 1mM Phenylmethyl-sulfonyl fluoride) during testing. In addition, the measurements of Poisson’s ratio (ν) in the plane parallel to the articular surface were performed on specimens from four of the five joints. The lateral strains (ε2=change in width/ initial width) for each tensile strain level was measured at the center and quarter length from the fixed end using a video dimensional analyzer (VDA) (Woo et al., 1979), and ν was calculated (ν=−ε2/ε1). Poisson’s ratio was found to remain approximately constant within the range of 6% to 12% strain, hence for each specimen this study reports a single value of ν in tension, averaged from the results at 6%, 8%, 10%, and 12%, at both measuring locations.
Figure 2.

Schematic of the tensile testing protocol and the typical load response.
To assess the strain-dependent modulus of the tissue in tension, the equilibrium tensile stress σe achieved at equilibrium for each strain increment was curvefitted with the exponential function (Elliott et al., 1999; Woo et al., 1976),
| (1) |
In this equation, the parameters A and B represent material constants for this constitutive model. Since the load response of some specimens did not reach equilibrium within 20 minutes at higher strain levels (> 14%), the equilibrium load was extrapolated by curvefitting the experimental transient relaxation data using Eq.(2):
| (2) |
where t represents time during each loading step, and C2-C6 are stress-relaxation parameters, and C1 is the extrapolated equilibrium load. This empirical equation was found to produce successful fits of the transient data in all cases. The validity of this approach was verified using the response at lower strain levels, by comparing the equilibrium load extrapolated from half of the relaxation response with the actual equilibrium load achieved in the experiment. This was done on six specimens and the agreement was found to be 97.7±1.6%. The tensile modulus was obtained by differentiating the expression in Eq.(1) to produce a strain-dependent modulus, E = ABeBε. Since no failure of specimens was observed at or below 16%, the tensile modulus at 0% (E0=AB) and at 16% (E0.16=ABe0.16B) strain were determined as two representative measures of the strain-dependent modulus.
Confined compression testing
Each thawed cylindrical specimen was placed in a confined compression specimen chamber submerged in physiological saline with protease inhibitors, and loaded between two porous filters on a custom-designed testing apparatus (Ateshian et al., 1997). Before the stress-relaxation test, a pre-conditioning load of 4.9 N was applied to the plug for 60 sec to ensure proper specimen confinement, and removed, followed with a tare load of 0.2 N for 900 seconds (Ateshian et al., 1997). During the stress-relaxation test, the specimen was subjected to five sequential increments of ramp-and-hold surface displacements, achieving 10 % strain at each increment, at a displacement rate of 0.25 μm sec-1 (Figure 3). The load response was recorded for the calculation of the compressive stress. The strain-dependent compressive modulus was evaluated by fitting the following equation to the equilibrium stress-stretch response (Ateshian et al., 1997):
| (3) |
Figure 3.
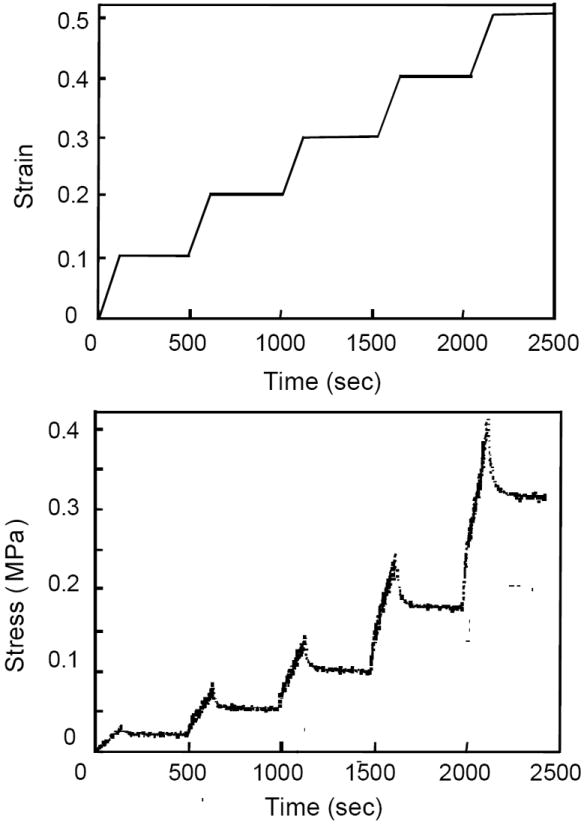
Schematic of the confined compression testing protocol and the typical load response.
In this equation, λ represents the stretch, and HA0 and β represent material constants. The compressive modulus HA is defined as:
| (4) |
The strain-dependent compressive modulus can be derived by differentiating Eq.(3) to produce the compressive aggregate modulus at any strain, including the representative values employed in this study at 0% strain (λ=1) which corresponds to HA0, and at 16% compressive strain (at λ=0.84, denoted by HA0.16). The choice of HA0.16 was motivated by analogy to the choice of the strain-dependent tensile modulus E0.16, even though no failure was observed in compression even up to 50% compressive strains.
Following the determination of HA0 and β, the transient stress-relaxation data were curvefitted to determine the permeability coefficients which appear in the strain-dependent permeability function, Eq.(5), proposed in the study of Holmes and Mow (1990):
| (5) |
where ϕ0 is the volume fraction of the solid phase at unity stretch (zero strain), k0 is the permeability of cartilage at zero strain, and M is the nonlinear permeability coefficient. In this study, ϕ0 was assumed to be equal to 0.2. The details of the curvefitting methodology have been described in a previous study (Ateshian et al., 1997).
Statistical analysis
The tensile and compressive moduli, Poisson’s ratio, and permeability were analyzed statistically using multi-way analyses of variance (ANOVA) when assessing the factors of region, orientation, and zone. In addition, a one-way ANOVA was used to investigate differences in properties between the glenoid and the humeral head. Significance was assumed for p<0.05. Statistical analyses were performed using SAS software (SAS Institute Inc.) on a personal computer.
RESULTS
E0 for the humeral head (4.23 ± 2.88 MPa) was found to be significantly greater than that for the glenoid (2.24 ± 2.93 MPa) (p<0.01) (Figure 4, the details of GHJ cartilage tensile properties were shown in Table 1). There were significant differences in the tensile modulus of the superficial and middle zone specimens at 0% (E0, p<0.01) and 16% (E0.16, p<0.01) for the humeral head, with the specimens from the superficial zone stiffer than those from the middle zone (Figure 5). Zonal differences were not significant in the glenoid (E0, p=0.17; E0.16, p=0.08). E0 and E0.16 of specimens taken parallel to the split lines were found to be significantly greater than those of the specimens taken perpendicular to the split lines in the humeral head (E0, p<0.01; E0.16, p<0.01) (Figure 6) and glenoid (E0, p=0.03; E0.16, p<0.01). However, no significant regional differences were found for either E0 (p=0.44) or E0.16 (p=0.37) in the humeral head.
Figure 4.

Significant differences in tensile modulus (E0) of cartilage between the glenoid and the humeral head, grouping all specimens of each surface.
Table 1.
Tensile properties of human glenohumeral cartilage for different regions, orientations, and zones.
| Parallel to split lines: | ||||||
|---|---|---|---|---|---|---|
| Zone | Region | A | B | E 0 | E 0.16 | |
| Humeral head | Superficial | Anterior | 0.896 ± 0.493 | 9.42 ± 1.30 | 8.22 ± 4.10 | 37.43 ± 19.23 |
| Center | 0.576 ± 0.209 | 7.06 ± 1.04 | 5.75 ± 2.46 | 28.87 ± 15.32 | ||
| Inferior | 0.614 ± 0.283 | 9.90 ± 2.67 | 5.77 ± 2.48 | 31.81 ± 19.75 | ||
| Posterior | 0.492 ± 0.313 | 11.93 ± 1.98 | 5.91 ± 3.85 | 42.76 ± 29.92 | ||
| Superior | 0.682 ± 0.327 | 10.39 ± 1.66 | 7.22 ± 3.78 | 41.79 ± 29.53 | ||
| Average | 0.652 ± 0.339 | 10.27 ± 1.89 | 6.57 ± 3.27 | 36.53 ± 22.16 | ||
| Middle | Anterior | 0.490 ±0.309 | 8.64 ± 1.23 | 4.19 ± 2.51 | 17.06 ± 10.59 | |
| Center | 0.290 ±0.259 | 9.02 ± 2.94 | 2.03 ±0.10 | 8.50 ± 4.32 | ||
| Inferior | 0.410 ± 0.156 | 8.59 ± 1.89 | 3.49 ± 1.33 | 14.99 ± 8.58 | ||
| Posterior | 0.484 ± 0.341 | 9.23 ± 1.87 | 4.21 ± 2.86 | 16.99 ± 12.81 | ||
| Superior | 0.438 ± 0.354 | 8.53 ± 2.20 | 3.84 ± 3.53 | 16.92 ± 16.74 | ||
| Average | 0.422 ± 0.277 | 8.80 ± 1.94 | 3.55 ± 2.37 | 14.89 ± 10.93 | ||
| Glenoid | Superficial | 0.454 ± 0.540 | 12.93 ± 2.21 | 5.11 ± 4.84 | 36.59 ± 59.38 | |
| Middle | 0.212 ± 0.102 | 9.04 ± 4.20 | 2.05 ± 1.42 | 13.69 ± 14.61 | ||
| Perpendicular to split lines: | ||||||
| Zone | Region | A | B | E 0 | E0.16 | |
| Humeral head | Superficial | Anterior | 0.646 ± 0.313 | 7.55 ± 1.26 | 5.02 ± 2.90 | 18.13 ± 12.88 |
| Center | 0.418 ± 0.212 | 9.38 ± 1.75 | 3.47 ± 1.71 | 16.49 ± 6.66 | ||
| Inferior | 0.574 ±0.340 | 8.66 ± 2.66 | 4.12 ± 2.10 | 17.81 ± 9.91 | ||
| Posterior | 0.548 ± 0.343 | 9.75 ±0.68 | 5.20 ± 2.87 | 24.15 ± 11.23 | ||
| Superior | 0.626 ± 0.342 | 7.15 ± 1.71 | 4.40 ± 2.74 | 15.18 ± 13.05 | ||
| Average | 0.562 ± 0.298 | 8.49 ± 1.90 | 4.55 ± 2.35 | 18.35 ± 10.52 | ||
| Middle | Anterior | 0.180 ± 0.088 | 8.70 ± 1.13 | 1.61 ± 0.97 | 6.95 ± 5.21 | |
| Center | 0.296 ± 0.246 | 7.26 ± 2.57 | 1.82 ± 1.03 | 5.87 ± 3.11 | ||
| Inferior | 0.360 ± 0.185 | 7.11 ± 1.79 | 2.65 ± 1.54 | 9.26 ± 6.43 | ||
| Posterior | 0.354 ± 0.262 | 8.70 ± 3.42 | 2.85 ± 1.71 | 13.11 ± 8.87 | ||
| Superior | 0.288 ± 0.259 | 8.15 ± 2.34 | 2.19 ± 1.70 | 8.35 ± 6.46 | ||
| Average | 0.296 ± 0.210 | 7.98 ± 2.28 | 2.24 ± 1.39 | 8.71 ± 6.30 | ||
| Glenoid | Superficial | 0.130 ± 0.090 | 8.73 ± 2.65 | 1.04 ± 0.57 | 4.64 ± 3.39 | |
| Middle | 0.140 ± 0.110 | 7.19 ± 2.82 | 0.77 ± 0.53 | 2.08 ± 1.18 | ||
Key: A, EA0, EA0.16: MPa, n = 5
Figure 5.

Significant differences in tensile moduli (E0 and E0.16) of cartilage specimens between superficial and middle zones of the humeral head, grouping all specimens on each zone.
Figure 6.

Significant differences in tensile moduli (E0 and E0.16) of cartilage specimens taken parallel and perpendicular to local split lines in the humeral head, for each orientation grouping all specimens from different zones and regions.
Significant differences were found in HA0.16 (p=0.02) (Figure 7) but not in HA0 (p=0.07) between the superficial and middle zones in the humeral head (the details of GHJ cartilage compressive properties were shown in Table 2). There were no significant regional differences in the compressive aggregate modulus either in the humeral head (p=0.68) or glenoid (p=0.63). Furthermore, no significant differences were found in the compressive aggregate modulus between the two joint surfaces (p=0.54 for HA0, p=0.07 for HA0.16) although the trend observed for HA0.16 indicated a higher compressive modulus in the glenoid (0.19±0.09 MPa versus 0.15±0.05 MPa).
Figure 7.

Significant differences in aggregate compressive modulus (HA0.16) of cartilage between superficial and middle zones of the humeral head, grouping all specimens on each zone.
Table 2.
Compressive properties of human glenohumeral cartilage for different regions and zones.
| Zone | Region | HA0 | HA 0.16 | β | |
|---|---|---|---|---|---|
| Humeral head | Superficial | Anteriorα | 0.110 ± 0.030 | 0.137 ± 0.040 | 1.38 ± 0.957 |
| Centerα | 0.083 ± 0.038 | 0.101 ± 0.039 | 1.22 ± 0.448 | ||
| Inferiorα | 0.139 ± 0.064 | 0.166 ± 0.075 | 1.07 ± 0.391 | ||
| Posteriorα | 0.094 ± 0.021 | 0.116 ± 0.027 | 1.31 ± 0.264 | ||
| Superiorα | 0.146 ± 0.029 | 0.175 ± 0.036 | 0.779 ± 0.166 | ||
| Average | 0.116 ± 0.043 | 0.141 ± 0.051 | 1.15 ± 0.527 | ||
| Middle | Anteriorε | 0.117 ± 0.056 | 0.169 ± 0.053 | 1.13 ± 0.634 | |
| Centerε | 0.190 ± 0.047 | 0.226 ±0.053 | 0.676 ± 0.174 | ||
| Inferiorε | 0.132 ± 0.036 | 0.158 ± 0.042 | 0.828 ± 0.101 | ||
| Posteriorα | 0.167 ± 0.069 | 0.200 ± 0.083 | 0.774 ± 0.128 | ||
| Superiorα | 0.141 ± 0.045 | 0.169 ± 0.053 | 0.800 ± 0.227 | ||
| Average | 0.141 ± 0.048 | 0.175 ± 0.052 | 0.810 ± 0.190 | ||
| Glenoid | Superficial | Inferiorα | 0.144 ± 0.027 | 0.176 ± 0.029 | 1.20 ± 0.351 |
| Superiorα | 0.136 ± 0.088 | 0.180 ± 0.105 | 1.11 ± 0.376 | ||
| Average | 0.138 ± 0.062 | 0.178 ± 0.073 | 1.16 ± 0.346 | ||
| Middle | Inferiorε | 0.195 ± 0.110 | 0.233 ± 0.126 | 0.874 ± 0.458 | |
| Superiorα | 0.168 ± 0.094 | 0.185 ± 0.121 | 0.886 ± 0.429 | ||
| Average | 0.178 ± 0.094 | 0.203 ± 0.116 | 0.881 ± 0.400 | ||
Key: HA0, HA0.16: MPa, n:
=5,
=4
It can be noted that the tensile stress response exhibits a nonlinear behavior under finite strain (Figure 8), with E0.16 four to eight times greater than E0 (Table 1). The tensile modulus substantially differs by up to two orders of magnitude from the compressive aggregate modulus even at 0% strain (Tables 1 and 2), demonstrating a high degree of tension-compression nonlinearity or “bimodular” response (Figure 8).
Figure 8.

Typical plots of equilibrium stress versus strain from tensile and confined compression tests for the central region of the humeral head. It provides a good summary of the anisotropy, inhomogeneity, and tension-compression nonlinearity of human glenohumeral cartilage, with the slope of the stress-strain response representing the modulus. Note that the tensile portion of the stress-strain curve represents an unconfined tissue response whereas the compressive portion represents a confined tissue response. The direction of testing (parallel to the surface for tensile testing, perpendicular to the surface for compression testing) is also not the same.
Poisson’s ratio, ν for the humeral head was significantly greater than for the glenoid (p=0.01; H:1.16±0.28, G:0.95±0.31). For the humeral head, ν of specimens from the superficial zone tended to be greater than those from the middle zone (p=0.051; surface: 1.21±0.29, middle: 1.1±0.26), while there were no significant differences in ν between specimens from two orientations relative to the split lines (p=0.65; parallel: 1.17±0.26, perpendicular: 1.14±0.3) or from the five regions (p=0.65, anterior: 1.17±0.32, posterior: 1.18±0.31, superior: 1.12±0.36, inferior: 1.22±0.29, central: 1.08±0.27). For the glenoid, no significant zonal (p=0.67; surface: 0.92±0.35, middle: 0.99±0.29) and directional (p=0.83; parallel: 0.97±0.34, perpendicular: 0.94±0.31) differences were found in ν.
The statistical analysis yielded significant regional differences (p<0.01) for k0 of the humeral head with the center region exhibiting the highest permeability (the details of GHJ cartilage permeability coefficients were shown in Table 3). An interactive effect of zone and region was also observed (p=0.043), with the superficial zone at the central region exhibiting greater permeability than the middle zone. Significant differences were found in M between the humeral head and glenoid with the glenoid having a greater value of M (p=0.028). However, there were no significant differences in k0 between the humeral head and glenoid, or between the superficial and middle zones in either the glenoid or humeral head, and no significant regional and zonal differences were found in M for the humeral head or glenoid.
Table 3.
Permeability coefficients of human glenohumeral cartilage for different regions and zones.
| k0 (× 10-14) | M | ||
|---|---|---|---|
| Mating surfaces | Glenoidα | 1.35 ± 0.82 | 4.13 ± 1.95 |
| Humeral headβ | 1.14 ± 0.77 | 3.08 ± 1.66 | |
| Humeral head (region) | Superiorϕ | 0.87 ± 0.44 | 2.46 ± 1.79 |
| Inferiorδ | 1.00 ± 0.62 | 2.91 ± 1.46 | |
| Anteriorδ | 0.98 ± 0.39 | 2.95 ± 1.52 | |
| Posteriorϕ | 1.03 ± 0.57 | 3.19 ± 1.68 | |
| Centerδ | 1.82 ± 1.27 | 3.98 ± 1.77 | |
| Glenoid (region) | Superiorϕ | 1.46 ± 1.00 | 3.86 ± 2.08 |
| Inferiorε | 1.22 ± 0.56 | 4.46 ± 1.85 | |
| Humeral head (zone) | Superficialη | 1.10 ± 0.94 | 2.89 ± 1.74 |
| Middleι | 1.17 ± 0.54 | 3.30 ± 1.57 | |
| Glenoid (zone) | Superficialϕ | 1.18 ± 0.51 | 3.41 ± 1.55 |
| Middleε | 1.57 ± 1.10 | 5.02 ± 2.11 | |
Key: k0: m4/N.s, n:
=18,
= 47,
=8,
=9,
=25,
=22,
=10
No failure occurred to specimens in any of the compressive tests, even though specimens were subjected to a compressive strain of up to 50%. However, in 30 of the 120 tensile tests, failure of specimens occurred at the strain level of 20% or 25%. For all specimens of both surfaces, tensile failure occurred in 35% of specimens from the superficial zone and 15% of specimens from the middle zone. It should be noted that failure occurred in specimens from the superficial zone of the glenoid (50%) more than those from the superficial zone of the humeral head (32%).
DISCUSSION
The complexity of the mechanical properties of human GHJ articular cartilage was investigated in this study that addressed the anisotropy, inhomogeneity, and nonlinearity of the equilibrium elastic properties, as well as the inhomogeneity and nonlinearity of the tissue permeability. Tissue anisotropy was exhibited in tensile stiffness when measured parallel and perpendicular to the local split line direction. These results are consistent with several prior studies of human and animal articular cartilage (Kempson et al., 1973; Roth and Mow, 1980; Woo et al., 1976, 1979). The precise nature of the anisotropy (e.g., triclinic, monoclinic, orthotropic, etc.) cannot be fully characterized from these tests alone, since only two directions of loading were employed in tension. However, as the tensile properties differ when tested along two mutually perpendicular directions, each of these directions may indeed represent a plane of symmetry; since two orthogonal planes of symmetry automatically define a third mutually orthogonal plane, it is plausible to suggest that the material symmetry of cartilage in tension is no higher than orthotropic symmetry. This anisotropy is further emphasized by the measurements of Poisson’s ratio which were found to be close to or in excess of unity. This finding is also consistent with the studies of bovine humeral head cartilage (Woo et al., 1979) and human patella cartilage (Elliot et al., 2002).
It was found that the tensile stiffness of humeral head cartilage decreased from the superficial zone to the middle zone whereas the compressive aggregate modulus at 16% of compression was lower in the superficial zone than the middle zone. Similar depth-dependent behavior of the tensile and compressive properties of articular cartilage has been demonstrated in previous studies (Akizuki et al. 1986; Guilak et al., 1995; Kempson et al., 1971; Roth and Mow, 1980; Schinagl et al., 1997; Woo et al., 1979, 1980).
The anisotropy and depth-dependent inhomogeneity of the mechanical properties of articular cartilage have been suggested to result from the variations of its microstructure and biochemical composition (Akizuki et al. 1986; Guilak et al., 1995; Kempson et al., 1971; Schmidt et al., 1990). Interstitial water and electrolytes compose the fluid phase of articular cartilage, while its solid phase is composed of chondrocytes and an extracellular matrix, mainly consisting of collagen fibers and proteoglycans (Mow et al., 1980, 1992). Collagen fibrils in the superficial zone are densely packed parallel to the articular surface and split-line patterns are believed to align with their predominant orientation. In the middle zone, these fibers are randomly oriented and homogeneously dispersed (Redler et al., 1975). Such microstructural differences may explain the variation in tensile properties of articular cartilage with zone and orientation. Similarly, the proteoglycan content exhibits an inhomogeneous distribution through depth (highest in the middle zone and lowest in the superficial zone) (Mow et al., 1992), causing a non-homogenous Donnan osmotic swelling effect (Lai et al., 1990, 1991) which may contribute to the observed differences in the compressive behavior of cartilage among the zones.
The permeability of humeral head cartilage was found to exhibit a regional difference, with the permeability being greater at the center than the other regions. Previous studies have shown that the highest compressive GHJ force and stress occurred near 90 degrees of arm elevation, with the corresponding contact area in the humeral head mainly located in the central region (Apreleva et al., 2000; Conzen and Eckstein, 2000; Karlsson and Peterson, 1992; Poppen and Walker, 1978; Soslowsky et al., 1992b; Van der Helm, 1994), indicating that the central region of the humeral head may be a high weight bearing area relative to the other regions. These results support the clinical finding that, in patients with OA, the greatest wear and erosion of cartilage was found in regions of the humeral head which were in contact with the glenoid during arm elevation between 60 and 100 degrees (Neer, 1961). Nevertheless, the finding that the material properties of normal human glenohumeral cartilage were regionally homogeneous in general is consistent with similar observations of the compressive aggregate modulus and permeability of human patellofemoral joint cartilage (Froimson et al., 1997). For the purpose of performing engineering analyses of normal human glenohumeral cartilage, using finite element modeling for example, it is therefore reasonable to adopt regionally homogeneous properties (Donzelli et al., 1999).
It was found that the tensile stiffness and Poisson’s ratio of the humeral head cartilage were greater than those of the glenoid cartilage, whereas the compressive modulus and nonlinear permeability coefficient exhibited an opposite trend. It was also observed that the glenoid cartilage exhibited a higher incidence of failure in the tensile tests. These differences are interesting in light of clinical observations that the earliest visible signs of GHJ OA occur on the glenoid (DePalma et al., 1950; Neer, 1961; Neer et al., 1982). In addition, the glenoid cartilage was found to be loaded more frequently and longer than humeral head cartilage during normal shoulder motion (Soslowsky et al., 1992a). Though the mating articular surfaces of normal GHJ have been shown to be closely conforming (Soslowsky et al., 1992a) with small translations of the humeral head center of curvature during arm elevation, increased translations of the humeral head may result from decreased joint congruence, leading to the alteration of contact areas and stresses on the mating articular surfaces (Kelkar et al., 2001). If OA lesions develop at least partly as a result of excessive cartilage stresses or strains, as is the prevailing hypothesis, the differences in material coefficients and duty cycle may produce a differential state of stress or strain within cartilage between the humeral head and glenoid which may explain the earlier onset of OA in the glenoid. The precise differences in the state of stress and strain within cartilage between two mating surfaces can be determined using finite element contact analyses (Donzelli et al., 1999) that employ the results of the current study.
With regard to the equilibrium stress-strain response of humeral head and glenoid cartilage, nonlinearity was observed over the tensile range, over the compressive range, and across the tensile and compressive ranges. The nonlinearity in tension has been reported in several studies (Elliott et al., 1999; Fortin et al., 2000; Kempson et al., 1973; Woo et al., 1979); in human glenohumeral cartilage, it was found that, on average, the tensile modulus at 16% strain was up to 4.7 times greater than at 0% strain in the humeral head, and 6.4 times greater in the glenoid. The nonlinearity in compression has been less extensively investigated (Ateshian et al., 1997; Kwan et al., 1999; Schinagl et al., 1997); for the human GHJ, it was observed that the compressive aggregate modulus of cartilage changes only by a small amount from 0% to 16% compressive strain and that cartilage can sustain much greater strains in pure compression (with no failure at 50%) than in tension. This finding suggests that failure in tension is much more likely than in compression, and that failure criteria may have to consider peak tissue strains, not just tissue stresses (Atkinson et al., 1998).
Most interestingly is the observation that on average, the tensile modulus of GHJ cartilage (E0=3.90±2.97 MPa) was 27 times greater than the compressive modulus at 0% strain (HA0=0.145±0.092 MPa), dramatically emphasizing the tension-compression nonlinearity characteristic of this tissue. Though the tensile modulus was measured along directions tangential to the articular surface while the compressive modulus was measured normal to it, no evidence suggested that the observed disparity was due solely to the direction of loading; indeed, our own recent studies on bovine wrist cartilage (Wang et al., 2003) have demonstrated that the compressive modulus was on the same order of magnitude when measured along directions tangential and normal to the articular surface. This nonlinearity at the strain origin was shown to significantly influence the mechanical response of the tissue in recent studies of cartilage mechanics (Cohen et al., 1998; Fortin et al., 2000; Huang et al., 2001, 2003; Li et al., 2000; Soltz and Ateshian, 2000; Soulhat et al., 1999). Our recent findings also suggested that the chondroprotective contribution of cartilage interstitial fluid pressurization to its load support mechanism was significantly enhanced with higher ratio of the tensile and compressive moduli (Soltz and Ateshian, 2000; Huang et al., 2003). Interestingly, the greatest ratio was observed in the superficial zone (Humeral head: E0=5.56±3.00 MPa vs. HA0=0.116±0.043 MPa; Glenoid: E0=3.08±3.89 MPa vs. HA0=0.138±0.062 MPa), which is also the site of fibrillation in the early process of tissue degeneration; since fibrillation is likely to reduce the tensile stiffness of the tissue (Akizuki et al., 1986; Guilak et al., 1994), the loss of disparity between tensile and compressive moduli leads to a loss of interstitial fluid load support, which can further exacerbate the degenerative process.
The strain-dependent permeability found in this study confirmed previous studies that observed a nonlinear dependence between tissue permeability and the magnitude of tissue dilatation (Holmes and Mow, 1990; Mansour and Mow, 1976). In normal articular cartilage, a low permeability allows the tissue to maintain high interstitial fluid pressurization for physiologic loading durations. Because the collagen-proteoglycan matrix and interstitial water are intrinsically incompressible (Bachrach et al., 1998), instantaneous cartilage deformations under any loading configuration are isochoric (the tissue volume does not change); thus, there is no change in the permeability of cartilage immediately upon loading, since the tissue dilatation is initially nearly at zero. Dilatation-dependent changes in permeability occur only after relatively long durations of loading as the interstitial water exudes from the matrix (i.e. dilatation increase), and thus it acts to retard the loss of fluid pressurization.
In summary, this study reports an extensive set of material properties of human glenohumeral cartilage. Articular cartilage is anisotropic in tension, exhibiting greater stiffness along the local split line directions and Poisson’s ratio near or in excess of unity. The cartilage mechanical behaviors are nonlinear in tension and in compression, and also exhibit significant tension-compression nonlinearity even near 0% strain. The material properties of human glenohumeral cartilage are inhomogeneous through the depth, but generally homogeneous across the respective articular layers. Differences in certain properties of cartilage are also observed between the humeral head and glenoid. Knowledge of the material responses reported in this study can help advance our understanding of the state of stress and pathomechanics of human GHJ OA.
Acknowledgments
This work was supported by NIH Grants AR42850, AR43628 and AR46532.
References
- 1.Akizuki S, Mow VC, Muller F, Pita JC, Howell DS, Manicourt DH. Tensile properties of knee joint cartilage. I. Influence of ionic conditions, weight bearing and fibrillation on the tensile modulus. Journal of Orthopaedic Research. 1986;4:379–392. doi: 10.1002/jor.1100040401. [DOI] [PubMed] [Google Scholar]
- 2.Apreleva M, Parsons IM, Warner JJ, Fu FH, Woo SL. Experimental investigation of reaction forces at the glenohumeral joint during active abduction. Journal of Shoulder and Elbow Surgery. 2000;9:409–417. doi: 10.1067/mse.2000.106321. [DOI] [PubMed] [Google Scholar]
- 3.Ateshian GA, Warden WH, Kim RP, Grelsamer RP, Mow VC. Finite deformation biphasic material properties of bovine articular cartilage from confined compression experiments. Journal of Biomechanics. 1997;30:1157–1164. doi: 10.1016/s0021-9290(97)85606-0. [DOI] [PubMed] [Google Scholar]
- 4.Atkinson TS, Haut RC, Altiero NJ. An investigation of biphasic failure criteria for impact-induced fissuring of articular cartilage. Journal of Biomechanical Engineering. 1998;120:536–537. doi: 10.1115/1.2798025. [DOI] [PubMed] [Google Scholar]
- 5.Bachrach NM, Mow VC, Guilak F. Incompressibility of the solid matrix of articular cartilage under high hydrostatic pressures. Journal of Biomechanics. 1998;31:445–451. doi: 10.1016/s0021-9290(98)00035-9. [DOI] [PubMed] [Google Scholar]
- 6.Cohen B, Lai WM, Mow VC. A transversely isotropic biphasic model for unconfined compression of growth plate and chondroepiphysis. Journal of Biomechanical Engineering. 1998;120:491–496. doi: 10.1115/1.2798019. [DOI] [PubMed] [Google Scholar]
- 7.Conzen A, Eckstein F. Quantitative determination of articular pressure in the human shoulder joint. Journal of Shoulder and Elbow Surgery. 2000;9:196–204. [PubMed] [Google Scholar]
- 8.DePalma AF, White JB, Callery G. Degenerative lesions of the shoulder joint at various age groups which are compatible with good function. AAOS Instructional Course Lectures. 1950;Chapter VII:168–180. [Google Scholar]
- 9.Donzelli PS, Spilker RL, Ateshian GA, Mow VC. Contact analysis of biphasic transversely isotropic cartilage layers and correlations with tissue failure. Journal of Biomechanics. 1999;32:1037–1047. doi: 10.1016/s0021-9290(99)00106-2. [DOI] [PubMed] [Google Scholar]
- 10.Elliott DM, Guilak F, Vail TP, Wang JY, Setton LA. Tensile properties of articular cartilage are altered by meniscectomy in a canine model of osteoarthritis. Journal of Orthopaedic Research. 1999;17:503–508. doi: 10.1002/jor.1100170407. [DOI] [PubMed] [Google Scholar]
- 11.Elliott DM, Narmoneva DA, Setton LA. Direct measurement of the Poisson’s ratio of human patella cartilage in tension. Journal of Biomechanical Engineering. 2002;124:223–228. doi: 10.1115/1.1449905. [DOI] [PubMed] [Google Scholar]
- 12.Fortin M, Soulhat J, Shirazi-Adl A, Hunziker EB, Buschmann MD. Unconfined compression of articular cartilage: nonlinear behavior and comparison with a fibril-reinforced biphasic model. Journal of Biomechanical Engineering. 2000;122:189–195. doi: 10.1115/1.429641. [DOI] [PubMed] [Google Scholar]
- 13.Froimson MI, Ratcliffe A, Gardner TR, Mow VC. Differences in patellofemoral joint cartilage material properties and their significance to the etiology of cartilage surface fibrillation. Osteoarthritis and Cartilage. 1997;5:377–386. doi: 10.1016/s1063-4584(97)80042-8. [DOI] [PubMed] [Google Scholar]
- 14.Gleizes V, Viguier E, Feron JM, Canivet S, Lavaste F. Effects of freezing on the biomechanics of the intervertebral disc. Surgical and Radiologic Anatomy. 1998;20:403–407. doi: 10.1007/BF01653130. [DOI] [PubMed] [Google Scholar]
- 15.Guilak F, Ratcliffe A, Lane N, Rosenwasser MP, Mow VC. Mechanical and biochemical changes in the superficial zone of articular cartilage in a canine model of osteoarthritis. Journal of Orthopaedic Research. 1994;12:474–484. doi: 10.1002/jor.1100120404. [DOI] [PubMed] [Google Scholar]
- 16.Guilak F, Ratcliffe A, Mow VC. Chondrocyte deformation and local tissue strain in articular cartilage: a confocal microscopy study. Journal of Orthopaedic Research. 1995;13:410–421. doi: 10.1002/jor.1100130315. [DOI] [PubMed] [Google Scholar]
- 17.Holmes MH, Mow VC. The nonlinear characteristics of soft gels and hydrated connective tissues in ultrafiltration. Journal of Biomechanics. 1990;23:1145–1156. doi: 10.1016/0021-9290(90)90007-p. [DOI] [PubMed] [Google Scholar]
- 18.Huang CY, Mow VC, Ateshian GA. The role of flow-independent viscoelasticity in the tensile response of biphasic articular cartilage. Journal of Biomechanical Engineering. 2001;123:410–417. doi: 10.1115/1.1392316. [DOI] [PubMed] [Google Scholar]
- 19.Huang CY, Soltz MA, Kopacz M, Mow VC, Ateshian GA. Experimental verification of the role of intrinsic matrix viscoelasticity and tension-compression nonlinearity in the biphasic response of cartilage in unconfined compression. Journal of Biomechanical Engineering. 2003;125:84–93. doi: 10.1115/1.1531656. [DOI] [PubMed] [Google Scholar]
- 20.Hultkrantz W. Ueber die Spaltrichtungen der Gelenkknorpel. Verhandlungen der Anatomischen Gesellschaft. 1898;12:248. [Google Scholar]
- 21.Karlsson D, Peterson B. Towards a model for force predictions in the human shoulder. Journal of Biomechanics. 1992;25:189–199. doi: 10.1016/0021-9290(92)90275-6. [DOI] [PubMed] [Google Scholar]
- 22.Kelkar R, Wang VM, Flatow EL, Newton PM, Ateshian GA, Bigliani LU, Pawluk RJ, Mow VC. Glenohumeral mechanics: a study of articular geometry, contact, and kinematics. Journal of Shoulder and Elbow Surgery. 2001;10:73–84. doi: 10.1067/mse.2001.111959. [DOI] [PubMed] [Google Scholar]
- 23.Kempson GE, Freeman MA, Swanson SA. The determination of a creep modulus for articular cartilage from indentation tests of the human femoral head. Journal of Biomechanics. 1971;4:239–250. doi: 10.1016/0021-9290(71)90030-3. [DOI] [PubMed] [Google Scholar]
- 24.Kempson GE, Muir H, Pollard C, Tuke M. The tensile properties of the cartilage of human femoral condyles related to the content of collagen and glycosaminoglycans. Biochimica et Biophysica Acta. 1973;297:456–472. doi: 10.1016/0304-4165(73)90093-7. [DOI] [PubMed] [Google Scholar]
- 25.Kwan MK, Lai WM, Mow VC. A finite deformation theory for cartilage and other soft hydrated connective tissues--I. Equilibrium results. Journal of Biomechanics. 1990;23:145–155. doi: 10.1016/0021-9290(90)90348-7. [DOI] [PubMed] [Google Scholar]
- 26.Lai WM, Hou J, Mow VC. A triphasic theory for the swelling properties of hydrated charged soft biological tissues. In: Mow VC, Ratcliffe A, Woo SL-Y, editors. Biomechanics of Diarthrodial Joint. Springer-Verlag; New York: 1990. pp. 281–312. [Google Scholar]
- 27.Lai WM, Hou J, Mow VC. A triphasic theory for the swelling and deformation behaviors of articular cartilage. Journal of Biomechanical Engineering. 1991;113:245–258. doi: 10.1115/1.2894880. [DOI] [PubMed] [Google Scholar]
- 28.Li LP, Buschmann MD, Shirazi-Adl A. A fibril reinforced nonhomogeneous poroelastic model for articular cartilage: inhomogeneous response in unconfined compression. Journal of Biomechanics. 2000;33:1533–1541. doi: 10.1016/s0021-9290(00)00153-6. [DOI] [PubMed] [Google Scholar]
- 29.Mansour JM, Mow VC. The permeability of articular cartilage under compressive strain and at high pressures. Journal of Bone and Joint Surgery-American. 1976;58:509–516. [PubMed] [Google Scholar]
- 30.Mow VC, Kuei SC, Lai WM, Armstrong CG. Biphasic creep and stress relaxation of articular cartilage in compression: Theory and experiments. Journal of Biomechanical Engineering. 1980;102:73–84. doi: 10.1115/1.3138202. [DOI] [PubMed] [Google Scholar]
- 31.Mow VC, Ratcliffe A, Poole AR. Cartilage and diarthrodial joints as paradigms for hierarchical materials and structures. Biomaterials. 1992;13:67–97. doi: 10.1016/0142-9612(92)90001-5. [DOI] [PubMed] [Google Scholar]
- 32.Neer CS., II Degenerative lesions of the proximal humeral articular surface. Clinical Orthopaedics and Related Research. 1961;20:116–125. [PubMed] [Google Scholar]
- 33.Neer CS., II Replacement arthroplasty for glenohumeral arthritis. Journal of Bone and Joint Surgery-American. 1974;56:1–13. [PubMed] [Google Scholar]
- 34.Neer CS, II, Watson KC, Stanton FJ. Recent experience in total shoulder replacement. Journal of Bone and Joint Surgery-American. 1982;64:319–337. [PubMed] [Google Scholar]
- 35.Poppen NK, Walker PS. Forces at the glenohumeral joint in abduction. Clinical Orthopaedics and Related Research. 1978;135:165–70. [PubMed] [Google Scholar]
- 36.Redler I, Mow VC, Zimny ML, Mansell J. The ultrastructure and biomechanical significance of the tidemark of articular cartilage. Clinical Orthopaedics and Related Research. 1975;112:357–362. [PubMed] [Google Scholar]
- 37.Roth V, Mow VC. The intrinsic tensile behavior of the matrix of bovine articular cartilage and its variation with age. Journal of Bone and Joint Surgery-American. 1980;62:1102–1117. [PubMed] [Google Scholar]
- 38.Salai M, Givon U, Messer Y, von Versen R. Electron microscopic study on the effects of different preservation methods for meniscal cartilage. Annals of Transplantation. 1997;2:52–54. [PubMed] [Google Scholar]
- 39.Schinagl RM, Gurskis D, Chen AC, Sah RL. Depth dependent confined compression modulus of full thickness bovine articular cartilage. Journal of Orthopaedic Research. 1997;15:499–506. doi: 10.1002/jor.1100150404. [DOI] [PubMed] [Google Scholar]
- 40.Schmidt MB, Mow VC, Chun LE, Eyre DR. Effects of proteoglycan extraction on the tensile behavior of articular cartilage. Journal of Orthopaedic Research. 1990;8:353–363. doi: 10.1002/jor.1100080307. [DOI] [PubMed] [Google Scholar]
- 41.Setton LA, Zhu W, Mow VC. The biphasic poroviscoelastic behavior of articular cartilage: Role of the surface zone in governing the compressive behavior. Journal of Biomechanics. 1993;26:581–592. doi: 10.1016/0021-9290(93)90019-b. [DOI] [PubMed] [Google Scholar]
- 42.Soslowsky LJ, Flatow EL, Bigliani LU, Mow VC. Articular geometry of the glenohumeral joint. Clinical Orthopaedics and Related Research. 1992a;285:181–190. [PubMed] [Google Scholar]
- 43.Soslowsky LJ, Flatow EL, Bigliani LU, Pawluk RJ, Ateshian GA, Mow VC. Quantitation of in situ contact areas at the glenohumeral joint: a biomechanical study. Journal of Orthopaedic Research. 1992b;10:524–534. doi: 10.1002/jor.1100100407. [DOI] [PubMed] [Google Scholar]
- 44.Soltz MA, Ateshian GA. A conewise linear elasticity mixture model for the analysis of tension-compression nonlinearity in articular cartilage. Journal of Biomechanical Engineering. 2000;122:576–586. doi: 10.1115/1.1324669. [DOI] [PMC free article] [PubMed] [Google Scholar]
- 45.Soulhat J, Buschmann MD, Shirazi-Adl A. A fibril-network reinforced model of cartilage in unconfined compression. Journal of Biomechanical Engineering. 1999;121:340–347. doi: 10.1115/1.2798330. [DOI] [PubMed] [Google Scholar]
- 46.Van der Helm FCT. Analysis of the kinematic and dynamic behavior of the shoulder mechanism. Journal of Biomechanics. 1994;27:527–550. doi: 10.1016/0021-9290(94)90064-7. [DOI] [PubMed] [Google Scholar]
- 47.Wang CC-B, Hung CT, Mow VC. An analysis of the effects of depth dependent aggregate modulus on articular cartilage stress-relaxation behavior in compression. Journal of Biomechanics. 2001;34:75–84. doi: 10.1016/s0021-9290(00)00137-8. [DOI] [PubMed] [Google Scholar]
- 48.Wang CC-B, Chahine NO, Hung CT, Ateshian GA. Optical determination of anisotropic properties of bovine articular cartilage in compression. Journal of Biomechanics. 2003;36:339–353. doi: 10.1016/s0021-9290(02)00417-7. [DOI] [PMC free article] [PubMed] [Google Scholar]
- 49.Woo SL, Akeson WH, Jemmott GF. Measurement of nonhomogenous, directional mechanical properties of articular cartilage in tension. Journal of Biomechanics. 1976;9:785–791. doi: 10.1016/0021-9290(76)90186-x. [DOI] [PubMed] [Google Scholar]
- 50.Woo SL, Lubock P, Gomez MA, Jemmott GF, Kuei SC, Akeson WH. Large deformation nonhomogeneous and directional properties of articular cartilage in uniaxial tension. Journal of Biomechanics. 1979;12:437–446. doi: 10.1016/0021-9290(79)90028-9. [DOI] [PubMed] [Google Scholar]
- 51.Woo SL, Simon BR, Kuei SC, Akeson WH. Quasi-linear viscoelastic properties of normal articular cartilage. Journal of Biomechanical Engineering. 1980;102:85–90. doi: 10.1115/1.3138220. [DOI] [PubMed] [Google Scholar]