Abstract
Atomic force microscopy (AFM) has become a conventional tool for elucidation of the molecular mechanisms of protein aggregation and, specifically, for analysis of assembly pathways, architecture, aggregation state, and heterogencity of oligomeric intermediates or mature fibrils. AFM imaging provides useful information about particle dimensions, shape, and substructure with nanometer resolution. Conventional AFM methods have been very helpful in the analysis of polymorphic assemblies formed in vitro from homogeneous proteins or peptides. However, AFM imaging on its own provides limited insight into conformation or composition of assemblies produced in the complex environment of a cell, or prepared from a mixture of proteins as a result of cross-seeding. In these cases, its combination with fluorescence microscopy (AFFM) increases its resolution.
Keywords: Amyloids, Assembly, Atomic force microscopy, Atomic force fluorescence microscopy, Immunofluorescence, Oligomers
1. Introduction
Atomic force microscopy (AFM) was evolved from STM to overcome its drawbacks that limited its use to the study of conducting or semiconducting materials and generalize its applications to the study of the surface properties of materials (1). Despite its name, AFM does not provide atomic resolution and mostly it does not measure atomic forces but interfacial. AFM images the topographic, chemical, mechanical, and electrical properties of surfaces (interfaces). Basically, it consists of a sharp microtip attached to a cantilever which is scanned across the surface of a sample. The deflection of this cantilever is monitored using a laser and a four-quadrant photodiode and is used to build the surface image.
Of the different modes of work, given the softness of biological material and the shear force involved in contact, the analysis of peptide and protein assemblies is mainly performed using intermittent-contact (tapping) or dynamic force working mode (DFM or AC-AFM). In this mode, a stiff cantilever is oscillated closer to the sample than in noncontact mode. Part of the oscillation extends into the repulsive regime, so the tip intermittently touches (or “taps”) the surface improving lateral resolution by abolishing dragging and avoiding damaging of the sample.
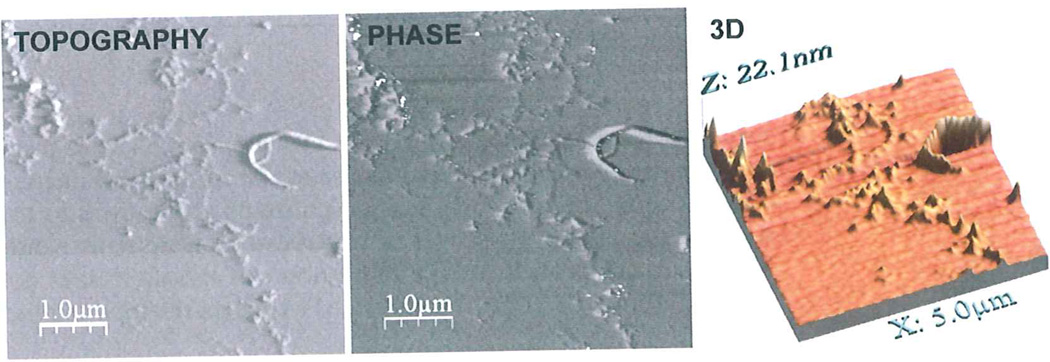
AFM imaging provides useful information about particle’s dimensions, shape, and substructure at a nanometer resolution. Conventional AFM methods have been very helpful in the analysis of fibrils formed in vitro from homogeneous proteins or peptides (1–4). In theory, AFM imaging using commercial AFM instruments can provide up to 10−10 m resolution. However, due to the tip convolution and finite width, the resolution is limited to a few nanometer (Fig. 1). Considering that the length of amyloid fibrils is in the range of 10–10,000 nm and their lateral dimension is between 3 and 30 nm, the precision of AFM measurements is usually sufficient to probe filament substructure of amyloid fibrils (1).
Fig. 1.
Schematic diagram illustrating the information contained in an intermittent-noncontact AFM scan of protein fibrils. Topography and Phase imaging layers of aggregates formed using a 1:1 mixture of rHaPrP wt and rHaPrP M206S–M213S under native conditions (9). 3D profile of the aggregates constructed with WSxM 5.0 after equalization and flattening.
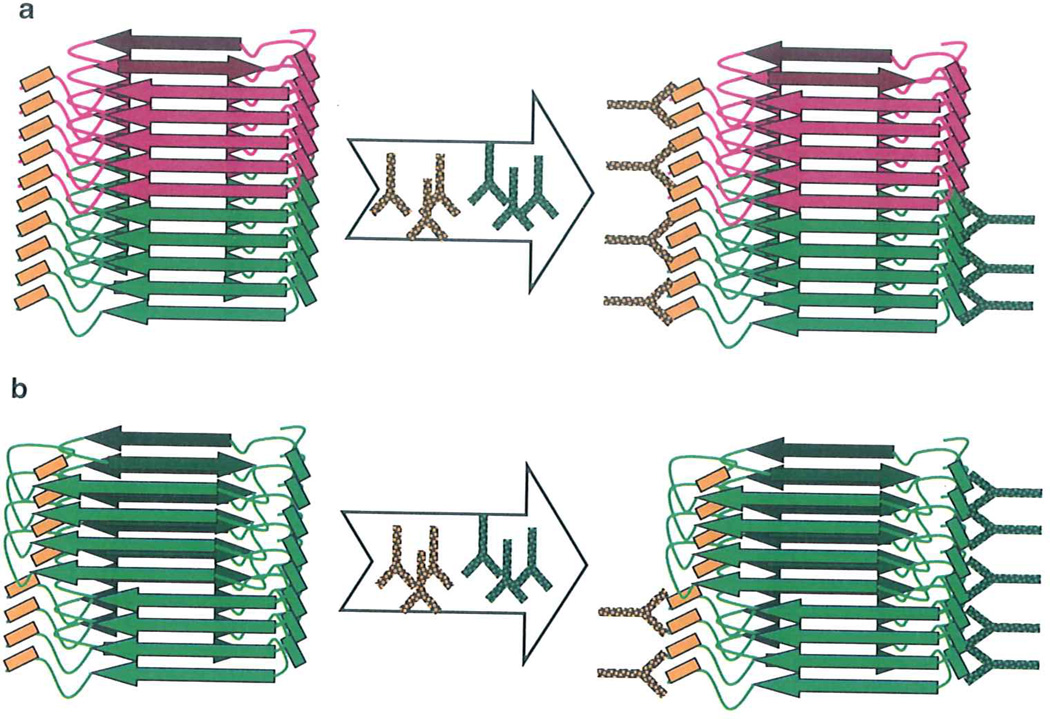
However, AFM imaging on its own provides limited insight into conformation or composition of fibrils produced in complex environments, or prepared from a mixture of proteins as a result of cross-seeding. For these cases, combination of AFM with fluorescence microscopy (will be referred to as AFFM) increases the resolution of the composition and conformation of individual fibrils (5, 6). The analysis of fibril composition addresses the question of whether individual amyloid fibrils are made of identical/homologous or heterologous polypeptides. The procedure involves coimmunostaining using a pair of antibodies specific to the proteins of interest (5). This method requires the epitopes recognized by both antibodies to be exposed on fibrillar surface and to be immunoreactive (Fig. 2a). Information obtained by this approach is important for elucidating the mechanisms of cross-seeding or cross-talk between homologous or non-related amyloidogenic proteins or peptides.
Fig. 2.
Schematic diagram illustrating analysis of fibril composition or conformation using double immunostaining. (a) Analysis of fibril composition. Amyloid fibrils produced from two homologous proteins (green and red) are treated with a pair of antibodies. Antibodies should be selected using the following rules: one antibody used in a pair (yellow) should recognize either one or both proteins, whereas another antibody (green) should be specific to only one protein, epitopes to both antibodies should be immunoreactive in fibrillar form, (b) Analysis of conformational switching within individual fibils. Amyloid fibrils are treated with a pair of antibodies which are selected using the following rules: the epitope to one antibody used in a pair (green) should be immunoreactive in both amyloid states, whereas the epitope to the second antibody (yellow) should be immunoreactive in only one amyloid state.
Analysis of fibril conformation addresses the question of whether the structure of β-spine is uniform within individual fibrils or switches between alternative conformations (7). The procedure involves coimmunostaining using a pair of antibodies specific to two different epitopes within the same polypeptide chain (Fig. 2b). To perform this assay, both epitopes have to be immunorective in one amyloid state, whereas only one epitope should maintain immunoreactivity in alternative amyloid state. This approach can be applied for elucidating molecular mechanisms of prion or amyloid strain evolution, adaptation, or modification (6, 7). While the experimental protocols described in the current chapter were optimized for the analysis of composition or conformation of fibrils prepared from mammalian prion protein (PrP), these procedures can be adopted for the analysis of fibrils formed by non-priori proteins if appropriate sets of antibodies are available.
The current chapter describes the routine AFM imaging mode (AC-AFM) and introduces a new approach that relies on AFM and fluorescence microcopy coimaging (AFFM).
2. Materials
All the solutions must be made using ultrapure water (e.g., Milli Q) and ACS quality reagents.
2.1. Protein and/or Peptide Fibrils
Recombinant prion protein purified and converted into amyloid fibrils as described previously (5, 6, 8).
2.2. Mica Surface and Its Preparation
-
1
Unmodified AFM-grade mica 1 cm × 1 cm pieces (Novascan).
-
2
Magnetized-stainless steel coin-like sample holders (15-mm diameter, 3-mm height).
-
3
Stick the mica pieces on the top of the holder using double-sided scotch paper.
-
4
Clean covered containers for preservation (35-mm diameter dishes allow their independent storage).
2.3. Cover Glasses and Its Preparation
-
5
Two separate hoods for handling organic solvents and oxidants, respectively.
-
6
100% Isopropanol.
-
7
100% Acetone.
-
8
Sulfuric acid/hydrogen peroxide cleaning solution: 70% sulfuric acid; 10% hydrogen peroxide; 20% water (Prepare immediately before use by pouring 98% sulfuric acid over 30% hydrogen peroxide solution and gentle mixing of the solution. Proceed with care as the mixing of these solutions generates heat).
-
9
25-mm Square premium cover glasses (0.13–0.17 mm thin, Fisher Scientific).
-
10
Cover glass coplin staining jar (Wheaton Science Products).
-
11
Ultrasonic cleaner (Branson Ultrasonics).
2.4. Double Immunostaining of Recombinant PrP Fibrils
5 µg/ml solutions of recombinant Syrian hamster PrP R-fibrils seeded with S-fibrils, in 5 mM sodium acetate, pH 5.0, prepared according to Makarava and Baskakov (see ref. 6, 8, Note 1).
Tris-buffered saline (TBS) solution, containing 50 mM Tris and 0.15 M NaCl, pH 7.5.
TBST (TBS with 0.25% Triton X-100).
TBST–HS (TBST with 5% horse serum and 0.02% sodium azide).
TBST–BSA (TBST with 1% bovine serum albumin and 0.02% sodium azide).
Primary antibodies: anti-PrP human R2 and anti-PrP mouse AG4 antibody solutions, both stored in 20% Glycerol at −20°C (see Note 2).
Secondary antibodies: goat anti-human IgG, labeled with Alexa-546, and goat anti-mouse IgG, labeled with Alexa-488, both stored at 4°C (see Note 3).
2.5. Atomic Force Fluorescence Microscopy
Atomic force microscope with 10-µm scanner (Pico LE AFM system, Agilent).
Inverted light microscope (Eclipse TE2000-U, Nikon, Japan) equipped with an oil-immersion objective (1.3 aperture Plan Fluor ×100, Nikon, Japan), a CCD camera (CoolSnap HQ, Photometries, Tucson, AZ) and filter sets for Alexa-488 (ET GFP) and Alexa 546 (ET DsRED) fluorescent imaging (Chroma Technology).
Dark room equipped with a vibration isolation system/table (Veeco) and preferably isolated or distanced from the sources of loud sounds.
AFM probes for intermittent (tapping/noncontact) mode with resonant frequency ~300 kHz, elastic constant ~40 N/m, and tip diameter ~7 nm.
Software to obtain and treat the images. For the setup above besides the software supplied with the instrumentation (V+ + for the inverted microscope, Pico Scan for the AFM microscope), we use WCIF ImageJ, which can provide RGB merging of fluorescence images as well as generic (size, crop, alignment) treatment of AFM images. For specific AFM analysis, we used the free software WSxM 5.0 (http://www.nanotec.es).
3. Methods
Unless stated otherwise, all the operations are done at room temperature (20–25°C). The whole experiment takes one to a few days, depending on the quality of fibril samples and AFM probes and the necessity to adjust immunostaining and AFM scanning procedures. It is first recommended to check separately the quality of fibrils by both atomic force and fluorescence imaging beforehand.
3.1. Sample Preparation
3.1.1. Sample Preparation on Mica Surfaces for AFM
Stick the mica pieces on the top of the holder using double-sided scotch paper.
Immediately before use, exfoliate the mica surface adhering the sticky side of scotch paper and pulling up.
Deposit the protein solution (typically 10 µl of 5–10 µg/ml protein fibrils) on the mica and allow it to incubate for 10 min in a dust-free atmosphere (covered) for adsorption (see Note 4).
Wash extensively the surface with Milli Q water and aspirate the excess with filter paper avoiding touching the surface.
Dry them with compressed air/N2 immediately before use.
3.1.2. Sample Preparation on Glass Surfaces for AFFM
AFFM Cover Glass Pretreatment
It is important to provide additional cleaning even to precleaned cover glasses. The following procedure significantly decreases the background in fluorescence images, improves image contrast, and facilitates focus handling. Steps involving organic solvents and sulfuric acid should be performed under separate hoods using standard precautions (nitrile gloves, lab robes, eye glasses):
Place cover glasses separately in glass jars. Be sure that all the jars are intact and their caps sit tight on them.
Fill the jars with isopropanol until it covers glasses. Place the jars in the ultrasonic bath and sonicate for 2 min. Take the jars out, collect isopropanol.
Repeat step 2 with acetone instead of isopropanol.
Repeat step 2.
Wash the jars with cover glasses with ultrapure water 5–7 times.
Pour freshly prepared sulfuric acid/hydrogen peroxide solution in the jars to cover the glasses. Incubate for 1 h under the hood. Draw the solution off the jars to a special waste bottle.
Repeat step 5. Store the cleaned cover glasses in the jars at 4°C. Dry them with the compressed air/N2 immediately before use.
Double Immunostaining on Glass Surfaces
The following procedure for double immunostaining was designed to discriminate between two conformational states of full-length PrP amyloid fibrils: S and R states (8). Mouse IgG AG4, which binds to both R- and S-states, was used in a pair with R2 antibody (epitope 225–231), which binds only to S-state (8). The same procedure with minor modifications can be employed for analyzing fibrils produced from non-prion proteins for which panels of appropriate antibodies are available. If a choice of antibodies is limited, amyloid-specific fluorescent dyes (such as thioflavin T) can be used instead of one antibody in pair with a specific antibody (5).
Follow the recommended storage conditions for all antibodies. If stored frozen, antibody solutions should be divided into aliquots. All operations with Alexa-labeled antibodies should be done minimizing light exposure. Used solutions of primary antibodies can be stored for a few days at 4°C for repeated use.
Spread 50 µl of fibril solutions on freshly dried cover glasses. Incubate for 5 min for fibrils to get attached to the glass surface (see Note 4).
Wash gently with Milli Q water. Cover the glass surface with TBS until proceeding with antibody staining.
Prepare 1:500 dilution of anti-PrP human Fab R2 in TBST–HS. Apply 250 µ1 of this solution to cover glasses. Incubate for 1 h at room temperature.
Wash with 3 × 300 µl TBST by gentle pipetting.
Prepare 1:1,000 dilution of anti-PrP mouse IgG AG4 in TBST–HS. Apply 250 µl of this solution to cover glasses. Incubate for 1 h at room temperature (see Note 5).
Repeat step 4.
Wash with 300 µl TBST–BSA for 10 min.
Prepare the mix of anti-human IgG (H+L) Alexa 546 (red) and anti-mouse IgG (H+L) Alexa 488 (green), both diluted 1:700 in TBST–BSA. Apply 250 µl of this solution to cover glasses. Incubate for 1 h at room temperature.
Repeat step 4.
Wash with 300 µl TBS for 10 min or store with TBS at 4°C overnight.
Wash with Milli Q water and dry on bench top or with low force N2 before AFFM imaging.
3.2. Imaging
3.2.1. Basic AFM Imaging Procedure
Assemble and adjust the AFM scanner. Following the user manual provided with each equipment, insert the cantilever and center the laser on it, and proceed to adjust the detector.
Determine the resonant frequency of the tip.
Fix the sample in the sample holder and mount the scanner, so the sample surface is approximately 200 µm apart from the tip.
Adjust scanning parameters (tapping at 99.9% of resonant frequency, scanning speed 1 line/s, scan square size of about 5 µm) and start the approach.
Scanning will provide three imaging layers: topography, amplitude, and phase. The three layers should be coherent, but topography and phase can differ.
Export images for analysis with any free software as WSxM 5.0 (http://www.nanotec.es).
3.2.2. AFFM Imaging
In general, AFM operations on inverted microscope sample holder do not differ from those on a standalone AFM microscope. All the operations with the AFM scanner placed on the inverted microscope sample holder should be done with the additional care as the objective and cover glass movements can destroy the AFM probe (see Note 6).
Assemble the AFM scanner in this case fixing the sample cover glass in the sample holder and proceed to adjust scanning parameters. Withdraw the tip to 200 µm above the sample surface.
Transfer the AFM scanner with the sample to the inverted microscope sample holder. Approach the sample cover glass with the microscope objective at the minimal pace and carefully focus on fibrils.
Move the sample vertically from the microscope objective and toward AFM probe so the distance between the AFM probe and the sample surface is approximately 20 µm. After the sample surface approached the AFM probe and moved from the inverted microscope objective, refocus the fluorescence microscope again with the AFM laser turned off.
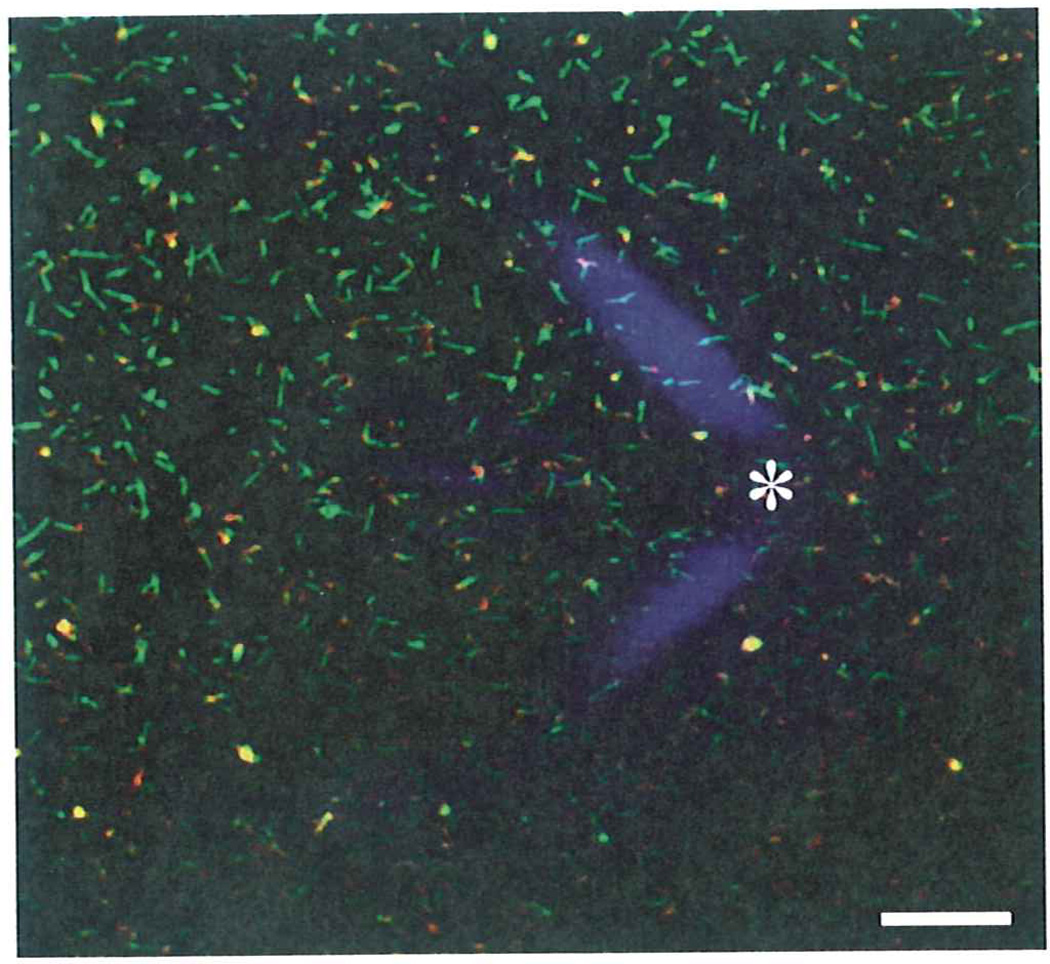
Turn on the AFM laser. Reposition the inverted microscope sample holder horizontally so that the AFM probe tip is pointing to the center of the CCD camera viewing field. Using fluorescence microscope, take an image of laser diffraction on AFM probe cantilever (Fig. 3). The image of laser diffraction will help to align the fibril fluorescence image with AFM images.
Turn off the AFM laser. Using appropriate filter sets (ET-GFP for AG4 staining, ET DsRED for R2 staining), record fluorescence images from the same field of view (see Note 7).
Slightly withdraw the objective so it still touches the sample through the oil drop.
Turn on the AFM laser. Approach the sample with the AFM probe. Scan 10 × 10-µm field.
(optional) If higher resolution images are needed, zoom into a smaller scan size, adjust scanning parameters (lower scanning speed, higher integral gain, smaller servo amplitude, etc.), scan again (see Note 8).
Withdraw the sample from the AFM probe to distance 20 µm. Turn off the AFM laser.
Focus the inverted microscope again. Move the sample approximately 10 µm horizontally in any direction using fluorescence live-time imaging to control the moving process.
Repeat steps 6–10 several times to collect a combined AFM image of 20–30-µm side square.
Move the sample horizontally to obtain a different inverted microscope viewing field. Repeat steps 5 and 11.
Withdraw the AFM probe from the sample. Withdraw the objective from the sample. Transfer the AFM scanner with the sample to its holder. If needed, replace the sample cover glass with the next one and repeat the procedure.
Fig. 3.
Aligning fluorescence and AFM field of views. Fluorescence microscopy image of hybrid mouse-hamster PrP fibrils recoded in two channels (red and green) using corresponding filter stets and a diffraction image of AFM laser on a probe cantilever that was registered by fluorescence microscope without a filter. The asterisk marks the spot on the fluorescence field of view that corresponding to the AFM tip facilitating subsequent manual alignment of AFM and fluorescence images. Bar length is 5 µm.
Fig. 4.
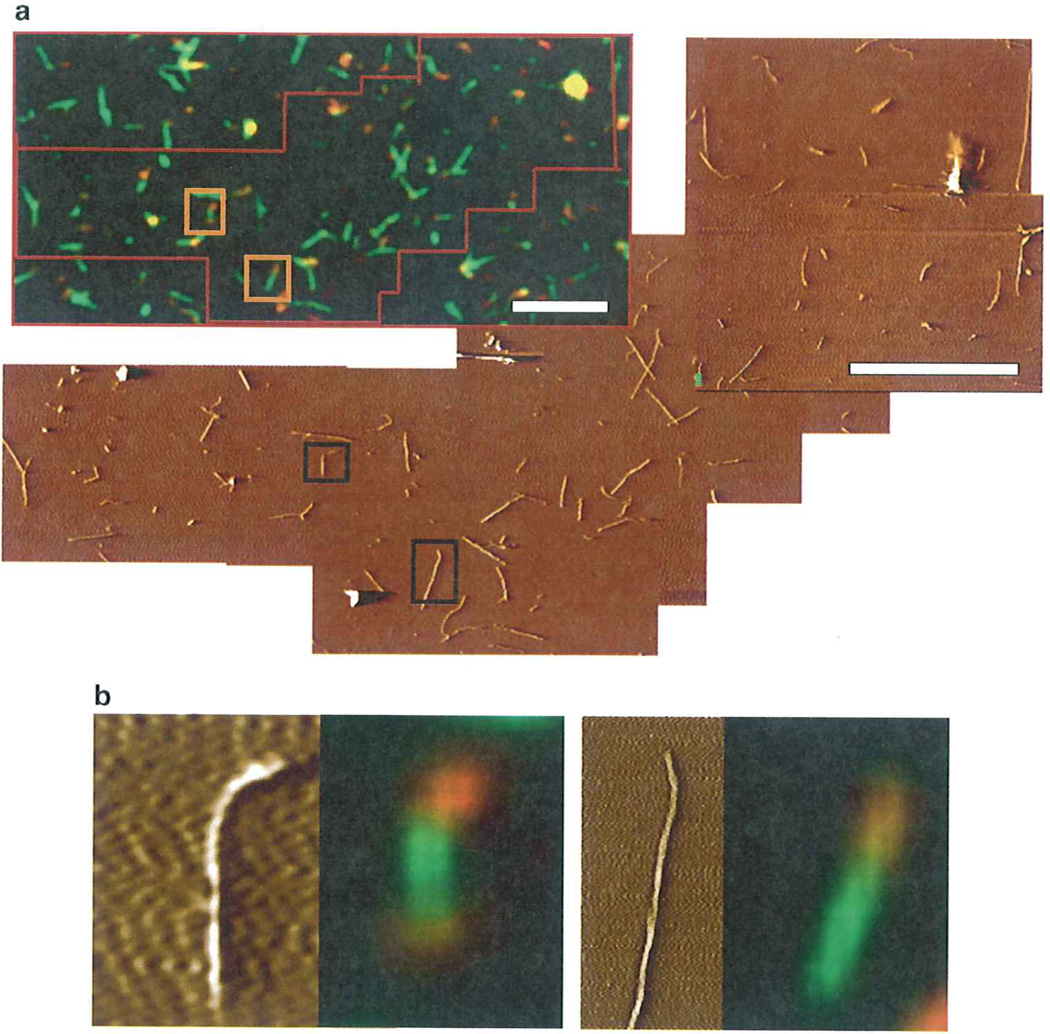
Matching of fluorescence and AFM imaging, (a) Hybrid hamster-mouse PrP fibrils were stained with two anti-PrP antibodies: hamster-specific (red) and antibodies that recognize both hamster and mouse PrPs (green). The matching of fluorescence and AFM images was performed manually. The area corresponding to several AFM scans is marked by a red line in the fluorescence field of view, (b) Examples of individual hybrid hamster-mouse fibrils imaged by AFFM. Bar length is 5 µm.
Acknowledgments
This work was supported in parts by the National Institute of Health (grant R01 NS045585 to I.V.B), the Spanish MICINN (BFU2009—07971 to MG), and the Fundación CIEN (to MG).
Abbreviations
- AFM
Atomic force microscopy
- AFFM
Atomic force fluorescence microscopy
Footnotes
If you are going to apply AFFM to preparations of amyloid fibrils other than used here, check the sample for the presence of standalone fibrils in sufficient quantity (e.g., by ThT fluorescence, negative staining electron microscopy).
Carefully plan the pair of primary antibodies to use in double immunostaining. Be sure that they are of different origin, so the secondary antibodies distinguish between the primary ones. If antibodies recognize epitopes, which are in close proximity to each other, you might encounter interference. In this case, changing the sequence of immunostaining could some time help to resolve this problem.
Make sure that the spectral characteristics of filters in your fluorescence microscope match those of fluorescent dyes with which the secondary antibodies are labeled.
Attachment efficiency depends on both the assembly features and the surface and it must be empirically determined for each system. Some types of amyloid fibrils attach poorly to glass surface. To overcome this problem, a cross-linking step can be employed. Optimize conditions for cross-linking with care; be aware that cross-linking might interfere with the epitope immunoreactivity.
Read notes II and III. In case you need only single antibody staining, omit the step involving treatment with the second primary antibody. Second antibody staining can be replaced by the staining with small fluorescent molecules (such as thioflavin T).
Approaching and withdrawal of the objective can slightly move the sample cover glass when the oil drop connects them. Move the objective slowly with the AFM tip withdrawn from the surface by at least 20 µm. Do not forget to turn on the laser every time you approach the sample with AFM tips.
It is desirable to use high-quality filter sets (such as ET series from Chroma) as they considerably increase resolution and contrast of fluorescence images.
Follow generic AFM imaging improvement methods which can be found in AFM system manual or specialized internet sites such as http://www.afmuniversity.org. Thermal or mechanical drift happens often in such systems and is especially noticeable at small scan areas. It can be counteracted using the software supplied with the AFM system (Pico Scan in this case).
User-friendly freeware WCIF ImageJ can be used to merge RGB images. Matching of AFM and fluorescence images can be done manually either on a PC display or using printed images. Because the square size of a single AFM field of view is 10 × 10 µm or less, whereas the square size of a single fluorescence field of view is 60 × 60 µm, several AFM scan images can fit within a single fluorescence image.
References
- 1.Anderson M, Bocharova OV, Makarava N, Breydo L, Salnikov VV, Baskakov IV. Polymorphysm and Ultrastructural Organization of Prion Protein Amyloid Fibrils: An Insight from High Resolution Atomic Force Microscopy. J Mol Biol. 2006;358:580–596. doi: 10.1016/j.jmb.2006.02.007. [DOI] [PubMed] [Google Scholar]
- 2.Jansen R, Dzwolak W, Winter R. Amyloidogenic Self-Assembly of Insulin Aggregates Probed by High Resolution Atomic Force Microscopy. Biophys J. 2005;88:1344–1353. doi: 10.1529/biophysj.104.048843. [DOI] [PMC free article] [PubMed] [Google Scholar]
- 3.Zhu M, Han S, Zhou F, Carter SA, Fink AL. Annular olgomeric amyloid intermediates observed by in situ atomic force microscopy. J Biol Chem. 2004;279:24452–24459. doi: 10.1074/jbc.M400004200. [DOI] [PubMed] [Google Scholar]
- 4.Chamberlain AK, MacPhee CE, Zurdo J, et al. Ultrastructural Organization of Amyloid Fibrils by Atomic Force Miscroscopy. Biophys J. 2000;79:3282–3293. doi: 10.1016/S0006-3495(00)76560-X. [DOI] [PMC free article] [PubMed] [Google Scholar]
- 5.Makarava N, Lee CI, Ostapchenko VG, Baskakov IV. Highly promiscuous nature of prion polymerization. J Biol Chem. 2007;282:36704–36713. doi: 10.1074/jbc.M704926200. [DOI] [PubMed] [Google Scholar]
- 6.Makarava N, Ostapchenko VG, Savtchenko R, Baskakov IV. Conformational switching within individual amyloid fibrils. J Biol Chem. 2009;28:14386–14395. doi: 10.1074/jbc.M900533200. [DOI] [PMC free article] [PubMed] [Google Scholar]
- 7.Baskakov IV. Switching in amyloid structure within individual fibrils: implication for strain adaptation, species barrier and strain classification. FEBS Lett. 2009;583:2618–2622. doi: 10.1016/j.febslet.2009.05.044. [DOI] [PMC free article] [PubMed] [Google Scholar]
- 8.Makarava N, Baskakov IV. The same primary structure of the prion protein yields two distinct self-propagating states. J Biol Chem. 2008;283:15988–15996. doi: 10.1074/jbc.M800562200. [DOI] [PMC free article] [PubMed] [Google Scholar]
- 9.Lisa S, Meli M, Cabello G, Gabizon R, Colombo G, Gasset M. The structural intolerance of the PrP α-fold for polar substitution of the helix-3 methionines. Cell. Mol. Life Sci. 2010;67:2825–2838. doi: 10.1007/s00018-010-0363-1. [DOI] [PMC free article] [PubMed] [Google Scholar]


