Abstract
Recent technical advances have enabled the imaging of single fluorescent molecules. The application of single molecule visualization techniques has opened up new avenues of experimentation in biology at the molecular level. In this article, we review the application of single fluorescent molecule visualization and analysis to an important problem, that of sub-unit stoichiometry in membrane proteins, with particular emphasis on our approach. Single fluorescent molecules, coupled to fluorescent proteins, are localized in the membranes of cells. The molecules are then exposed to continuous low-level excitation until their fluorescence emissions reach background levels. The high sensitivity of modern instrumentation has enabled direct observations of discrete step decreases in the fluorescence of single molecules, which represent the bleaching of single fluorophores. By counting the number of steps over a large number of single molecules, an average step count is determined, from which the stoichiometry is deduced using a binomial model. We examined the stoichiometry of a protein, prestin, that is central to mammalian hearing. We discuss how we prepared, identified and imaged single molecules of prestin. The methodological considerations behind our approach are described and compared to similar procedures in other laboratories.
Introduction
Photometric observation of single fluorescent molecules, once an unimaginable goal, is now being realized with increasing frequency in a variety of biological research settings. Significant improvements in detection methods, such as advanced digital cameras and high quantum efficiency silicon avalanche photodiodes, together with steadily decreasing prices, have brought single molecule fluorescence imaging techniques within the reach of many laboratories.
The applications of single molecule fluorescence analysis are numerous and multiplying. Notable advances were made in recent years in understanding the mobility and underlying mechanisms of aggregation of neurotransmitter receptors by visualizing single receptor molecules tagged with fluorophores, either genetically or via fluorophore-conjugated antibodies (Bats et al., 2007; Ehlers et al., 2007; Ehrensperger et al., 2007). Fluorophores were localized with greater than diffraction-limited precision by fitting two-dimensional Gaussian surfaces to their pixilated images. Similar approaches have been used to study the mechanics of motor proteins such as kinesin and myosin at the single molecule level (Yildiz et al., 2003). Single molecule approaches have also been effectively applied to the analysis of structural rearrangements in single molecules by Förster Resonance Energy Transfer, in DNA processing enzymes (Joo et al., 2006; Kozuka et al., 2006; Myong et al., 2005), RNA polymerases (Liu et al., 2007), and proteins (Schuler & Eaton 2008).
A novel recent advance in single molecule applications is the use of single molecule fluorescent imaging to a vexing problem in membrane protein structural biology, the determination of subunit stoichiometry. Many, perhaps most, membrane proteins are found as oligomers. However, traditional methods of determining the stoichiometry of oligomerization, such as Western blots, often yield ambiguous results, perhaps because the protein is no longer in its native environment, the plasma membrane. An ingenious approach to this problem was described and systematically tested by Ulbrich & Isacoff (2007). They expressed membrane proteins, coupled to the enhanced Green Fluorescence Protein (eGFP), in frog oocytes. They used a high quantum efficiency camera and total internal reflection (TIRF) imaging to record images of isolated single molecules of membrane proteins. Under continuous excitation, the fluorescence in regions of interest (ROIs) enclosing putative single molecules was observed to decrease in approximately equal-amplitude steps, consistent with the bleaching of single fluorophore molecules. By counting the number of steps to bleach the ROIs to background, they were able to estimate the stoichiometry of the molecule. They verified the technique by applying it to molecules with different stoichiometries, from one to four. The method and variations on it have been successfully applied by numerous others (Das et al., 2007; Ji et al., 2008; Leake et al., 2006; Madl et al., 2011; Penna et al., 2008; Tombola et al., 2010).
We have recently applied the method to the stoichiometry of a membrane protein important in mammalian hearing, prestin (Hallworth & Nichols, 2012). Prestin is a molecule, only recently identified (Zheng et al., 2000), that is found uniquely in the plasma membrane of cochlear outer hair cells (for a review of prestin and outer hair cells and their roles in hearing, see Ashmore (2008)). Prestin plays a central role in mammalian hearing, as has been amply demonstrated by the hearing loss phenotypes of prestin knock-out and knock-in mouse models (Liberman et al., 2002; Dallos et al., 2008). As has happened before, the stoichiometry of prestin has been in dispute, with both dimer and tetramer configurations being advanced by Western blot analyses (Detro-Dassen et al., 2008; Zheng et al., 2006), a biophysical analysis (Wang et al., 2010), and an electron-density map of purified prestin protein (Mio et al., 2008). In this paper, we discuss how we applied single molecule imaging to the problem, compare our methods to others, describe our results, and we give practical suggestions to laboratories interested in applying the method to their systems.
Stepwise Bleaching of Single Molecules
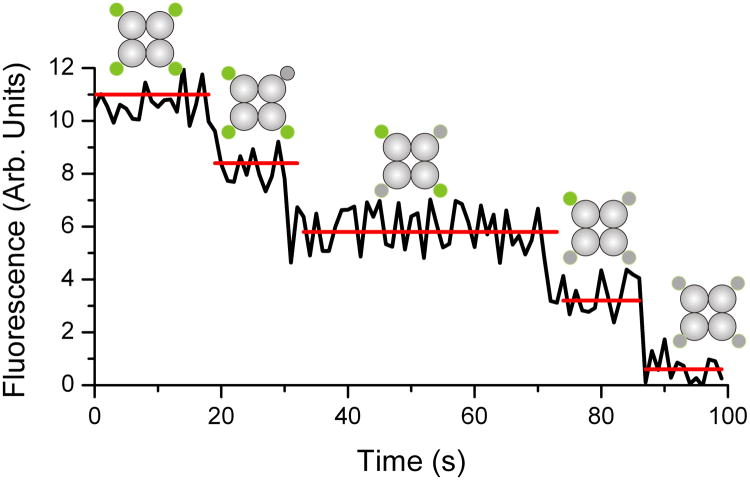
The concept behind stepwise bleaching analysis of single molecules is simple and is illustrated in Fig. 1. A single oligomer of the molecule in question, in which each subunit is labeled by a fluorophore, is isolated and imaged under continuous excitation. Most fluorophores are bleached by continuous, sufficiently-intense, excitation (Quantum Dots are perhaps the best-known exception to this observation). Under continuous excitation, the times at which individual fluorophores bleach are Poisson-distributed. Bleaching events will occur at different times from the start of excitation and can be distinguished with sufficiently sensitive instrumentation. Counting the number of bleaching events yields an estimate of the stoichiometry.
Figure 1.
The single-molecule subunit counting method. The figure is a hypothetical plot of the fluorescence intensity of a single tetrameric molecule, as a function of time, with each subunit covalently linked to a fluorophore, under continuous excitation sufficient to cause bleaching of the fluorophores. The fluorescence decreases in approximately equal amplitude steps unit background levels are reached. The molecular diagrams indicated the number of active fluorophores (depicted in green) at each stage. The number of steps (in this case four) yields the stoichiometry of the molecule.
The challenges to successful implementation of this method are: 1) to obtain sufficiently-sensitive instrumentation, 2) to ensure that the observations are truly of single molecules, and 3) to understand the results obtained. These aspects will be discussed in turn.
Instrumentation and Related Concerns
Instrumentation
The two most frequently-used methods of recording single molecule fluorescence are electron-multiplying charge coupled device cameras (EM-CCDs) and silicon avalanche photodiodes (APDs). EM-CCD cameras produce digital images that are limited in space by the number of pixels and in time by the exposure length required to capture enough photons for an image. APDs collect and respond to an entire image field, thus are most suitable for fields containing only a single molecule. They produce a digital signal, which can be integrated, and have a high bandwidth. Both EM-CCDs and APDs have very high quantum efficiency, which means that they can respond to nearly every photon collected. Whichever detector is used, it is essential to make as many photons as possible available to the detector. Thus, excess glass elements in the optical path, such as polarizers and Woollaston prisms, should be removed. We used an Andor Technology (Belfast, N. Ireland) DU-897E cooled back-thinned EM-CCD camera for the experiments described herein (quantum efficiency > 0.9 at 500 nm). Similar cameras were used by others (Das et al., 2007; Ji et al., 2008; Leake et al., 2006; Madl et al., 2011; Penna et al., 2008; Tombola et al., 2010; Ulbrich & Isacoff 2007). APDs have not to our knowledge been used in membrane protein stoichiometry experiments such as ours, but are popular in other areas of single molecule fluorescence studies (e.g., Karymov et al., 2007; Jiang et al., 2011).
Noise Sources
Single molecule images are small signals on a noisy background, so it is important to understand the sources of the noise. A leading manufacturer of EM-CCD cameras (Hamamatsu, Bridgewater, NJ) characterizes the sources of noise in this equation for the signal to noise ratio (SNR):
P is the noise associated with the photon flux, sometimes called “shot noise”, and is an unavoidable consequence of the natural variation of the photon flux arriving at the camera. Qe is the quantum efficiency of the camera's photosensitive elements, and t is the integration time. Dt is the background thermal noise associated with the camera's sensors (the “dark current”) – this can be dramatically reduced by cooling the CCD sensor. A 50% reduction in noise for every 10 °C reduction in temperature is claimed. However, for temperatures lower than -70°C, the noise reduction does not appear to justify the extra effort required (for example, ice water or even liquid nitrogen cooling systems), unless the other sources of noise are also very low. Nr is the read-out noise associated with the read operation at each pixel. It is inherent to the device, but fortunately modern cameras have minimized this parameter to the extent that it does not seem to be a factor.
Increasing the photon flux P will clearly improve SNR, but that requires increasing the excitation rate, which in this kind of experiment will then accelerate bleaching such that it is impossible to separate individual bleaching events. Increasing the gain does not help, because the readout noise and dark current noise will also be amplified. Prolonging the integration time t helps, but doubling the integration time only improves the SNR by only √2, so the law of diminishing returns applies. This is especially true if rapid bleaching events may become confused with slower events such as fluorophore movement. An important and often overlooked factor is B, the extraneous background illumination collected by the camera (not to be confused with biological background emission as a consequence of endogenous fluorophores). We found that, for a camera operating in the high gain low noise mode required for single molecule imaging, even a darkened room contributes significant background. Two simple modifications helped considerably. We conducted all image acquisition with the microscope covered by darkroom cloth. We also operated the data acquisition computer display at its lowest possible brightness setting.
Choice of Fluorophore and Expression System
Fluorescent proteins are the most practical fluorophores for studies such as these, because their stoichiometry per subunit is known with certainty, which would not be the case with a chemical linking procedure. We obtained a plasmid containing the prestin coding sequence coupled in-frame to enhanced green fluorescent protein (eGFP). eGFP is usually the best choice because of its high quantum yield and relative resistance to bleaching. Although our goal is to bleach the eGFP molecules, it is important to avoid bleaching as much as possible when setting up the experiment, for example, in finding the focal plane. Thus yellow and red FP variants are not as suitable, but may be considered if background in the eGFP emission band is a problem.
Our experience has been with mammalian expression systems such as Human Embryonic Kidney (HEK 293) cells or Chinese Hamster Ovary cells. In Ulbrich & Isacoff (2007), the Xenopus oocyte was used, but most other studies have used HEK 293 cells or similar systems. The use of oocytes requires direct injection of RNA into the oocyte rather than transfection with plasmid DNA, as for HEK 293 or similar systems. The oocyte has the advantage of high expression levels. However, the membrane is complex with many in-foldings and biological background from the oocyte contents is also quite high.
To TIRF or Not to TIRF
Observation of fluorescent proteins in membranes may seem like a natural application of TIRF imaging. Indeed, the reduced excitation levels afforded by TIRF help to reduce the rate of bleaching. However, TIRF systems suffer from fringing due to internal reflections of polarized laser light, and therefore the image field is usually unevenly illuminated. In our hands, this contributed to a greater scatter in the estimates of single step size, which led us to return to conventional mercury illumination for our experiments. In addition, the biological background-rejection advantages of TIRF imaging are less apparent in our isolated membrane fragment preparation, described later in this article, since the background-contributing cellular contents have presumably been removed.
Minimizing Pre-Bleaching
Although fluorophore bleaching is the goal of the experiment, it is important to minimize bleaching in the experimental set-up. This is partly to slow the rate of bleaching, so that the individual steps can be observed, but also to avoid bleaching in the brief period in which the correct focal plane is determined. For the experiments described here, we used the standard mercury source and a fluorescein filter cube, but we added a neutral density filter in the excitation path.
Criteria for Identification of Single Molecules
Criteria for Single Molecule Imaging
We adopted two criteria to assure us that our images were of single molecules. The first was that the single molecule image size was consistent with the expected size, given the optics of our system, as described previously. We also confirmed this image size using a non-biological system described later in this section. The second was that the images exhibit abrupt step decreases in fluorescence, consistent with bleaching, which is essentially instantaneous. This meant that in an image sequence the step decreases should occur over only one or two frames. In practice, this criterion had to slightly relaxed, because the noise levels partly obscured the transitions.
Calculating Single Molecule Image Size
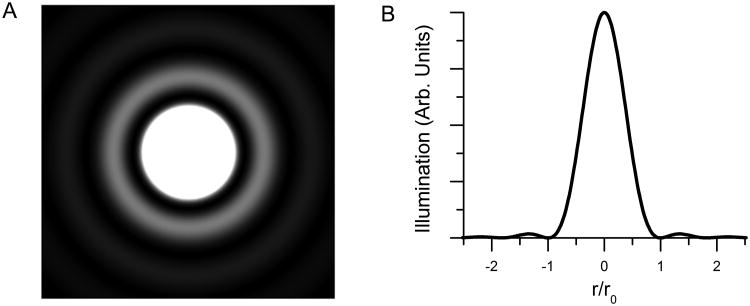
Because of diffraction, a point source of emission produces an image at the focal plane that is not a single point but instead is a cone of illumination surrounded by weaker concentric rings. The illumination pattern I is described by
where r is the radius from the centroid, Io is the intensity at r = 0, J1 is a Bessel function of the first kind, and ro is the radius where the intensity first drops to zero. The dimensions of this illumination pattern, called an Airy disk, are determined by the optical properties of the microscope, primarily the numerical aperture of the objective. The radius ro of the first dark ring is given by
where na is the objective numerical aperture and λ is the wavelength Fig. 2A shows a simulated image of an Airy disk, and Fig. 2B is a plot of the profile of that image. As is clear from Fig. 2A, most of the illumination is confined to the region inside the first concentric dark ring. For our experiments, in which we used eGFP as the fluorophore, the numerical aperture was 1.4 and the emission maximum of eGFP (λ) is 509 nm. We therefore calculated r to be 221.7 nm. Thus the image of a single fluorophore in our system should be a disk of diameter about 450 nm.
Figure 2.
The effect of diffraction on the image of a point fluorescence source. A) Simulation of the image of a single source, in the form of an Airy disk computed using the formula given in the text. B) Plot of illumination of the Airy disk as a function of normalized radial distance from the centroid, normalized to r0.
Empirical Determination of Single Molecule Image Size
As a test of single molecule image size, we obtained polyethylene-coated coverslips to which a low density of biotin had been covalently attached (BIO_01, Microsurfaces Inc., Austin, TX; 10-100 molecules per μm2) (Fig. 3). We exposed them briefly (3 sec) to a low concentration (0.1 μg/ml) of streptavidin conjugated to Alexa Fluor 488 (Invitrogen, Carlsbad, CA) in high-purity water. They were then rinsed and mounted inverted in high-purity water on a glass slide for imaging. The manufacturer states that there are two to four Alexa Fluor 488 fluorophores per streptavidin molecule. Even at the low density of streptavidin binding sites, we found that we had to pre-bleach the slides for 30-60 seconds to be able to distinguish points of potential single molecule fluorescence.
Figure 3.
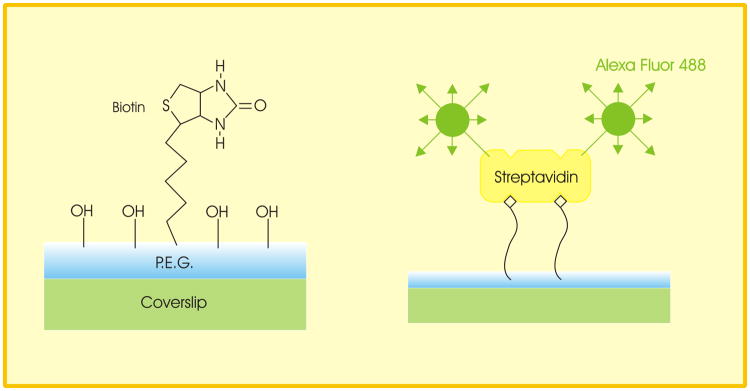
The use of biotin-coated coverslips to obtain a preparation of single fluorescent molecules for the determination of single molecule image size (adapted from the manufacturer's brochure).
We then exposed the slide to continuous excitation and recorded images of a 128 by 128 pixel field (19.2 by 19.2 μm, as determined using a stage micrometer) for exposure durations of 0.2 s and frame rates of 5/s, typically for 500 frames. An example of our images is shown in Fig. 4A. The points could be enclosed in a 5 × 5 pixel ROI (750 nm on a side) but not a 3 × 3 ROI (450 nm on a side) (Fig. 4B). This finding was consistent with our expectations of single molecule image size, as described earlier, given that a single molecule would not necessarily be exactly centered on a pixel.
Figure 4.
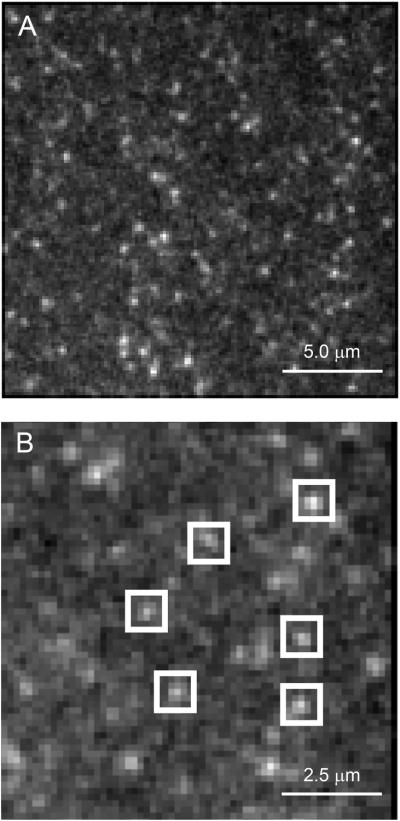
Images of single Alexa Fluor 488 molecules prepared by the method described in the text. A) Full field image of 128 by 128 pixels. B) Expanded view of (A) showing ROIs superimposed over putative single molecule images. Adapted from Hallworth & Nichols (2012).
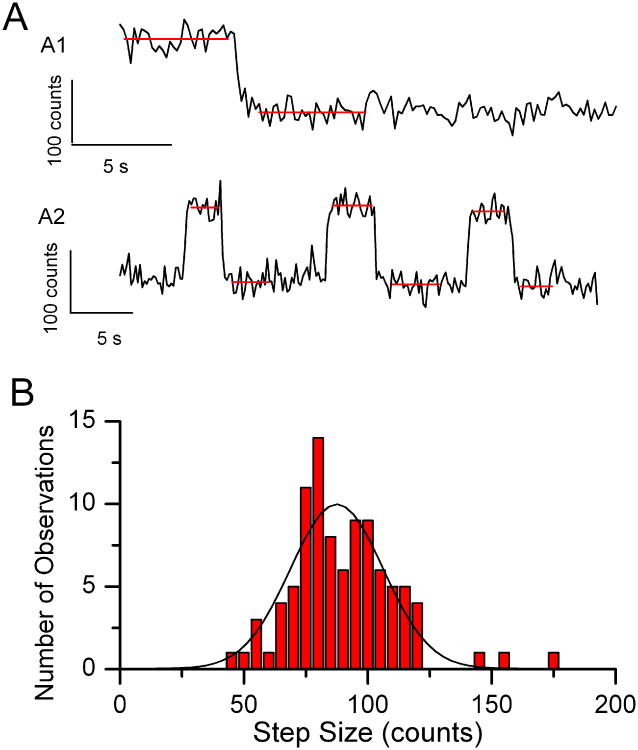
When analyzed, the points were found to exhibit step decreases in fluorescence in one or two frames, consistent with the bleaching of single fluorophores. Examples are shown in Fig. 5A. Occasionally we saw two discrete steps of equal amplitude, which is consistent with the occurrence of two Alexa Fluor 488 molecules in the same ROI. The example in Fig. 5A2 was particularly reassuring. It shows equal-amplitude on-off fluorescence transitions. This phenomenon, called blinking, is characteristic of the Alexa Fluor dyes (Aitken et al., 2008), and of many other small-molecule dyes.
Figure 5.
Analysis of single molecule Alexa Fluor 488 images. A) Examples of time plots of single molecule Alexa Fluor 488 fluorescence. Red lines indicate computed averages before and after each bleaching event. The scale bars represent 5 s (time) and 100 counts (amplitude). B) Histogram of 95 observed fluorescence step decreases in a single Alexa Fluor 488 experiment. The fitted Gaussian distribution parameters are xc = 87.49, w = 37.48, A = 467.13 (R2 = 0.86). Adapted from Hallworth & Nichols (2012).
Step amplitudes were then determined from the difference between the average fluorescence levels before and after the steps, and results were stored in text files. The computed levels are indicated in Figs. 5A1 and 5A2 by red lines. The next step in determining whether the observed steps are single molecule bleaching events is to plot them in histogram form. The distribution should be well fit by a single Gaussian distribution, which was the case in our observations (Fig. 5B, from a single experiment). A skewed distribution would indicate some kind of systematic error in measuring the amplitudes, such as missing small amplitude events.
Imaging of Single Prestin Molecules
We then applied our method to imaging single molecules of prestin-eGFP in the membranes of HEK cells. We found that our protein product (prestin-eGFP) was well synthesized and incorporated into HEK cell membranes. Fluorescence was predominantly found in large areas that were clearly larger than single molecules, but fluorescent points consistent in size with single molecules could also be found in the images. However, these putative single molecules were too often mobile. We thus could not decide if a molecule had been bleached or endocytosed. We then adopted an approach that had previously been used for the examination of membrane-bound proteins by atomic force microscopy (Ziegler et al., 1998, as adapted by Murakoshi et al., 2006; Fig. 6). Cells were exposed to a chilled hypoosmotic buffer maintained in the cold for 30 mins (4 mM PIPES, 30 mM KCl, pH 6.2, 80 mOsm). The cells were then subjected repeatedly to a stream of the same buffer delivered via a blunted 28 gauge hypodermic needle. This lysed the cells and removed their contents, leaving behind membrane fragments. No intact cells could be observed on the culture dish after this treatment. However, examination under fluorescence revealed immobilized discrete points of fluorescence that were suitable for experimentation.
Figure 6.
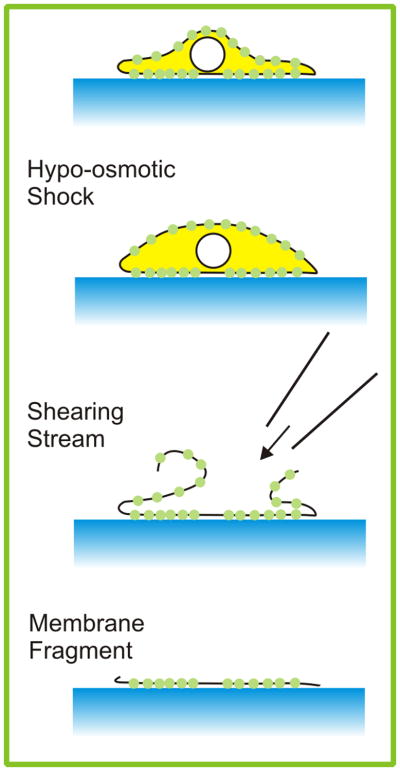
The osmotic shock and lysis method of preparing membrane fragments.
Higher electron multiplier gain and lower temperatures in the camera electronics had to be used to obtain single molecule images, but this was expected given the lower quantum yield of eGFP. eGFP also bleached much faster than Alexa Fluor 488, thus we reduced the excitation levels by using a neutral density filter in the excitation path. This of course further reduced the observable step size, but made it possible to observe bleaching in discrete steps. Although many fluorescent points were clearly larger than the single molecule image size determined by the Alexa Fluor 488 experiment, there were also many points that could fit into the 5 × 5 pixel ROI.
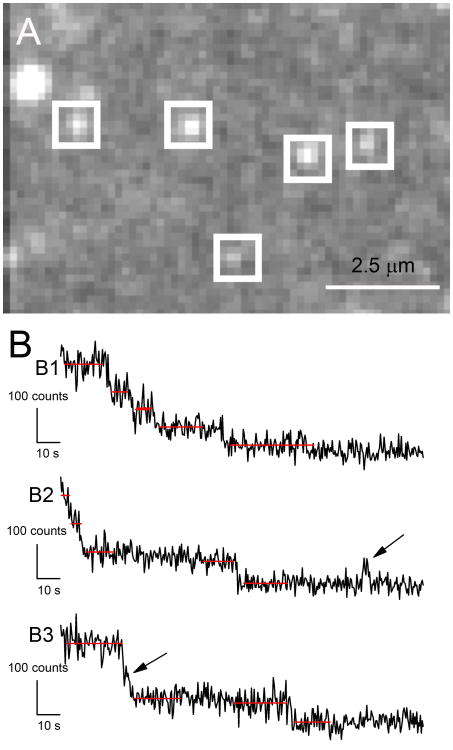
Fig 7A shows an image field of prestin eGFP molecules. Fig. 7B shows representative examples of the fluorescence associated with putative molecules as functions of time. Although the records are clearly noisier than those in Fig. 5, discrete rapid step decreases in fluorescence consistent with bleaching were readily observable. We commonly observed four (Fig. 7B1) or three (Fig. 7B2) steps to background levels, but sometimes two and even one. An occasional blink event was seen (arrow, Fig. 7B2). Larger steps were also observed (Fig. 7B3), but, on inspection, a transient dwell at an intermediate level could be observed (arrow), which indicated that the apparent single step was in fact two steps.
Figure 7.
Single molecules observations of prestin-eGFP. A) Punctate fluorescent points observed in HEK cell membranes after hypoosmotic lysis, showing ROIs demarcating putative points of single-molecule fluorescence. The image, of 128 × 128 pixels, represents 19.2 × 19.2 μm2 at the culture dish. B) Representative time courses of fluorescence of single-molecule ROIs in the isolated membrane of a prestin-transfected cell. Red lines indicate computed averages before and after each bleaching event. Arrow in record B1 indicates on-blink. Arrow in record B2 indicates a transient dwell at an intermediate level. Adapted from (Hallworth & Nichols, 2012).
Understanding the Results
Analysis Software
Camera vendors generally provide adequate software for the acquisition of images, but their analysis functions are not in our experience versatile enough to perform the kinds of analyses used in these experiments. Commercial packages such as Image Pro (Media Cybernetics, Bethesda, MD) and Igor Pro (Wavemetrics, Lake Oswego, OR) offer more functions, but have not seen wide application to single molecule experiments (but see Das et al. (2007)). Laboratories have therefore generally written their own procedures.
We exported our image sequences as .TIF stacks and imported them into MATLAB (The Mathworks, Natick, MA) where they were analyzed using code we had written ourselves. The images contained discrete fluorescent points potentially corresponding to single molecules, as well as larger areas that were assumed to be macromolecular assemblies. The loaded images were subjected to a Gaussian spatial filter to reduce the noise before they were displayed. The code enabled thresholding and gain adjustment of the images and permitted the images to be viewed in sequence, which we found to be important in separating transient high-value points from persistent fluorescent points that could be single molecules.
The fluorescence values in single 5 × 5 pixel ROIs were then calculated and plotted (in arbitrary units) as a function of time in a separate window, with upper and lower coordinates that could be manipulated for ease of viewing. Putative single molecule points were superimposed on background fluorescence that fluctuated both temporally and spatially. Provision was made for subtraction of background fluorescence, using values determined from an ROI separate from but close to that of potential single molecules. From the time plot, the average fluorescence values before and after the bleaching steps were calculated from segments selected by cursors, and the difference calculated to yield the step size.
We did not find that temporal low-pass filtering of the fluorescence time records helped in discriminating the steps. However, we found the zeroing the values of the ROI corner points (0,0; 0,4; 4,0; 4,4) reduced the noise without sacrificing the amplitude of the steps. The corner points are further from the centroid of the image than the Airy disk radius, and therefore do not contribute much information. This approach was taken even further by Ulbrich & Isacoff (2007), who arbitrarily zeroed individual pixels within their 9 × 9 ROI to reduce the noise even further.
MATLAB is a powerful program but is far from ideal as a user interface. Mathematica (Wolfram Research, Champaign, IL) has also been used (Ulbrich & Isacoff (2007)). Another application that could support interactive analysis is National Instruments LabVIEW (Austin, TX) with its Signal Processing extension.
Determination of Step Count
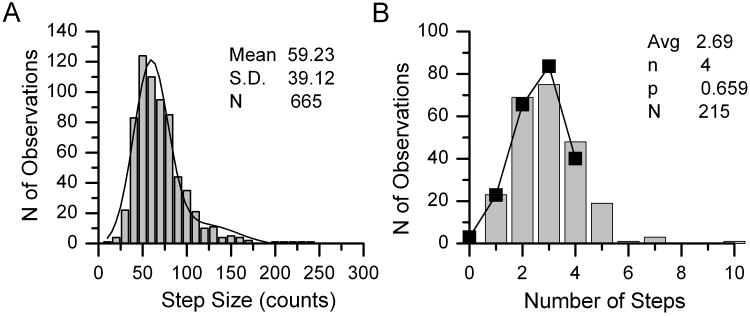
Determination of the step count proceeded in two stages. We first accumulated all step size measurements in histogram form, as in Fig. 8A. For prestin, the histogram was well fit by a Gaussian distribution with mean μ, standard deviation σ, and was slightly better fit by adding a second Gaussian of mean 2μ, standard deviation √2σ. We interpreted this to suggest that some double steps had been incorrectly scored as single steps.
Figure 8.
Representative example of the analysis of single molecules of prestin-eGFP. Histograms of step amplitudes (A) and step counts (B). The binomial fit parameters are given on the figure. Adapted from Hallworth & Nichols (2012).
We then re-examined all the single molecule records individually and counted the number of steps to reach background fluorescence levels, by inspection. We used our estimate of the mean step size μ to resolve any ambiguities. The results were plotted as a histogram of step counts, an example of which is shown in Fig. 8B. As an alternate approach to the step count, the difference between the starting fluorescence level and the final fluorescence level can be divided by the mean fluorescence step size, and the result rounded up or down to an integer. In our hands, the two analyses yielded almost identical results over a large population of putative single molecules.
Fitting the Binomial Distribution
Ideally, every dimer should bleach in two steps, every trimer in three, and so on. In our experiment and those of others, the number of steps was variable, and the mean step count was substantially less than the presumed stoichiometry. One explanation for this is that some fluorophores may be bleached during acquisition of the focal plane. Another is that a fraction of fluorescent proteins do not fluoresce. Thus the experiment resembles a binomial sampling procedure, in which a small sample of n items is removed without replacement from a larger population, some of which are defective. If the probability that the individual item is defective is q, the probability that it is not defective is p, which is 1–q. Our observations can then be understood if each single molecule is thought of as a binomial sample, size n, with q the probability that the fluorophore is defective. The expected distribution of step counts for N single molecule observations is then given by:
where A(x) is the predicted number of single molecules with step count x, N is the number of single molecules observed, n is the presumed stoichiometry, and p is the fraction of fluorophores that are active (0 < p <1).
As is clear from Fig. 8, we observed step counts up to seven. However, most of the observations were in bins 1 to 4. It was unlikely that the stoichiometry was less than four, given the number of observations of step counts of four. The assumption of either n = 4 or 5 appeared reasonable. To determine the correct stoichiometry, we calculated the mean step count μn for each assumed n as:
where A′(x) is the observed number of molecules with step count x.
The mean of a binomial sampling distribution μn is equal to np. For an assumed stoichiometry n, the probability p is then calculated as μn/n.
How to Distinguish Between Possible Stoichiometries
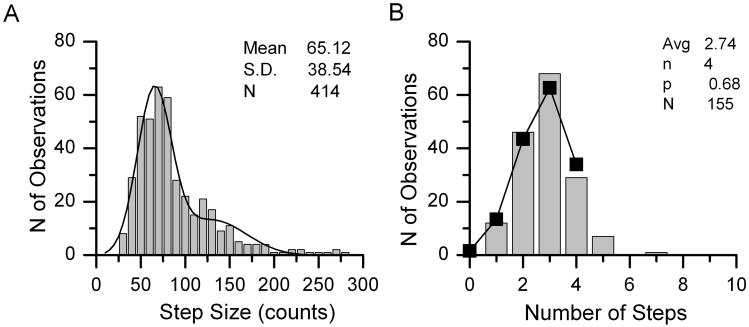
We therefore repeated the experiment with an oligomeric molecule of known stoichiometry. We obtained a plasmid encoding the A3 subunit of the human cyclic nucleotide-gated sodium channel (CNGA3, from cone photoreceptors), again coupled C-terminal to eGFP. While the CNG proteins form tetrameric ion channels composed of A and B subunits (Liu et al., 1996), CNG3A subunits form functional tetrameric ion channels in the absence of B subunits (Bonigk et al., 1993; Kaupp et al., 1989). We repeated the prestin experiment with CNGA3-eGFP and in two trials we obtained mean step counts of 2.59 and 2.74 (Fig. 9). Since CNGA3-eGFP is known to be a tetramer, we were safe to assume n = 4, and the calculated p values were then 0.65 and 0.68 (average 0.665). In the prestin-eGFP experiments, for the assumption of n = 4 we obtained p values of 0.659, 0.68, and 0.678 in three trials (average 0.672), very close to the values obtained for CNGA3-eGFP, and the mean step counts for n = 4 were 2.69, 2,71, and 2.71. Using n = μ/p and this independent estimate of p, the best (nearest integer) estimate is that n = 4 for prestin-eGFP, i.e., prestin in its native state is a tetramer.
Figure 9.
Representative example of the analysis of single molecules of CNGA3-eGFP. Histograms of step amplitudes (A) and step counts (B). The binomial fit parameters are given on the figure. Adapted from Hallworth & Nichols (2012).
Discussion
Alternative Methods to Obtain the Stoichiometry
Although most studies listed above have used the step counting procedure similar to that of Ulbrich & Isacoff (2007), a few variations have also appeared. Madl et al. (2011) averaged the fluorescence from putative single molecules without bleaching and plotted histograms of the values, which were then fit by functions of multiple Gaussian distributions, up to four. This method has the disadvantage that it becomes ambiguous at higher n of subunits. For example, is the better fit at higher n real or simply the outcome of using more free parameters? It should also be possible to determine the fluorescence of a known monomer and then divide the value into the observed fluorescence of oligomers, without actually observing stepwise bleaching. We tried this approach but found that visualizing the steps gave us more confidence in the underlying assumption that we were observing single molecules.
Are Other Stoichiometries Possible for Our Data?
We assume that ROIs that exhibited greater than four steps had contained two or more prestin molecules. For the same average step count, the assumptions of n = 4 or n = 5 yielded p values of 0.672 and 0.51 respectively. Even lower p values would be obtained if n were assumed to be greater than five. A p value of 0.5 would imply that half of all eGFP molecules were dark, either because of failure to fluoresce or because they had been bleached during the set up. This is clearly possible, but after all possible precautions have been taken to reduce prior bleaching, including the use of the lowest possible excitation levels, it would be disappointing. Thus our use of the positive control CNGA3-eGFP is decisive in distinguishing between these possibilities.
Depending on the noise level, is likely that our method is limited to low stoichiometries. The noise variance associated with each fluorophore sums, so that at larger n the noise greatly exceeds the step size. As we described above, once all proper precautions have been taken, the major source of noise is shot noise, which is intrinsic to the fluorophore, so further amplification does nothing to help. In our experiments, the steps were reasonably unambiguous to the eye. Repeated re-scoring of data sets produced essentially the same overall results. A variety of post-hoc mathematical approaches to noise reduction have been applied including a forward-backward non-linear filtering algorithm (Chung & Kennedy, 1991) and a change-point finding algorithm that detects level transitions (Watkins and Yang, 2005). If noise prevents reliable determination of step amplitudes, hidden Markov methods are also available (McKinney et al., 2006). These methods are somewhat daunting to implement, and we have not studied them in detail, but they have the advantage that they provide unbiased estimates.
How Many eGFP Molecules Are Dark?
Our p value of approximately 0.67 implies that around 33% of all eGFPs in our experiment were dark, either due to failure to fluoresce or because they were inadvertently bleached in the process of establishing the focal plane. Our number is greater than that reported by others. Ulbrich & Isacoff (2007) reported it as 20% as did Ji et al. (2008). Madl et al. (2011) reported 12%, but we have discussed previously the reasons to be wary of those results. The difference may reflect the different imaging procedures or different culture conditions.
Stoichiometries Smaller than Three
The assumption of a binomial process underlying the observations makes physical sense, but our estimates of the parameters are inexact. The binomial model predicts that we should be able to make some observations at x = 0, but of course we cannot, because a molecule with all inactive fluorophores would be invisible. The value of N is therefore an underestimate. The error is small for the tetramer case and large p, but will become more significant at low n, especially n = 2. It then becomes imperative to have on hand a positive control molecule of n = 3 or greater, as we did. This molecule is used to provide an independent estimate of p, which can then be used to calculate n.
The Consequences for Prestin Studies
Our study has helped to resolve the outstanding question of prestin subunit stoichiometry. We are now applying it to other members of the membrane protein family (Slc26) of which prestin is a member, in the hope of determining if self-association motifs are in common. Our result does not, however, tell us whether the prestin subunits function independently or cooperatively, about which there is experimental disagreement (Detro-Dassen et al., 2008; Wang et al., 2010). Nor does it help us understand the relationship of prestin structure to its function, or even precisely what its function is, although clearly our results is a necessary preliminary. We are confident that single molecule fluorescence approaches will contribute to the resolution of these questions.
Acknowledgments
The work described here was supported by the State of Nebraska LB 692 administered by Creighton University and N.S.F.-Nebraska E.P.S.Co.R. EPS-0701892 to R.H., and National Institutes of Health GM085776 to M.G.N. Research was conducted in a facility constructed with support from Research Facilities Improvement Program C06 RR17417-01 from the late lamented N.C.R.R. of N.I.H. We thank Max Ulrich and Ehud Isacoff for initial encouragement and advice, Peter Dallos and Jacqueline Tanaka for plasmid constructs, and David Z.Z. He, Heather Jensen-Smith, and our expert reviewers for comments on the manuscript. We also thank Fang Xiang for statistical advice.
Contributor Information
Richard Hallworth, Department of Biomedical Sciences, Creighton University School of Medicine, Omaha, Nebraska 68178, USA.
Michael G. Nichols, Department of Physics, Creighton University, Omaha, Nebraska 68178, USA
References
- Aitken CE, Marshall RA, Puglisi JD. An oxygen scavenging system for improvement of dye stability in single-molecule fluorescence experiments. Biophys J. 2008;94(5):1826–35. doi: 10.1529/biophysj.107.117689. [DOI] [PMC free article] [PubMed] [Google Scholar]
- Ashmore JF. Cochlear outer hair cell motility. Physiol Rev. 2008;88(1):173–210. doi: 10.1152/physrev.00044.2006. [DOI] [PubMed] [Google Scholar]
- Bats C, Groc L, Choquet D. The interaction between Stargazin and PSD-95 regulates AMPA receptor surface trafficking. Neuron. 2007;53(5):719–34. doi: 10.1016/j.neuron.2007.01.030. [DOI] [PubMed] [Google Scholar]
- Bonigk W, Altenhofen W, Muller F, Dose A, Illing M, Molday RS, Kaupp UB. Rod and cone photoreceptor cells express distinct genes for cGMP-gated channels. Neuron. 1993;10(5):865–77. doi: 10.1016/0896-6273(93)90202-3. [DOI] [PubMed] [Google Scholar]
- Chung SH, Kennedy RA. Forward-backward non-linear filtering technique for extracting small biological signals from noise. J Neurosci Methods. 1991;40(1):71–86. doi: 10.1016/0165-0270(91)90118-j. [DOI] [PubMed] [Google Scholar]
- Dallos P, Wu X, Cheatham MA, Gao J, Zheng J, Anderson CT, Jia S, Wang X, Cheng WH, Sengupta S, He DZ, Zuo J. Prestin-based outer hair cell motility is necessary for mammalian cochlear amplification. Neuron. 2008;58(3):333–9. doi: 10.1016/j.neuron.2008.02.028. [DOI] [PMC free article] [PubMed] [Google Scholar]
- Das SK, Darshi M, Cheley S, Wallace MI, Bayley H. Membrane protein stoichiometry determined from the step-wise photobleaching of dye-labeled subunits. Chembiochem. 2007;8(9):994–9. doi: 10.1002/cbic.200600474. [DOI] [PubMed] [Google Scholar]
- Detro-Dassen S, Schanzler M, Lauks H, Martin I, zu Berstenhorst SM, Nothmann D, Torres-Salazar D, Hidalgo P, Schmalzing G, Fahlke C. Conserved dimeric subunit stoichiometry of SLC26 multifunctional anion exchangers. J Biol Chem. 2008;283(7):4177–88. doi: 10.1074/jbc.M704924200. [DOI] [PubMed] [Google Scholar]
- Ehlers MD, Heine M, Groc L, Lee MC, Choquet D. Diffusional trapping of GluR1 AMPA receptors by input-specific synaptic activity. Neuron. 2007;54(3):447–60. doi: 10.1016/j.neuron.2007.04.010. [DOI] [PMC free article] [PubMed] [Google Scholar]
- Ehrensperger MV, Hanus C, Vannier C, Triller A, Dahan M. Multiple association states between glycine receptors and gephyrin identified by SPT analysis. Biophys J. 2007;92(10):3706–18. doi: 10.1529/biophysj.106.095596. [DOI] [PMC free article] [PubMed] [Google Scholar]
- Hallworth R, Nichols MG. Prestin in HEK cells is an obligate tetramer. J Neurophysiol. 2012;107(1):5–11. doi: 10.1152/jn.00728.2011. [DOI] [PMC free article] [PubMed] [Google Scholar]
- Ji W, Xu P, Li Z, Lu J, Liu L, Zhan Y, Chen Y, Hille B, Xu T, Chen L. Functional stoichiometry of the unitary calcium-release-activated calcium channel. Proc Natl Acad Sci U S A. 2008;105(36):13668–73. doi: 10.1073/pnas.0806499105. [DOI] [PMC free article] [PubMed] [Google Scholar]
- Jiang Y, Douglas NR, Conley NR, Miller EJ, Frydman J, Moerner WE. Sensing cooperativity in ATP hydrolysis for single multisubunit enzymes in solution. Proc Natl Acad Sci U S A. 2011;108(41):16962–7. doi: 10.1073/pnas.1112244108. [DOI] [PMC free article] [PubMed] [Google Scholar]
- Joo C, McKinney SA, Nakamura M, Rasnik I, Myong S, Ha T. Real-time observation of RecA filament dynamics with single monomer resolution. Cell. 2006;126(3):515–27. doi: 10.1016/j.cell.2006.06.042. [DOI] [PubMed] [Google Scholar]
- Karymov MA, Krasnoslobodtsev AV, Lyubchenko YL. Dynamics of synaptic SfiI-DNA complex: single-molecule fluorescence analysis. Biophys J. 2007;92(9):3241–50. doi: 10.1529/biophysj.106.095778. [DOI] [PMC free article] [PubMed] [Google Scholar]
- Kaupp UB, Niidome T, Tanabe T, Terada S, Bonigk W, Stuhmer W, Cook NJ, Kangawa K, Matsuo H, Hirose T, Miyata T, Numa S. Primary structure and functional expression from complementary DNA of the rod photoreceptor cyclic GMP-gated channel. Nature. 1989;342(6251):762–6. doi: 10.1038/342762a0. [DOI] [PubMed] [Google Scholar]
- Kozuka J, Yokota H, Arai Y, Ishii Y, Yanagida T. Dynamic polymorphism of single actin molecules in the actin filament. Nat Chem Biol. 2006;2(2):83–6. doi: 10.1038/nchembio763. [DOI] [PubMed] [Google Scholar]
- Leake MC, Chandler JH, Wadhams GH, Bai F, Berry RM, Armitage JP. Stoichiometry and turnover in single, functioning membrane protein complexes. Nature. 2006;443(7109):355–8. doi: 10.1038/nature05135. [DOI] [PubMed] [Google Scholar]
- Liberman MC, Gao J, He DZ, WU X, Jia S, Zuo J. Prestin is required for electromotility of the outer hair cell and for the cochlear amplifier. Nature. 2002;419(6904):300–4. doi: 10.1038/nature01059. [DOI] [PubMed] [Google Scholar]
- Liu DT, Tibbs GR, Siegelbaum SA. Subunit stoichiometry of cyclic nucleotide-gated channels and effects of subunit order on channel function. Neuron. 1996;16(5):983–90. doi: 10.1016/s0896-6273(00)80121-x. [DOI] [PubMed] [Google Scholar]
- Liu S, Bokinsky G, Walter NG, Zhuang X. Dissecting the multistep reaction pathway of an RNA enzyme by single-molecule kinetic “fingerprinting”. Proc Natl Acad Sci U S A. 2007;104(31):12634–9. doi: 10.1073/pnas.0610597104. [DOI] [PMC free article] [PubMed] [Google Scholar]
- Madl J, Weghuber J, Fritsch R, Derler I, Fahrner M, Frischauf I, Lackner B, Romanin C, Schutz GJ. Resting state Orai1 diffuses as homotetramer in the plasma membrane of live mammalian cells. J Biol Chem. 2011;285(52):41135–42. doi: 10.1074/jbc.M110.177881. [DOI] [PMC free article] [PubMed] [Google Scholar]
- McKinney SA, Joo C, Ha T. Analysis of single-molecule FRET trajectories using hidden Markov modeling. Biophys J. 2006;91(5):1941–51. doi: 10.1529/biophysj.106.082487. [DOI] [PMC free article] [PubMed] [Google Scholar]
- Mio K, Kubo Y, Ogura T, Yamamoto T, Arisaka F, Sato C. The motor protein prestin is a bullet-shaped molecule with inner cavities. J Biol Chem. 2008;283(2):1137–45. doi: 10.1074/jbc.M702681200. [DOI] [PubMed] [Google Scholar]
- Murakoshi M, Gomi T, Iida K, Kumano S, Tsumoto K, Kumagai I, Ikeda K, Kobayashi T, Wada H. Imaging by atomic force microscopy of the plasma membrane of prestin-transfected Chinese hamster ovary cells. J Assoc Res Otolaryngol. 2006;7(3):267–78. doi: 10.1007/s10162-006-0041-z. [DOI] [PMC free article] [PubMed] [Google Scholar]
- Myong S, Rasnik I, Joo C, Lohman TM, Ha T. Repetitive shuttling of a motor protein on DNA. Nature. 2005;437(7063):1321–5. doi: 10.1038/nature04049. [DOI] [PubMed] [Google Scholar]
- Penna A, Demuro A, Yeromin AV, Zhang SL, Safrina O, Parker I, Cahalan MD. The CRAC channel consists of a tetramer formed by Stim-induced dimerization of Orai dimers. Nature. 2008;456(7218):116–20. doi: 10.1038/nature07338. [DOI] [PMC free article] [PubMed] [Google Scholar]
- Schuler B, Eaton WA. Protein folding studied by single-molecule FRET. Curr Opin Struct Biol. 2008;18(1):16–26. doi: 10.1016/j.sbi.2007.12.003. [DOI] [PMC free article] [PubMed] [Google Scholar]
- Tombola F, Ulbrich MH, Kohout SC, Isacoff EY. The opening of the two pores of the Hv1 voltage-gated proton channel is tuned by cooperativity. Nat Struct Mol Biol. 2010;17(1):44–50. doi: 10.1038/nsmb.1738. [DOI] [PMC free article] [PubMed] [Google Scholar]
- Ulbrich MH, Isacoff EY. Subunit counting in membrane-bound proteins. Nat Methods. 2007;4(4):319–21. doi: 10.1038/NMETH1024. [DOI] [PMC free article] [PubMed] [Google Scholar]
- Wang X, Yang S, Jia S, He DZ. Prestin forms oligomer with four mechanically independent subunits. Brain Res. 2010;1333:28–35. doi: 10.1016/j.brainres.2010.03.070. [DOI] [PMC free article] [PubMed] [Google Scholar]
- Watkins LP, Yang H. Detection of intensity change points in time-resolved single-molecule measurements. J Phys Chem B. 2005;109:617–28. doi: 10.1021/jp0467548. [DOI] [PubMed] [Google Scholar]
- Yildiz A, Forkey JN, McKinney SA, Ha T, Goldman YE, Selvin PR. Myosin V walks hand-over-hand: single fluorophore imaging with 1.5-nm localization. Science. 2003;300(5628):2061–5. doi: 10.1126/science.1084398. [DOI] [PubMed] [Google Scholar]
- Zheng J, Du GG, Anderson CT, Keller JP, Orem A, Dallos P, Cheatham M. Analysis of the oligomeric structure of the motor protein prestin. J Biol Chem. 2006;281:19916–19924. doi: 10.1074/jbc.M513854200. [DOI] [PubMed] [Google Scholar]
- Zheng J, Shen W, He DZ, Long KB, Madison LD, Dallos P. Prestin is the motor protein of cochlear outer hair cells. Nature. 2000;405(6783):149–55. doi: 10.1038/35012009. [DOI] [PubMed] [Google Scholar]
- Ziegler U, Vinckier A, Kernen P, Zeisel D, Biber J, Semenza G, Murer H, Groscurth P. Preparation of basal cell membranes for scanning probe microscopy. FEBS Lett. 1998;436(2):179–84. doi: 10.1016/s0014-5793(98)01118-1. [DOI] [PubMed] [Google Scholar]


