

Abstract
Dichloroacetate (DCA), a chemical relevant to environmental science and allopathic medicine, is dehalogenated by the bifunctional enzyme glutathione transferase zeta (GSTz1) maleylacetoacetate isomerase (MAAI), the penultimate enzyme in the phenylalanine/tyrosine catabolic pathway. The authors postulated that polymorphisms in GSTz1/MAAI modify the toxicokinetics of DCA. GSTz1/MAAI haplotype significantly affected the kinetics and biotransformation of 1,2-13C-DCA when it was administered at either environmentally (μg/kg/d) or clinically (mg/kg/d) relevant doses. GSTz1/MAAI haplotype also influenced the urinary accumulation of potentially toxic tyrosine metabolites. Atomic modeling revealed that GSTz1/MAAI variants associated with the slowest rates of DCA metabolism induced structural changes in the enzyme homodimer, predicting protein instability or abnormal protein-protein interactions. Knowledge of the GSTz1/MAAI haplotype can be used prospectively to identify individuals at potential risk of DCA’s adverse side effects from environmental or clinical exposure or who may exhibit aberrant amino acid metabolism in response to dietary protein.
Keywords: dichloroacetate, glutathione transferase zeta, maleylacetoacetate isomerase, pharmacogenetics, toxicogenetics, tyrosine metabolism
INTRODUCTION
The xenobiotic dichloroacetate (DCA) is ubiquitous in our biosphere as a product of water chlorination and as a metabolite of certain industrial solvents and pharmaceuticals.1 As such, it has generated interest among environmental scientists as a potential human health hazard. However, DCA has long been used as an investigational drug for the treatment of several acquired or congenital disorders of intermediary metabolism, particularly genetic mitochondrial diseases,2,3 which have a frequency in the general population of >1 in 5000.4 Interest in its therapeutic potential has recently intensified, based on reports of its selective proapoptotic and antiproliferative actions in human cancers5–15 and in pulmonary arterial hypertension16–19 that have led to several early phase clinical trials (E. D. Michelakis, personal communication, 2010).20–26 In turn, the possibility of increased long-term exposure to DCA for the treatment of both rare and common diseases has heightened attention about its pharmacokinetics, biotransformation, and chronic safety in humans.
DCA is dehalogenated to glyoxalate, a naturally occurring compound in mammals, by the zeta-1 family isoform of cytosolic glutathione transferase (GSTz1).27 GSTz1 is identical to maleylacetoacetate isomerase (MAAI), the penultimate enzyme of the phenylalanine/tyrosine catabolic pathway28 (Figure 1). DCA inhibits GSTz1/MAAI, which leads to a marked decrease in its plasma clearance.1,29 Enzyme inhibition by DCA also results in the accumulation of the potentially hepatotoxic tyrosine intermediates maleylacetoacetate and maleylacetone30 and of delta-aminolevulinate, a precursor of heme synthesis that has been associated with neurotoxic effects, including peripheral neuropathy.28 Reversible increases in serum transaminases and reversible peripheral neuropathy have been reported in association with chronic DCA exposure.1,31 Although the plasma clearance of DCA has been demonstrated in rats and humans to be inversely related to age,32 there remains marked variability in both the clinical pharmacokinetics and toxicity of the drug that cannot be explained by age alone.
Figure 1.

Bifunctionality of glutathione transferase zeta (A)/maleylacetoacetate isomerase (B) (GSTz1/MAAI). See text for details.
The human GSTz1/MAAI gene is located on chromosome 14q24.3. Three nonsynonymous single-nucleotide polymorphisms (SNPs) have been reported for GSTz1/MAAI that show different activity toward DCA and certain other xenobiotic haloacids.33 The allele and haplotype frequencies for the known SNPs are known to vary among racial and ethnic groups.2 In vitro studies using purified proteins corresponding to the 4 haplotypes revealed the rare KRT haplotype to have 10-fold higher Km and Vmax values for DCA and glutathione compared to the other haplotypes. This finding suggested that humans who possess the KRT variant might exhibit a markedly different pharmaco-kinetic and toxicological profile to DCA than would those who possessed the more common haplotypes. We tested this hypothesis by determining the relative effect of the GSTz1/MAAI haplotype on the kinetics of DCA and on tyrosine metabolism in healthy adults exposed to short-term administration of DCA at both environmental and clinically relevant concentrations. We compared these findings to those obtained from patients with genetic mitochondrial diseases who participated in a clinical trial of chronic DCA treatment.
METHODS
Materials
Crystalline sodium 1,2-13C-DCA (99% pure) was custom synthesized (Cambridge Isotope Laboratories, Cambridge, Massachusetts). Crystalline sodium 12C-DCA (99% pure) was purchased from TCI America (Portland, Oregon). Other chemicals and materials were obtained from previously reported sources.29
Clinical Studies
All studies were approved by the institutional review board of the University of Florida and were conducted in the Clinical Research Unit (CRU) in Shands Hospital at the University of Florida. Informed consent was obtained from all participants prior to their enrollment. We enrolled 588 healthy adults into a screening database to identify individuals with various GSTz1/MAAI haplotypes. Twelve individuals (5 men), aged 21 to 37 years, were consented to undergo detailed pharmacokinetic evaluation of DCA, based on the GSTz1/MAAI haplotype. Participants received a weight-maintaining diet that was prepared by the bionutrition staff of the CRU, using distilled water for food preparation and drinking, to minimize daily fluctuations in environmental intake of DCA. Diets began 4 days before each kinetic investigation and continued until completion of blood and urine collections. Oral DCA (2.5 μg/kg) was administered daily after an overnight fast for 5 consecutive days to reflect a dose similar to that obtained from consumption of chlorinated municipal drinking water.34 The plasma kinetics of 1, 2–13C-DCA was determined on the first and fifth days of drug administration. 12C-DCA was administered on days 2 to 4. After at least a 30-day washout, the same participants received oral DCA for 5 days at a dose of 25 mg/kg/d to reflect a typical exposure level of the compound when administered as a therapeutic agent to patients.3,31 Blood was withdrawn from an antecubital vein on each day of 13C-DCA administration at –10, 0, 5, 10, 20, and 30 minutes and at 1, 2, 3, 4, 6, 8, 12, and 24 hours and placed into heparinized Vacutainer tubes from which the stopper had been removed. Urine was collected at 24 hours during each kinetic investigation. Blood samples and urine were processed as previously described.29,35
Analytical Methods
Plasma concentrations of DCA and tyrosine and urinary levels of maleylacetone were measured by gas chromatography–mass spectrometry (model 5973C; Agilent Technologies, Santa Clara, California).36 Urinary delta-aminolevulivate was quantified by liquid chromatography–mass spectrometry (model TSQ 7000; Thermo Scientific, San Jose, California).37 Breath samples were collected by direct exhalation using a common straw into 10-mL Exetainer tubes (Labco Ltd, Buckinghamshire, UK). The amount of 13CO2 in the Exetainer breath storage tubes was measured38 with a Europa Scientific 20/20 gas isotope ratio mass spectrometer (Europa Scientific, Cincinnati, Ohio).
Pharmacokinetic Analysis
The plasma-concentration time curve for all DCA measurements was fitted into a noncompartmental pharmacokinetic model for each patient using WinNonlin, version 5.01 software (Pharsight, Mountain View, California), obtained through the academic license program. We determined the maximum plasma concentration of DCA (Cmax) and the time to achieve Cmax (tmax). Through the WinNonlin software, we calculated the area under the plasma concentration-time curve from time 0 to 1440 minutes (24 hours) for DCA (AUC0–1440 min) using the linear-trapezoidal method. At least 3 sampling points were used by the modeling software to estimate the first-order elimination rate constant (λz) for each time-concentration curve. The software calculated the terminal phase elimination half-life (t1/2) as ln (2)/λz and the total body clearance (CL) of DCA as the dose/AUC (0–1440 min).
DNA Isolation, Genotyping, and Haplotype Analysis
DNA was isolated from mouth wash, blood, and plasma samples from 588 healthy adults, comprising 200 (34%) males and 388 (66%) females. Of this population, 355 (60%) were white, 96 (17%) were black, 83 (14%) were Asian, and 54 (9%) were Hispanic. They were aged 20 to 55 years. DNA was also isolated from 6 children aged 2 to 10 years with congenital lactic acidosis. DNA was isolated using Qiagen Gentra Puregene Buccal Cell and Blood Kits (Qiagen, Valencia, California).
DNA samples were genotyped for 3 nonsynonymous SNPs: G94>A (rs3177427) Glu → Lys at position 32, G124>A (rs7972) Gly → Arg at position 42, and C245>T (rs1046428) Thr → Met at position 82 in the GSTz1/MAAI gene by pyrosequencing.2 Haplotypes were inferred by computational methods using the Bayesian haplotype reconstruction program, PHASE version 2.1.39
Resequencing and Mutation Discovery
A DNA sample from an individual with the KGM/KGT haplotype who showed the lowest DCA metabolism among participants was selected for further analysis by resequencing and mutation discovery. The exons and intron/exon boundaries of 5′ and 3′ untranslated regions (UTR) of the GSTz1/MAAI gene were amplified by polymerase chain reaction (PCR), and the purified PCR products were evaluated by direct sequencing using the Amersham Biosciences (Piscataway, New Jersey) ET-terminator chemistry method. Bidirectional DNA sequence data were compiled and polymorphic sites were identified using PolyPhred.40 After identifying the novel Val99Met mutation in this participant, DNA samples from individuals who showed fast or slow DCA metabolism were also resequenced to determine whether they carried this mutation.
Structural analysis
PDB code 1FW1 was displayed in PyMol. Atomic homology models were generated by substituting amino acids in the GSTz1/MAAI sequence at positions 32 (Lys → Glu), 42 (Gly → Arg), 82 (Thr → Met), and 99 (Val → Met). This sequence was used for generation of an atomic homology model using SWISS-Mod in the automated mode. Figure 5 was made with PyMol.
Figure 5.

Structural variance in glutathione transferase zeta/maleylacetoacetate isomerase (GSTz1/MAAI). Panel A shows homodimeric GSTz1/MAAI as a ribbon diagram in which each subunit is colored gold or blue. Polymorphic side chains are depicted as spheres colored yellow for carbon, blue for nitrogen, and red for oxygen. Panel B shows the crystal structure of GSTz1/MAAI and model containing the Val99Met mutation. GSTz1/MAAI is represented as a ribbon diagram. Covalent bonds of side chains in close proximity to position 99 (within 4 Å) of GSTz1/MAAI are shown as sticks colored as in A. The Met 99 residue is colored magenta for carbon and yellow for sulfur.
Statistical Analyses
We determined the mean, standard deviation, and statistical significance of the data using Excel software (Microsoft, Redmond, Washington). A 2-sided Student t test was used to analyze kinetic and metabolic data between groups, and in all cases, a P value of ≤.05 was considered statistically significant.
RESULTS
Figure 2 shows the GSTz1/MAAI haplotype frequencies among 588 healthy participants comprising this study. The 4 most common haplotypes (EGT, KGT, EGM, and KRT) showed a distribution consistent with those previously reported across racial and ethnic populations.2 The frequency of the wild-type (EGT) haplotype was similar among racial and ethnic groups: 46% in whites, 56% in blacks, 45% in Hispanics, and 49% in Asians, respectively (χ2 test P = .34). A novel KGM haplotype was detected in 5 individuals (0.4%).
Figure 2.

Glutathione transferase zeta/maleylacetoacetate isomerase (GSTz1/MAAI) haplotype frequencies in 588 participants.
Resequencing of the GSTz1/MAAI gene in the individual with unusually low DCA metabolism resulted in identification of 4 novel SNPs that are not reported in the National Center for Biotechnology Information (NCBI) dbSNP database. A G>A missense mutation (nonsynonymous SNP) at Contig position 58794086 results in substitution of (Val99Met) Val(GTG) to Met(ATG) in GSTz1/MAAI exon 5 (transcript variant 1). Amino acid Val99 is conserved in the following species: Homo sapiens, Canis lupus familiaris, Bos taurus, Mus musculus, Gallus gallus, and Danio rerio (http://www.ncbi.nlm.nih.gov/sites/entrez). The 3 other SNPs were located in intronic regions: a C>T transition at Contig position 58787368 and 2 G>T transversions at Contig positions 58795801 and 58797488. Figure 3 shows the sequence chromatogram of mutation (NM_145870:c.259G>A) in exon 5 of GSTz1/MAAI (transcript variant 1).
Figure 3.
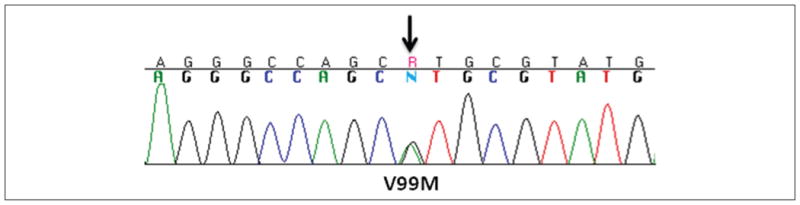
Sequence chromatogram of mutation G259A (NM_145870) in exon 5 of GSTz1/MAAI.
To investigate whether haplotype was a major determinant of DCA kinetics, we focused recruitment on individuals with different GSTz1/MAAI haplotypes. As shown in Table I, the GSTz1/MAAI haplotype had major effects on how participants responded to repeated exposure to 25 mg/kg/d of DCA on the basis of plasma elimination half-life (t1/2), area under the concentration curve (AUC), and clearance (CL). The most rapid plasma clearance after 5 consecutive days of DCA administration was observed in participants who harbored at least 1 wild-type (EGT) allele. The mean ± SD plasma clearance of the first dose of DCA was similar between the 7 participants who carried at least 1 EGT allele and the 5 participants who did not (10.7 ± 6.9 vs 7.1 ± 6.9 mL/min; P = .36). However, clearance after the fifth drug dose was 3-fold greater in EGT carriers than in noncarriers (2.2 ± 0.7 vs 0.73 ± 0.84 mL/min; P = .01) and was highest in participants who were homozygous for the wild-type EGT allele (Table I and Figure 4A, B). The fraction of 13C-DCA biotransformed in 24 hours to13 CO2 after the first and fifth drug doses was identical in the EGT carriers (24% ± 4% vs 24% ± 2%). In contrast, biotransformation to13 CO2 decreased after the fifth dose in the other participants (21.2% ± 3% vs 12% ± 8%; P = .013), resulting in a marked separation between participants who harbored the wild-type allele and those who did not in the fraction of13 CO2 formed within 24 hours after the fifth DCA dose (24% ± 2% vs 12% ± 8%; P = .01).
Table I.
Pharmacokinetics of 25 mg/kg 1,2-13C-DCA After 1 and 5 Doses
| Participant | Age/sex/Race | Gstz1/MAAI Genotype | After First DCA Dose
|
After FifthDCA Dose
|
||||||
|---|---|---|---|---|---|---|---|---|---|---|
| Cmax, μg/mL | AUC, μg/mL·min | t1/2, min | CL, mL/min | Cmax, μg/mL | AUC, μg/mL·min | t1/2, min | CL, mL/mina | |||
| EGT carriers | ||||||||||
| 1 | 24/F/white | EGT/EGT | 27.2 | 8211 | 79 | 3.04 | 36.1 | 21 703 | 305 | 1.15 (2.6) |
| 2 | 25/F/white | EGT/EGT | 60.3 | 8644 | 97 | 2.89 | 27.9 | 11 705 | 218 | 2.14 (1.4) |
| 3 | 24/M/white | EGT/EGT | 19.4 | 1313 | 46 | 19.05 | 28.5 | 7899 | 122 | 3.17 (6.0) |
| 4 | 23/M/black | EGT/EGT | 41.5 | 3689 | 37 | 6.78 | 32.7 | 12 612 | 232 | 1.98 (3.4) |
| 5 | 26/F/Asian | EGT/KGT | 20.4 | 2622 | 36 | 9.54 | 22.6 | 11 783 | 310 | 2.12 (4.5) |
| 6 | 23/F/black | EGT/KRT | 18.1 | 1423 | 80 | 17.57 | 28.5 | 7934 | 126 | 3.15 (5.6) |
| 7 | 25/F/white | EGT/KRT | 14.4 | 1538 | 102 | 16.25 | 22.8 | 13 715 | 323 | 1.82 (8.9) |
| EGT noncarriers | ||||||||||
| 8 | 25/F/white | KRT/KGT | 31.8 | 3366 | 41 | 7.43 | 27 | 11 746 | 243 | 2.13 (3.5) |
| 9 | 37/M/white | KGT/KGT | 24.7 | 4048 | 102 | 6.18 | 26.5 | 29 214 | 727 | 0.86 (7.2) |
| 10 | 33/F/white | KRT/KRT | 12.4 | 1493 | 96 | 16.74 | 33.1 | 79 525 | 1592 | 0.31 (54.0) |
| 11 | 21/M/white | KRT/EGM | 49.4 | 5301 | 47 | 4.72 | 35.3 | 98 683 | 1774 | 0.25 (18.9) |
| 12 | 26/M/white | KGM/KGT | 27.8 | 78 165 | 1264 | 0.32 | 40.8 | 302 977 | 5408 | 0.08 (4.0) |
Cmax, maximum plasma concentration; AUC, area under plasma concentration curve; t1/2, elimination half-life; CL, plasma clearance; DCA, dichloroacetate; GSTz1/MAAI, glutathione transferase zeta/maleylacetoacetate isomerase.
Values in parentheses denote fold-change in CL between first and fifth doses.
Figure 4.

Plasma kinetics and biotransformation of dichloroacetate (DCA; 25 mg/kg/d). All panels show plasma 13C-DCA concentrations over 24 hours following 1 and 5 days, respectively, of oral administration of 25 mg/kg dose of 1,2-13C-DCA. Also shown is the time course of 13CO2 accumulation in exhaled breath as a percentage of the administered dose 13C-DCA. Panels A and B show representative data from participant 1 (EGT/EGT) in Table I, a fast metabolizer of DCA. Panels C and D show data from participant 12 (KGM/KGT), a slow metabolizer of DCA.
The most striking changes in DCA kinetics were found in participant 12, who possessed the rare KGM haplotype with the novel Val99Met SNP. Plasma clearance was greatly prolonged in this individual even after the first drug dose and was almost absent during the first 24 hours following the fifth dose (Table I and Figure 4C, D). Consequently, conversion of13 C-DCA to13 CO2 after the fifth dose was lowest (2.2%) in this participant.
There was a strong association between plasma clearance of DCA and the urinary concentration of both DCA and maleylacetone, a substrate for the MAAI-catalyzed reaction. Although no detectable urinary 12C-DCA or maleylacetone was found in any EGT carrier, both accumulated in the urine of 4 of the 5 other participants after 5 days of drug administration (Table II).
Table II.
Urinary Levels of 12C-DCA and Maleylacetone After 5 Days of 25 mg/kg/d DCA
| Participant | Genotype | DCA, mmol/mol Cr | MA, mmol/mol Cr |
|---|---|---|---|
| 9 | KGT/KGT | 7.4 | 3.3 |
| 11 | KRT/KRT | 6.1 | 4.7 |
| 10 | KRT/EGM | 122.2 | 8.5 |
| 12 | KGM/KGT | 75.7 | 12.4 |
Participants from Table I. Urine was collected during the final 12 hours of day 5 of DCA administration. MA, maleylacetone; Cr, creatinine; DCA, dichloroacetate.
We also determined the impact of 5 days of environmental DCA exposure on its kinetics and biotransformation in the same participants (Table III). Repeated DCA administration led to a 1.8-fold increase in AUC (596 ± 234 vs 1063 ± 237 ng/mL/min; P < .01) and to a 2-fold decrease in Cl (4.8 ± 1.8 vs 2.5 ± 0.5 mL/min; P < .01). Participants with the EGT allele cleared the fifth DCA dose 17% more rapidly than did those who did not possess this allele (2.6 ± 0.4 vs 2.2 ± 0.7 mL/min; P = .31). The percentage of13 C-DCA biotransformed to13 CO2 was similar between the first (15.6% ± 4.9%) and the fifth (12.5% ± 3.3%) doses. There was no obvious effect of the GSTz1/MAAI haplotype on the biotrans-formation of a 2.5-μg/kg/d dose of DCA to CO2.
Table III.
Pharmacokinetics of 2.5 μg/kg of 1,2-13 C-DCA After 1 and 5 Doses
| Participant | Gstz1/MAAI Genotype | After First DCA Dose
|
After Fifth DCA Dose
|
||||||
|---|---|---|---|---|---|---|---|---|---|
| Cmax, ng/L | AuC, ng/L·min | t1/2, min | CL, mL/min | Cmax, ng/mL | AuC, ng/L·min | t1/2, min | CL, L/min | ||
| EGT carriers | |||||||||
| 1 | EGT/EGT | 6.7 | 331 | 62 | 7.5 | 4.0 | 873 | 62.2 | 2.9 |
| 2 | EGT/EGT | 5.8 | 305 | 56 | 8.2 | 4.7 | 814 | 91.4 | 3.1 |
| 3 | EGT/EGT | 6.2 | 376 | 76 | 6.7 | 5.7 | 998 | 50.5 | 2.5 |
| 4 | EGT/EGT | 10.5 | 817 | 71 | 3.1 | 7.9 | 1300 | 80.9 | 1.9 |
| 5 | EGT/KGT | 7.5 | 869 | 67 | 2.9 | 5.0 | 974 | 74.3 | 2.6 |
| 6 | EGT/KRT | 8.3 | 497 | 61 | 5.0 | 7.6 | 1019 | 58.9 | 2.5 |
| 7 | EGT/KRT | 6.9 | 501 | 57 | 5.0 | 6.4 | 847 | 90.4 | 3.0 |
| EGT noncarriers | |||||||||
| 8 | KRT/KGT | 8.0 | 674 | 44 | 3.7 | 4.6 | 731 | 83.6 | 3.4 |
| 9 | KGT/KGT | 9.3 | 1090 | 79 | 2.3 | 9.7 | 1439 | 66.4 | 1.7 |
| 10 | KRT/KRT | 8.8 | 506 | 48 | 4.9 | 12.5 | 1306 | 50.0 | 1.9 |
| 11 | KRT/EGM | 10.5 | 595 | 53 | 4.2 | 12.1 | 1368 | 56.3 | 1.8 |
| 12 | KGT/KGM | 6.0 | 593 | 51 | 4.2 | 7.1 | 1086 | 65.4 | 2.3 |
| Mean ± SD | 7.9 ± 1.7 | 596 ± 234 | 60 ± 11 | 4.8 ± 1.8 | 7.3 ± 3 | 1063 ± 237 | 69 ± 15 | 2.5 ± 0.5 | |
Cmax, maximum plasma concentration; AUC, area under plasma concentration curve; t1/2, elimination half-life; CL, plasma clearance; DCA, dichloroacetate; GSTz1/MAAI, glutathione transferase zeta/maleylacetoacetate isomerase.
Because of these new findings in healthy participants between the GSTz1/MAAI genotype and DCA metabolism, we genotyped 6 children (3 males) with genetic causes of mitochondrial diseases who had participated in a randomized clinical trial of DCA administered orally at a dose of 12.5 mg/kg/12 hours.3 Patients ranged in age from 2 to 10 years at the time DCA administration commenced. Their diagnoses were pyruvate dehydrogenase deficiency (3 participants) or 1 or more defects in a respiratory chain enzyme (3 participants). We reexamined the kinetic data from these individuals that were obtained after they had received 12 continuous months of DCA and found that, as for the healthy adults, the kinetic parameters for DCA in the patients segregated according to haplotype (Table IV). Moreover, patient 6, who is homozygous for the EGM haplotype, had the slowest clearance and the highest urinary excretion of unmetabolized 13C-DCA and of maleylacetone and delta-aminolevulinate. Indeed, the urinary concentration of maleylacetone in these children chronically exposed to DCA was similar to the levels that we have measured in the urine of 19 children with untreated tyrosinemia type 1 (5.8 ± 6.1 mmol/mol creatinine; range, <1.0–27 mmol/mol cre-atinine). In contrast, urinary delta-aminolevulinate levels in DCA-treated patients were much lower than those found in tyrosinemic individuals (44 ± 21 mmol/mol creatinine; range, 20–94 mmol/mol creatinine).
Table IV.
Plasma Kinetics of DCA and Urinary Levels of DCA, Maleylacetone, and Delta-Aminolevulinate in Patients With Genetic Mitochondrial Diseases
| Patient | Gstz1/MAAI Genotype | Plasma
|
CL mL/min | Urine
|
|||||
|---|---|---|---|---|---|---|---|---|---|
| Trough, μg/ml | Cmax, μg/ml | AuC, μg/ml·min | t1/2, min | DCA, mmol/mol Cr | MA | δ-AlA | |||
| 1 | EGT/EGT | 1.3 | 24.0 | 7800 | 124 | 3.17 | ND | 0.6 | 2.0 |
| 2 | EGT/EGT | 0.6 | 28.0 | 8100 | 173 | 2.85 | ND | 0.8 | 2.4 |
| 3 | EGT/KGT | 22.0 | 33.7 | 20997 | 367 | 1.19 | 3.8 | 5.6 | 2.9 |
| 4 | EGT/KGT | 7.8 | 47.9 | 17 488 | 218 | 1.43 | 13.5 | 7.2 | 3.5 |
| 5 | KGT/EGM | 20.6 | 37.6 | 27 420 | 489 | 0.91 | ND | 1.3 | 2.1 |
| 6 | EGM/EGM | 46.0 | 50.2 | 146 076 | 1816 | 0.17 | 41.3 | 7.5 | 5.4 |
Data are from samples obtained after an oral dose of 12.5 mg/kg DCA (75% 13C/25%12C) following 12 months of 12C-DCA administration (12.5 mg/kg/12 hours). Trough levels represent the plasma concentrations measured 12 hours after the last administration of 12.5 mg/kg 12C-DCA and immediately before administration of the 12C/13C-DCA mixture. Cmax, maximum plasma concentration; AUC, area under plasma concentration curve; t1/2, elimination half- life; CL, plasma clearance; DCA, dichloroacetate; GSTz1/MAAI, glutathione transferase zeta/maleylacetoacetate isomerase; MA, maleylacetone; δ-ALA, delta-aminolevulinate; ND, not detected.
Structural Consequences of Polymorphism in GSTz1/MAAI
To determine the potential effects of polymorphisms on GSTz1/MAAI enzymatic function and DCA clearance, we mapped the polymorphic positions on the solved crystal structure, PDB code 1Fw1.41,42 As shown in Figure 5A, polymorphic residues associated with differential metabolism of DCA are located at positions in the crystal structure that suggest multiple potential effects on GSTz1/MAAI enzymatic activity. The novel variant discovered in this study, position 99, the site of the Val99Met polymorphism, is located in an alpha helical bundle in which the side chain is completely buried. Unlike previously described variants of GSTz1/MAAI, position 99 is not exposed to solvent. Based on the crystal structure, positions 32 (Lys → Glu), 42 (Gly → Arg), and 82 (Thr → Met) are located on the solvent-accessible surface.
To gain insight into the specific structural consequences of expression of the GSTz1/MAAI variants, we generated atomic models of the protein43 in which each polymorphic position was represented by side chains expressed in individuals who exhibited different rates of DCA clearance. As shown in Figure 5B, the Val99Met substitution, associated with the slowest rate of DCA clearance, results in steric hindrance due to the bulky nature of the Met residue compared to Val. Based on the atomic model, this buried bulky side chain is expected to form repulsive contacts with buried side chains at residues 89, 90, 103, 155, 160, and 161. In contrast, the Lys32Glu, Gly42Arg, and Thr82Met side chains are located at the solvent-accessible surface of GSTz1/MAAI. It is noteworthy that the surface residue Thr82Met substitution results in an alteration that is likely to affect protein stability. This effect may be due to alteration of intra-molecular contacts with GSTz1/MAAI residues 65, 78, and 83 because Met cannot form hydrogen bonds with side chains at these positions. It is also notable that the Lys32Glu substitution results in an oppositely charged side chain oriented toward solvent, suggesting potential effects on protein-protein interactions. Variation at position 42 is also expected to alter the surface charge by changing the nature of the side chain from neutral to positive.
DISCUSSION
DCA retards its own metabolism at both environmental and clinical exposure levels by reversibly inhibiting the activity and expression of GSTz1/MAAI, an effect accentuated by increased age of the host.32 Although various human polymorphisms of GSTz1/MAAI were known to exist and to have different affinities for DCA in vitro, the in vivo relationship between genotype and DCA kinetics remained unknown. The present work firmly establishes the significance of the GSTz1/MAAI haplotype on the kinetics and biotransformation of DCA in humans. The importance of haplotype is further illustrated by our discovery of a new coding SNP (G → A) in the GSTz1/MAAI gene that was observed in an individual with a profound slowing of DCA plasma clearance and metabolism.
A limitation of this study is the lack of statistical power to determine the impact of each haplotype on DCA metabolism. However, the detailed clinical experimental approach that was necessary to identify haplotype-specific differences in DCA kinetics and biotransformation makes resolution of this issue impracticable by in vivo studies alone. Alternatively, the application of in vitro techniques, such as site-directed mutagenesis, may afford a means by which the differential effects of genetic variants of drug-metabolizing enzymes can be dissected.44
In addition, our atomic modeling of GSTz1/MAAI provides new mechanistic insight into how polymorphisms affect enzymatic function and DCA clearance rates. The structural consequence of Met residues at positions 82 and 99 is striking and is predicted to affect protein stability. In addition, substitution of Met at position 82 may impair GSTz1/MAAI dimerization because the altered side chain is located at the solvent-accessible surface that is oriented toward the opposing subunit (Figure 5A). The newly discovered G>A substitution at position 99 (Val99Met) is predicted to cause a decrease in protein stability that inhibits enzyme activity. Consistent with this notion that effects on protein stability are causally related to perturbation of DCA kinetics is the additional finding that Thr82Met is also associated with a markedly delayed clearance of the drug. Accordingly, persons who are heterozygous (eg, participants 11 and 12, Table I and participant 5, Table IV) or homozygous (eg, participant 6, Table IV) for either of these substitutions would be predicted to have very slow rates of DCA kinetics and biotransformation and persistently elevated plasma concentrations of DCA.
On the basis of in vitro enzyme kinetic studies,2 we originally postulated that the KRT haplotype would also be associated with decreased DCA clearance. In fact, KRT herterozygocity does not appear to affect DCA kinetics when it is paired with either the wild-type EGT allele or the less common KGT allele, both of which are associated with relatively rapid metabolism of DCA (Table I). In contrast, KRT homozygosity (participant 10, Table I) results in a rate of DCA clearance similar to that of persons who possess 1 or more KGM or EGM alleles. Atomic modeling of the Lys32Glu side chain reveals a potential mechanism for the effect of KRT polymorphism in the GSTz1/MAAI gene involving altered protein-protein interactions of the enzyme.
Our studies also help clarify important relationships between the GSTz1/MAAI genotype and DCA toxicity. In general, healthy adult participants and children with mitochondrial diseases who lack the EGT allele had the highest urinary concentrations of maleylacetone, a substrate of the GSTz1/MAAI-catalyzed step in the tyrosine catabolic pathway. Both maleylacetone and maleylacetoacetate are reactive molecules that can form adducts with proteins and DNA. It is hypothesized that the accumulation of these molecules and related tyrosine intermediates in patients with hereditary tyrosine type 1 is causally related to the hepatotoxicity associated with this disease.28 Patients with tyrosinemia also accumulate increased amounts of succinylacetetone, which inhibits a proximal step in heme synthesis, leading to elevated urinary levels of the heme precursor, delta-aminolevulinate. Both increased delta-aminolevulinate concentrations per se and/or downstream disruption of heme metabolism have been implicated in the neurotoxicity of tyrosinemia type 1, including peripheral neuropathy.28 Although no delta-aminolevulinate was detected in the urine of the healthy adult participants who received 5 days of 25 mg/kg/d DCA, this metabolite was measured in the urine of each child who had received the same DCA dose continuously for 12 months, with the highest levels being recorded in the 2 patients harboring the EGM haplotype (Table IV).
In 4 adult patients with glioblastoma multiforme who received 6.25 mg/kg DCA twice daily by mouth for at least 3 months, the mean ± SD plasma DCA trough concentration was 0.44 ± 0.16 mM (range, 0.27–0.63 mM).26 In contrast, the trough level in our 6 children who received 12.5 mg/kg DCA twice daily for 6 months averaged only 0.11 ± 0.11 mM (range, 0.004–0.30 mM), although the trough levels of the 2 participants who possessed the EGM haplotype were among the highest levels in this group (0.14 and 0.30 mM; Table IV). These limited data do not allow valid associations to be made between DCA dosing and its pharmacodynamics. However, it is noteworthy that several of the cancer and mitochondrial disease patients achieved DCA trough levels similar to the 0.2 mM Ki of DCA for the mitochondrial pyruvate dehydrogenase kinase isoform 2 (PDK2).45 PDK2 is ubiquitously expressed in tissues and is the principal therapeutic target of DCA relevant to its use in genetic mitochondrial diseases, cancer, and pulmonary hypertension. It remains to be determined whether plasma DCA trough levels that approximate the Ki for this isoform become a desirable target in future clinical trials with the drug.
Although randomized controlled trials have not described hepatotoxicity from chronic DCA, open-label studies have occasionally reported individual cases of asymptomatic and reversible elevations in serum alanine aminotransferase and aspartate amino-transferase concentrations. More problematic is the association of DCA with exacerbation or new onset of reversible peripheral neuropathy. However, such data are difficult to interpret because patients with mitochondrial diseases are already at high risk for manifesting signs of hepatotoxicity46 and peripheral neuropathy.47 In the glioma trial,26 peripheral neuropathy was reported to be moderate to severe at twice-daily DCA doses of 12.5 to 25 mg/kg but minimal to absent at twice-daily doses of 6.25 mg/kg.
Our findings also have potentially important implications for populations that are chronically exposed to DCA present in the environment, either through chlorinated drinking water48 or, less frequently, from water sources contaminated with trichloroethylene or other industrial solvents that are biotransformed to DCA.49 It has been estimated that the daily consumption of 2 L of chlorinated drinking water provides about 2 to 4 μg DCA/kg body weight. Short-term oral administration of 2.5 μg/kg/d of13 C-DCA to healthy participants is sufficient to cause significant inhibition of DCA plasma clearance (Table III),50 albeit to a far lesser degree than does exposure to the clinically relevant doses administered in the present study. Nevertheless, our findings suggest that daily consumption of chlorinated water by individuals whose GSTz1/MAAI genotype confers slow metabolism of DCA could predispose them to health complications associated with chronic trichloroethylene exposure.
Last, our data also suggest that the GSTz1/MAAI haplotype may determine flux through the phenylalanine/tyrosine catabolic pathway, thereby influencing an individual’s capacity to metabolize a diet containing these amino acids. It would be anticipated, therefore, that persons who metabolize DCA slowly would also metabolize phenylalanine and tyrosine at reduced rates and might be more likely to accumulate potentially toxic tyrosine intermediates, particularly with chronic consumption of a high-protein diet. This postulate is amenable to direct clinical experimentation using well-validated procedures for measuring amino acid turnover in humans.
We conclude that the toxicokinetics of DCA can be predicted, at least in part, by knowledge of the GSTz1/MAAI genotype and that individuals enrolled in clinical trials of DCA for treatment of mitochondrial diseases, cancer, or other conditions who possess at least 1 KGM or EGM allele may be at heightened risk for developing adverse drug effects unless dose adjustments are made. Moreover, the GSTz1/MAAI genotype may confer added risk to populations who are chronically exposed to environmental levels of DCA or its precursors and/or to chronic consumption of protein-enriched diets.
Acknowledgments
We thank Ms Kathryn St. Croix for editorial assistance.
Footnotes
Contribution of authors: A. Shroads, J. Bullock, and D. Weithorn conducted the mass spectrometry experiments, analyzed and interpreted the data, and helped write the manuscript. T. Langaee conducted the genotyping experiments, analyzed and interpreted the data, and helped write the manuscript. B. Coats and T. Kurtz screened and consented participants and oversaw collection and processing of biological specimens. Y. Gong helped analyze the genotyping results. D. Wagner analyzed the 13 CO2 samples and interpreted the results. D. Ostrov conducted the atomic modeling experiments, analyzed and interpreted the data, and helped write the manuscript. J. Johnson interpreted the pharmacokinetic and genotyping data and helped write the manuscript. P. Stacpoole designed and oversaw the conduct of the study, interpreted the results, and helped write the manuscript.
For reprints and permission queries, please visit SAGE’s Web site at http://www.sagepub.com/journalsPermissions.nav.
Financial disclosure: This work is supported in part by National Institutes of Health grants R01 ES07355 and R01 ES014617-01.
References
- 1.Stacpoole PW, Henderson GN, Yan Z, Cornett R, James MO. Pharmacokinetics, metabolism and toxicology of dichloroacetate. Drug Metab Rev. 1998;30:499–539. doi: 10.3109/03602539808996323. [DOI] [PubMed] [Google Scholar]
- 2.Stacpoole PW, Kurtz TL, Han Z, Langaee TY. Role of dichloroacetate in the treatment of genetic mitochondrial diseases. Adv Drug Deliv Rev. 2008;60:1478–1487. doi: 10.1016/j.addr.2008.02.014. [DOI] [PMC free article] [PubMed] [Google Scholar]
- 3.Stacpoole PW, Kerr DS, Barnes C, et al. A controlled clinical trial of dichloroacetate for treatment of congenital lactic acidosis in children. Pediatrics. 2006;117:1519–1531. doi: 10.1542/peds.2005-1226. [DOI] [PubMed] [Google Scholar]
- 4.Cree LM, Samuels DC, Chinnery PF. The inheritance of pathogenic mitochondrial DNA mutations. Biochim Biophys Acta. 2009;1792:1097–1102. doi: 10.1016/j.bbadis.2009.03.002. [DOI] [PMC free article] [PubMed] [Google Scholar]
- 5.Bonnet S, Archer SL, Allalunis-Turner J, et al. A mitochondria-K+ channel axis is suppressed in cancer and its normalization promotes apoptosis and inhibits cancer growth. Cancer Cell. 2007;11:37–51. doi: 10.1016/j.ccr.2006.10.020. [DOI] [PubMed] [Google Scholar]
- 6.Wong JY, Huggins GS, Debidda M, Munshi NC, De Vivo I. Dichloroacetate induces apoptosis in endometrial cancer cells. Gynecol Oncol. 2008;109:394–402. doi: 10.1016/j.ygyno.2008.01.038. [DOI] [PMC free article] [PubMed] [Google Scholar]
- 7.Cao W, Yacoub S, Shiverick KT, et al. Dichloroacetate (DCA) sensitizes both wild-type and over expressing Bcl-2 prostate cancer cells in vitro to radiation. Prostate. 2008;68:1223–1231. doi: 10.1002/pros.20788. [DOI] [PubMed] [Google Scholar]
- 8.Michelakis ED, Webster L, Mackey JR. Dichloroacetate (DCA) as a potential metabolic-targeting therapy for cancer. Br J Cancer. 2008;99:989–994. doi: 10.1038/sj.bjc.6604554. [DOI] [PMC free article] [PubMed] [Google Scholar]
- 9.Kissling GE, Malarkey DE, Vallant MK, et al. Evaluation of dichloroacetic acid for carcinogenicity in genetically modified Tg.AC hemizygous and p53 haploinsufficient mice. Toxicol Sci. 2009;107:19–26. doi: 10.1093/toxsci/kfn228. [DOI] [PMC free article] [PubMed] [Google Scholar]
- 10.Higgins LH, Withers HG, Garbens A, et al. Hypoxia and the metabolic phenotype of prostate cancer cells. Biochim Biophys Acta. 2009;1787:1433–1443. doi: 10.1016/j.bbabio.2009.06.003. [DOI] [PubMed] [Google Scholar]
- 11.Sun RC, Fadia M, Dahlstrom JE, Parish CR, Board PG, Blackburn AC. Reversal of the glycolytic phenotype by dichloroacetate inhibits metastatic breast cancer cell growth in vitro and in vivo. Breast Cancer Res Treat. 2010;120:253–260. doi: 10.1007/s10549-009-0435-9. [DOI] [PubMed] [Google Scholar]
- 12.Chen Y, Cairns R, Papandreou I, Koong A, Denko NC. Oxygen consumption can regulate the growth of tumors, a new perspective on the Warburg effect. PLoS One. 2009;4:e7033. doi: 10.1371/journal.pone.0007033. [DOI] [PMC free article] [PubMed] [Google Scholar]
- 13.Cairns RA, Bennewith KL, Graves EE, Giaccia AJ, Chang DT, Denko NC. Pharmacologically increased tumor hypoxia can be measured by 18F-fluoroazomycin arabinoside positron emission tomography and enhances tumor response to hypoxic cytotoxin PR-104. Clin Cancer Res. 2009;15:7170–7174. doi: 10.1158/1078-0432.CCR-09-1676. [DOI] [PMC free article] [PubMed] [Google Scholar]
- 14.Dhar S, Lippard SJ. Mitaplatin, a potent fusion of cisplatin and the orphan drug dichloroacetate. Proc Natl Acad Sci U S A. 2009;106:22199–22204. doi: 10.1073/pnas.0912276106. [DOI] [PMC free article] [PubMed] [Google Scholar]
- 15.Anderson KM, Jajeh J, Guinan P, Rubenstein M. In vitro effects of dichloroacetate and CO2 on hypoxic HeLa cells. Anticancer Res. 2009;29:4579–4588. [PubMed] [Google Scholar]
- 16.Archer SL, Gomberg-Maitland M, Maitland ML, Rich S, Garcia JG, Weir EK. Mitochondrial metabolism, redox signaling, and fusion: a mitochondria-ROS-HIF-1alpha-Kv1.5 O2-sensing pathway at the intersection of pulmonary hypertension and cancer. Am J Physiol Heart Circ Physiol. 2008;294:H570–H578. doi: 10.1152/ajpheart.01324.2007. [DOI] [PubMed] [Google Scholar]
- 17.Dromparis P, Sutendra G, Michelakis ED. The role of mitochondria in pulmonary vascular remodeling. J Mol Med. 2010;88:1003–1010. doi: 10.1007/s00109-010-0670-x. [DOI] [PubMed] [Google Scholar]
- 18.Piao L, Marsboom G, Archer SL. Mitochondrial metabolic adaptation in right ventricular hypertrophy and failure. J Mol Med. 2010;88:1011–1020. doi: 10.1007/s00109-010-0679-1. [DOI] [PMC free article] [PubMed] [Google Scholar]
- 19.Sutendra G, Bonnet S, Rochefort G, et al. Fatty acid oxidation and malonyl-CoA decarboxylase in the vascular remodeling of pulmonary hypertension. Sci Trans Med. 2010;2:44ra58. doi: 10.1126/scitranslmed.3001327. [DOI] [PubMed] [Google Scholar]
- 20.Dunbar E, Stacpoole PW. Study of the Safety and Efficacy of Dichloroacetate (DCA) in Brain Tumors. Gainesville, FL: University of Florida; 2010. Clinicaltrials.gov Identifier: NCT01111097. [Google Scholar]
- 21.Garon E. Phase II Study of Dichloroacetate (DCA) in Patients With Previously Treated Metastatic Breast or NSCL Cancer. Los Angeles: University of California; 2009. Clinicaltrials.gov Identifier: NCT01029925. [Google Scholar]
- 22.Petruk K, Michelakis ED, Maguire C, Webster L. The Safety and Efficacy of DCA for the Treatment of Brain Cancer. Canada: University of Alberta; 2007. Clinicaltrials.gov Identifier: NCT00540176. [Google Scholar]
- 23.Venner P, Michelakis ED. A Phase I, Open-Labeled, Single-Arm, Dose Escalation, Clinical and Pharmacology Study of Dichloroacetate (DCA) in Patients With Recurrent and/or Metastatic Solid Tumours. Canada: Alberta Health Services; 2007. ClinicalTrials.gov Identifier: NCT00566410. [Google Scholar]
- 24.Abdulkarim B. Combining Radiotherapy and Temozolomide With Dichloracetate in Patients With Newly Diagnosed Glioblastoma. Alberta, Canada: Alberta Health Services; 2008. ClinicalTrials.gov Identifier: NCT00703859. [Google Scholar]
- 25.Chang DT. Phase I Trial of Metabolic Reprogramming Therapy for Treatment of Recurrent Head and Neck Cancers. Stanford, CA: Stanford University; 2010. ClinicalTrials.gov Identifier: NCT01163487. [Google Scholar]
- 26.Michelakis ED, Sutendra G, Dromparis P, et al. Metabolic modulation of glioblastoma with dichloroacetate. Sci Trans Med. 2010;2:31–34. doi: 10.1126/scitranslmed.3000677. [DOI] [PubMed] [Google Scholar]
- 27.Tong Z, Board PG, Anders MW. Glutathione transferase zeta catalyses the oxygenation of the carcinogen dichloroacetic acid to glyoxylic acid. Biochem J. 1998;331:371–374. doi: 10.1042/bj3310371. [DOI] [PMC free article] [PubMed] [Google Scholar]
- 28.Tanguay RM, Lambert M, Grompe M, Mitchell GA. Hypertyrosinemia. In: Scriver CR, Beaudet AL, Sly WS, Valle D, Vogelstein B, editors. Metabolic and Molecular Bases of Inherited Disease. New York: McGraw-Hill; 2004. pp. 1777–1805. [Google Scholar]
- 29.Henderson GN, Curry SH, Derendorf H, Wright EC, Stacpoole PW. Pharmacokinetics of dichloroacetate in adult patients with lactic acidosis. J Clin Pharmacol. 1997;37:416–425. doi: 10.1002/j.1552-4604.1997.tb04319.x. [DOI] [PubMed] [Google Scholar]
- 30.Ammini CV, Fernandez-Canon J, Shroads AL, et al. Pharmacologic or genetic ablation of maleylacetoacetate isomerase increases levels of toxic tyrosine catabolites in rodents. Biochem Pharmacol. 2003;66:2029–2038. doi: 10.1016/j.bcp.2003.07.002. [DOI] [PubMed] [Google Scholar]
- 31.Kaufmann P, Engelstad K, Wei Y, et al. Dichloroacetate causes toxic neuropathy in MELAS: a randomized, controlled clinical trial. Neurology. 2006;66:324–330. doi: 10.1212/01.wnl.0000196641.05913.27. [DOI] [PubMed] [Google Scholar]
- 32.Shroads AL, Guo X, Dixit V, Liu HP, James MO, Stacpoole PW. Age-dependent metabolism of dichloroacetate in rats: possible relevance to human toxicity. J Pharmacol Exper Ther. 2008;324:1163–1171. doi: 10.1124/jpet.107.134593.. [DOI] [PMC free article] [PubMed] [Google Scholar]
- 33.Blackburn AC, Tzeng HF, Anders MW, Board PG. Discovery of a functional polymorphism in human glutathione transferase zeta by expressed sequence tag database analysis. Pharmacogenetics. 2000;10:49–57. doi: 10.1097/00008571-200002000-00007. [DOI] [PubMed] [Google Scholar]
- 34.Uden PCC, Miller JW. Chlorinated acids and chloral in drinking water. J Amer Water Works Assoc. 1983;75:524–527. [Google Scholar]
- 35.Stacpoole PW, Henderson GN, Yan Z, James MO. Clinical pharmacology and toxicology of dichloroacetate. Environ Health Perspect. 1998;106:989–994. doi: 10.1289/ehp.98106s4989. [DOI] [PMC free article] [PubMed] [Google Scholar]
- 36.Shroads AL, Henderson GN, Cheung J, James MO, Stacpoole PW. Unified gas chromatographic–mass spectrometric method for quantitating tyrosine metabolites in urine and plasma. J Chromatogr B Analyt Technol Biomed Life Sci. 2004;808:153–161. doi: 10.1016/j.jchromb.2004.05.005. [DOI] [PubMed] [Google Scholar]
- 37.Felitsyn NM, Henderson GN, James MO, Stacpoole PW. Liquid chromatography–tandem mass spectrometry method for the simultaneous determination of δ-ALA, tyrosine and creatinine in biological fluids. Clin Chim Acta. 2004;350:219–230. doi: 10.1016/j.cccn.2004.08.009. [DOI] [PubMed] [Google Scholar]
- 38.Paine MF, Wagner DA, Hoffmaster KA, Watkins PB. Cytochrome P450 3A4 and P-glycoprotein mediate the interaction between an oral erythromycin breath test and rifampin. Clin Pharmacol Ther. 2002;72:524–535. doi: 10.1067/mcp.2002.128387. [DOI] [PubMed] [Google Scholar]
- 39.Stephens M, Smith NJ, Donnelly P. A new statistical method for haplotype reconstruction from population data. Am J Hum Genet. 2001;68:978–989. doi: 10.1086/319501. [DOI] [PMC free article] [PubMed] [Google Scholar]
- 40.Nickerson DA, Tobe VO, Taylor SL. PolyPhred: automating the detection and genotyping of single nucleotide substitutions using fluorescence-based resequencing. Nucleic Acids Res. 1997;25:2745–2751. doi: 10.1093/nar/25.14.2745. [DOI] [PMC free article] [PubMed] [Google Scholar]
- 41.Rossjohn J, McKinstry WJ, Oakley AJ, et al. Human theta class glutathione transferase: the crystal structure reveals a sulfate-binding pocket within a buried active site. Structure. 1998;6:309–322. doi: 10.1016/s0969-2126(98)00034-3. [DOI] [PubMed] [Google Scholar]
- 42.Rossjohn J, Polekhina G, Feil SC, et al. A mixed disulfide bond in bacterial glutathione transferase: functional and evolutionary implications. Structure. 1998;6:721–734. doi: 10.1016/s0969-2126(98)00074-4. [DOI] [PubMed] [Google Scholar]
- 43.Kiefer F, Arnold K, Künzli M, Bordoli L, Schwede T. The SWISS-MODEL Repository and associated resources. Nucleic Acids Res. 2009;37:D387–D392. doi: 10.1093/nar/gkn750. [DOI] [PMC free article] [PubMed] [Google Scholar]
- 44.Zhu H, Patrick KS, Yuan H, et al. Two CES1 gene mutations lead to dysfunctional carboxylesterase 1 activity in man: clinical significance and molecular basis. Am J Hum Genet. 2008;82:1241–1248. doi: 10.1016/j.ajhg.2008.04.015. [DOI] [PMC free article] [PubMed] [Google Scholar]
- 45.Bowker-Kinley MM, Davis WI, Wu P, Harris RA, Popov KM. Evidence for existence of tissue-specific regulation of the mammalian pyruvate dehydrogenase complex. Biochem J. 1998;329:191–196. doi: 10.1042/bj3290191. [DOI] [PMC free article] [PubMed] [Google Scholar]
- 46.Bindoff L. Mitochondrial gastroenterology. In: DiMauro S, Hirano M, Schon EA, editors. Mitochondrial Medicine. Abingdon, UK: Informa Healthcare; 2006. pp. 143–159. [Google Scholar]
- 47.Stickler D, Valenstein E, Neiberger RE, et al. Peripheral neuropathy in genetic mitochondrial diseases. Pediatr Neurol. 2006;34:127–131. doi: 10.1016/j.pediatrneurol.2005.08.006. [DOI] [PubMed] [Google Scholar]
- 48.International Agency for Research on Cancer. Chlorinated Drinking-Water; Chlorination By-products; Some Other Halogenated Compounds; Cobalt and Cobalt Compounds. Vol. 52. Geneva, Switzerland: World Health Organization; 1991. WHO IARC Monographs on the Evaluation of Carcinogenic Risks to Humans. [PMC free article] [PubMed] [Google Scholar]
- 49.Lash LH, Fisher JW, Lipscomb JC, Parker JC. Metabolism of trichloroethylene. Environ Health Perspect. 2000;108:177–200. doi: 10.1289/ehp.00108s2177. [DOI] [PMC free article] [PubMed] [Google Scholar]
- 50.Jia M, Wu WW, Yost RA, Chadik PA, Stacpoole PW, Henderson GN. Simultaneous determination of trace levels of nine haloacetic acids in biological samples as their pentafluorobenzyl derivatives by gas chromatography/tandem mass spectrometry in electron capture negative ion chemical ionization mode. Anal Chem. 2003;75:4065–4080. doi: 10.1021/ac034036w. [DOI] [PubMed] [Google Scholar]