

Abstract
During inflammation neutrophils rapidly migrate to the site of tissue damage or infection by following complex gradients of bacterial peptides and host-derived chemokines. The efficiency and speed of neutrophil migration is critically dependent upon the ability of neutrophils to sensenew gradients and utilize only those that provide the most direct path to the damaged or infected site. Receptor desensitization plays an important role in migration efficiency and is most commonly studied using bath application of chemotactic factor solutions instead of presenting cells with gradients analogous to those they would experience in vivo. Here we describe a new method for examining gradient-induced neutrophil desensitization using a previously-developed open-chamber microfluidic gradient generator.
Introduction
During inflammation gradients of different chemotactic factors work together to guide neutrophils to the site of tissue damage or infection1. The response of the neutrophil is determined by the concentration of each chemotactic factor, the gradient across the cell, and the unique combination of chemotactic factors to which the cell is exposed and receptive1–3. Efficient wound healing is critically dependent upon the ability of neutrophils to migrate rapidly to the infection site. To find the infection site as quickly and efficiently as possible, neutrophils employ two forms of self-desensitization.
Heterologous desensitization occurs when intracellular signaling induced by one chemotactic factor interferes with the receptor activity of or number of receptors for another4. In vitro studies have shown that neutrophils use heterologous desensitization to prioritize the chemotactic factor gradients to which they are exposed and respond preferentially to those that help them find the damaged or infected sites most efficiently. For example, neutrophils preferentially migrate up gradients of formyl-methionine-leucine-phenylalanine (fMLF) (a peptide analogous to those found in bacteria) even when presented with competing gradients of host-derived chemokines such as leukotriene B4 or CXCL85. In fact, neutrophil exposure to fMLF above threshold concentrations can completely abolish responsiveness towards other chemokine gradients6. Prioritization of fMLF over all other chemokines allows neutrophils to follow gradients of proteins released directly by bacteria instead of chemokine gradients released by host cells in response to bacteria.
Homologous desensitization occurs when neutrophils are exposed to the same chemotactic factor repeatedly or for a prolonged period of time and progressively lose their responsiveness. For example, repeated or long-term exposure of neutrophils to CXCL8 results in decreased responsiveness7–9 caused by negative feedback that reduces the activity and number of CXCL8 receptors at the cell surface4, 8–10. Homologous desensitization provides a way for neutrophils to maintain their sensitivity to new gradients while actively migrating in response to others. However, long-term chemotactic factor exposure does not always induce homologous desensitization. When neutrophils are exposed to chemotactic factors below threshold concentrations an enhancement in sensitivity and responsiveness to subsequent exposures of the same signaling molecule can occur11.
In vitro neutrophil desensitization studies have deciphered much of the chemotactic factor hierarchy obeyed by neutrophils and some of the threshold concentrations at which desensitization occurs4, 7–9, 11, 12. The primary method used in desensitization studies is to pre-expose neutrophils to chemotactic factor solutions at known concentrations and measure the level of activation induced when the neutrophils are subsequently placed in a second chemotactic factor solution. The degree of neutrophil activation has been assessed by measuring the magnitude of the respiratory burst11, the mobilization of intracellular calcium7, 8, neutrophil transmigration through a monolayer of endothelial cells12, and neutrophil adhesion to laminin-coated substrates7.
However, during inflammation neutrophils are exposed to gradients and not uniform distributions of chemotactic factors. Because most studies utilize homogeneous solutions to desensitize cells little is known about desensitization in response to gradients, whether additional complexity is encoded in the spatial or temporal characteristics of the gradient, and whether the information gleaned from homogeneous bath desensitization studies accurately reflects the in vivo response. Two studies have examined the effects of heterologous desensitization on neutrophil chemotaxis by either exposing neutrophils to competing chemotactic factor gradients5, or pre-exposing neutrophils to chemotactic factor solutions and assaying their ability to subsequently respond to chemotactic gradients6. Both studies utilized the under-agarose chemotaxis assay which cannot be used to correlate individual neutrophil behavior with specific gradient characteristics (e.g. slope, concentration range, timing of exposure) due to an inability to track individual neutrophils as well as create gradients that do not change over space and time. To our knowledge, no study has addressed gradient-induced homologous desensitization or how it affects the cell’s ability to respond to other chemotactic factor gradients.
Microfluidic technology has played an increasingly prominent role in shaping our understanding of neutrophil chemotaxis13–26. Unlike traditional methods (reviewed in [27]), microfluidic gradient generators allow researchers to expose cells to reproducible, user-defined chemical microenvironments and directly quantify individual cell responses. The newest evolution of gradient generators19, 28, 29 offer researchers significant spatial and temporal control over the chemical environment leading to entirely new understandings30 of how neutrophils migrate to sites of inflammation and infection. It is the advent of these latest devices, which allow dynamic tuning of the shape and/or position of chemical gradients, that finally allows the many advantages of microfluidic technology to extend to studies of neutrophil desensitization. Here we describe a novel method for studying gradient-induced homologous and heterologous neutrophil desensitization using a previously-described microfluidic gradient generator termed the “Microjets Device” (Fig. 1) 29.
Figure 1. Open-chamber “Microjets” device.

(a) 3D schematic of the device showing the open architecture of the cell culture/gradient chamber. (b) Top-view phase contrast image of human neutrophils within the device with a fluorescence image overlay of an Alexa 488 gradient. Adjusting the driving pressure delivered to each gradient fluid manifold (PL, PR) causes the concentration profile (solid line) to shift in position with no change in gradient slope (dashed line).
Materials and Methods
Device Fabrication
The device was fabricated as previously described29. Briefly, a silicon wafer was coated with a 1.5 μm-thick layer of SU8-2 (Microchem Corp., Newton, MA). Electron beam lithography (FEI Sirion SEM) was used to create the molds for the 1.0 μm tall × 1.0 μm wide × 25 μm long Microjets. Two-layer SU8-50 photolithography was then used to create the molds for the 45 μm tall × 100 μm wide gradient fluid manifolds and the 66 μm tall × 200 μm wide cell culture reservoir. Poly(dimethyl siloxane) (PDMS) exclusion molding31, 32 was used to form a thin replica of the 3-layer SU-8 mold with open windows corresponding to the tallest features. The thin PDMS replica was bonded to a 60 mm-diameter glass bottom petri dish using oxygen plasma treatment (200W, 1 torr O2, 20 sec). Silicone tubing was similarly bonded to the inlets and outlets for the gradient fluid manifolds and was then caulked with a thin bead of PDMS around the interface to ensure a water-tight seal.
Human Neutrophils
Heparinized whole blood (20–30 mL) was collected from healthy human donors, layered over a density gradient (monopoly resolving media, ICN Pharmaceuticals, Costa Mesa, CA) and spun at 400 x g for 30 min. The neutrophil-rich fraction was removed and if necessary, red blood cells were lysed with hypotonic saline. The neutrophils were washed twice with pyrogen-free phosphate buffered saline (PBS) (Sigma, St. Louis, MO) and then resuspended in 5.0 ml RPMI-1640 without phenol red (BioWhittaker, Walkersville, MD) containing 10% heat-treated fetal calf serum (RPMI-FCS) (HyClone, Logan, UT).
Device Preparation and Set Up
The device was exposed to oxygen plasma (200 W, 1 torr O2, 20 sec) and immediately filled with 0.2 μm-filtered water. The glass substrate at the bottom of the open cell culture reservoir was coated with poly-D-lysine (100 μg/mL, 1hr, at room temperature), rinsed twice with 0.2 μm-filtered water, coated with fibronectin (10 μg/mL, 90 min, at 37°C) and rinsed twice more with water. The reservoir was then filled with Hank’s Balanced Salt Solution (HBSS) with 0.1% v/v bovine serum albumin (BSA) (Invitrogen, Carlsbad, CA). Human neutrophils were seeded at 10,600 cells/cm2 and allowed to settle and attach for 20–30 minutes in 5% CO2 and 37°C. The device was then placed on a Zeiss LSM 510 confocal microscope (Carl Zeiss MicroImaging, Inc., Thornwood, NY). The media in the Microjet manifolds was replaced with the appropriate gradient-generating solutions. Fluorescent dyes of appropriate molecular weight were added to each chemotactic factor solution to act as an indirect indicator of chemotactic factor concentration. After filling each Microjet manifold with the appropriate solution, the manifold inlets were connected to independent low-pressure regulators (0–3 psi, ITT Conoflow, St. George, SC) supplied with 10 psi compressed nitrogen gas. The confocal microscope was set to capture a 10 μm-thick optical slice nearest the cell culture substrate. Phase and fluorescence images were acquired every 15 seconds.
Quantitative Analysis
Fluorescence images were used to estimate the concentration profile of each chemotactic factor based on the fluorescence intensity of the respective fluorophores. The bilateral symmetry of the device creates a 1-dimensional gradient between the source and sink Microjet arrays. The mean fluorescence intensity for each pixel column orthogonal to the gradient axis was used to calculate the concentration profile at each time point. To determine the concentration gradient to which each cell was exposed we performed a linear regression analysis on the calculated concentration profile using the 6 pixels upstream and downstream of the cell position for each time point. The 13 pixel range (~12 μm) gives the approximate gradient conditions to which each cell was exposed. Phase contrast images were used to quantify neutrophil chemotaxis in response to the gradient. Cell tracking was performed manually using the Object Tracking Module in MetaMorph 5.0 (Molecular Devices, Downingtown, PA). Quantification of neutrophil behavior and correlation with gradient characteristics were performed using MATLAB™ with the Image Processing Toolbox (The Mathworks, Natick, MA). Statistical analyses were performed using GraphPad Software.
Results
Novel Method for Studying Neutrophil Desensitization
The first step is to decide on a desensitization scenario. A wide variety of scenarios are possible depending upon the chemoattractants or chemorepellants being investigated, the characteristics of the gradients being applied, the duration of exposure desired for each gradient, and the incorporation of other factors (e.g. toxins, inhibitors, metabolites, etc.) that may influence neutrophil desensitization. Once the scenario has been chosen the device is seeded with neutrophils and loaded with the first set of gradient fluids. All chemotactic factor solutions should be spiked with a fluorescent dye of comparable molecular weight as an indirect indicator of concentration. The desired scenario is then executed by exchanging gradient fluids and modifying the pneumatic pressure delivered to each gradient fluid manifold to achieve gradients with the appropriate characteristics at the desired times. Neutrophil behavior can be documented with either phase-contrast or DIC time-lapse imaging. Fluorescence imaging should be interlaced with phase or DIC imaging to provide validation that the desired chemotactic factor gradients were created within the cell culture reservoir.
Using the time-lapse phase-contrast image sequences the position of each neutrophil is tracked using an object tracking program such as the Object Tracking Module provided with MetaMorph 5.0 software. The resulting (X,Y) coordinates for each cell in each frame of the time lapse sequence along with the fluorescence time lapse image sequence are then passed to the MATLAB program (provided in the supplentary information). Using the fluorescence time-lapse image sequence the MATLAB program calculates the concentration profile of the chemotactic factor based on the fluorescence intensity of the corresponding fluorophore. Due to the bilateral symmetry of the device the program uses the mean fluorescence intensity for each pixel column orthogonal to the gradient axis to calculate the concentration profile at each time point. To determine the concentration gradient to which each cell was exposed the program performs a linear regression analysis on the calculated concentration profile using a user-defined number of pixels upstream and downstream of the cell position for each time point. The program prompts the user to define the transition points between major stages of the desensitization scenario and specify which cells should be included in the subsequent analyses. Once the transition points and cells have been specified the program outputs an overlay image of the migration traces for the selected cells during each stage, a plot of the concentration and gradient slope to which each cell was exposed over the course of the experiment, a comparison of both the overall cell velocity and the velocity of the cell along the gradient axis for each stage of the desensitization experiment, and a table of those velocities for statistical evaluation.
Desensitization Method Demonstration
To demonstrate how the new method can be used to explore gradient-induced desensitization in human neutrophils we conducted a proof-of-concept experiment in which neutrophils were exposed to a linear gradient of the chemoattractant CXCL8 and allowed to migrate. The CXCL8 gradient was then shifted to re-expose the neutrophils to the same gradient through which they had just migrated. To demonstrate the potential for studying heterologous desensitization after homologous desensitization the fluids in the Microjets Device manifolds were exchanged to produce a a gradient of f-Met-Leu-Phe (fMLF) in the opposite orientation as the initial CXCL8 gradients. fMLF has been previously shown to be at the top of the neutrophil response hierarchy4, 8, 11, 12 and should be able to elicit responses in CXCL8-exposed cells.
The demonstration desensitization scenario was divided into five stages (Fig. 2). In Stage I the right manifold was filled with 10 nM CXCL8 (8 kDa) (Sigma-Aldrich, St. Louis, MO) + 5 μM Alexa 647-Dextran (10 kDa) (Invitrogen, Carlsbad, CA) in HBSS + 0.1% BSA. The left manifold was filled with HBSS in 0.1% BSA. Neutrophils were allowed to migrate randomly for 5 minutes without exposure to any chemoattractant enabled by the lack of manifold pressurization. This stage serves as a control for migration behavior in the absence of a chemotactic gradient. In Stage II a linear gradient of CXCL8 was established in the cell culture reservoir using a right manifold driving pressure of 3.0 psi and a left manifold driving pressure of 2.0 psi. The neutrophils were allowed to migrate in response to the gradient for 20 minutes. During Stage III the gradient was shifted towards the CXCL8 source without changing the gradient shape by reducing the source driving pressure to 2.0 psi and increasing the sink driving pressure to 3.0 psi (i.e. equal magnitude pressure offsets). The neutrophils were allowed to migrate for another 15 minutes. In Stage IV the fluid in the right manifold was replaced with the sink fluid (HBSS+0.1% BSA) and the fluid in the left manifold was replaced with 10 nM fMLF (438 Da) (Sigma-Aldrich, St. Louis, MO) in deoxygenated RPMI (HyClone, Logan, UT). Alexa 488 (570 Da) (Invitrogen, Carlsbad, CA) was added to the fMLF solution as an indirect indicator of fMLF concentration. During Stage V a linear fMLF gradient, oriented in the opposite direction of the CXCL8 gradients, was established in the cell culture chamber by applying 3.0 psi to the left manifold and 2.0 psi to the right manifold. Cells were allowed to migrate for 26.5 minutes.
Figure 2.

(a) The demonstration desensitization scenario was conducted in 5 stages. Cells were first allowed to migrate without CXCL8 exposure for 5 minutes. A gradient was then applied for 20 minutes. The gradient was then shifted towards the CXCL8 source and cells were allowed to migrate in the new gradient for 15 minutes. The gradient fluids were then exchanged to expose cells to an fMLF gradient in the opposite orientation for 26.5 minutes. (b–c) Overlayed migration paths show clear migration bias to the CXCL8 gradients (Stage II and III) and the subsequent fMLF gradient (Stage V).
Overlays of the neutrophil migration paths output by the MATLAB program show clear migratory bias when cells were exposed to the two CXCL8 gradients (Fig. 2a) and the subsequent fMLF gradient (Fig. 2a). Close examination of the morphology and behavior of individual cells revealed three distinct migratory behaviors when neutrophils were exposed to the CXCL8 gradients. Five of the cells (13%) exhibited no migratory response at all and were classified as “Sessile” (Fig. 3a). The cells continually altered their shape and were viable but did not respond in any way to the CXCL8 gradients. Eighteen of the cells (49%) polarized and migrated up the CXCL8 gradient with a wide lamellopod forming on the side of the cell nearest the CXCL8 source and a narrow uropod forming at the opposite side. These cells were classified as “Motile” (Fig. 3b and 3d). Six motile cells contacted the cell culture reservoir wall nearest the CXCL8 source and continued to migrate orthogonal to the gradient axis along the Microjet outlets. To prevent the migration paths of these cells from confounding subsequent analyses, we truncated their paths at the first frame of cell-wall contact.
Figure 3. Different Types of Neutrophil Migration Behaviors.

(a) “Sessile” neutrophils failed to polarize and did not migrate up the chemotactic gradient. (b) “Motile” neutrophils polarized and made appreciable progress across the cell culture surface. (c) “Tethered” neutrophils polarized but failed to move from their initial positions seemingly tethered by their uropod (white arrowhead). (d) Position traces for two motile cells show processive migration during the CXCL8 gradients (Stage II-blue, Stage III-red) and the fMLF gradient (green). (e) Similar position traces for two tethered cells shows their oscillatory migration paths that never exceed 20 μm from the original cell position.
Interestingly, 14 of the cells (38%) adopted a polarized morphology but failed to make appreciable progress across the cell culture surface. The lamellopodia and somas of the cells extended toward the CXCL8 source but their uropods remained tethered to the cells’ initial positions (Fig. 3c, arrowhead). We classified these cells as “Tethered”. Unlike motile cells which made progress across the cell culture surface during all three chemotactic gradients, tethered cells never extended more than ~20 μm from their initial position resulting in an oscillatory migration path (Fig. 3e).
During the exchange of gradient fluids the vast majority of neutrophils lost their polarized morphology. When the fMLF gradient was initiated neutrophils polarized in the opposite direction. Eighteen of the neutrophils migrated productively towards the fMLF source. One of the motile cells had previously been sessile and 4 had been tethered cells during CXCL8 gradient exposure. Three of the 5 cells that were sessile under CXCL8 gradients remained sessile during fMLF with a fourth dying. Of the remaining 10 cells that were tethered during CXCL8 gradients 3 became sessile and 7 reversed their morphological polarity but remained tethered to the surface. From the 37 cells originally seeded in the cell culture reservoir nine (24%) responded to all three chemotactic gradients and at no time came in contact with one of the cell culture reservoir walls.
Examples of the concentration and gradient slope histories output by the MATLAB program are shown in Fig. 4 for one of the motile cells from the demonstration study. Because the method described here allows gradient characteristics to be correlated with individual neutrophil responses we can see that the cell position for this cell changes little until the first CXCL8 gradient is turned on at t = 5 min. The CXCL8 concentration and gradient slope to which the cell is exposed increases greatly and after a short delay the cell begins to migrate up the gradient towards the CXCL8 source. At t = 25 min the cell experiences a significant drop in gradient concentration (Fig. 4a) as it transitions from Stage II to III with little to no variation in the gradient slope (Fig. 4b) due to the linearity of the gradient. The cell continues to migrate towards the CXCL8 source in the shifted gradient until t = 40 min when the gradient fluids are exchanged. When the fMLF gradient is initiated at t = 42.5 min the cell migrates in the opposite direction towards the fMLF source.
Figure 4. Correlating Migration Behavior with Gradient History.

(a) Concentration history of a neutrophil that responded to all three chemotactic gradients showing the chemotactic factor concentration to which the cell was exposed at each time point (solid black line) and the cell’s x-position in the cell culture reservoir (dashed green line). Dotted lines indicate transitions between different desensitization scenario stages. (b) Gradient slope history of the same neutrophil showing the slope of the gradient to which the cell was exposed at each time point (solid black line) and the cell’s x-position in the cell culture reservoir (dashed green line).
Examples of the neutrophil velocity comparisons output by the MATLAB program are shown in Fig. 5. For our demonstration study overall cell velocities were greater during gradient exposure, regardless of the chemotactic agent, than in the absence of a chemotactic gradient (Fig. 5a). However, no individual chemotactic gradient induced higher overall cell velocities than any other.
Figure 5. Neutrophil Velocity Analysis.
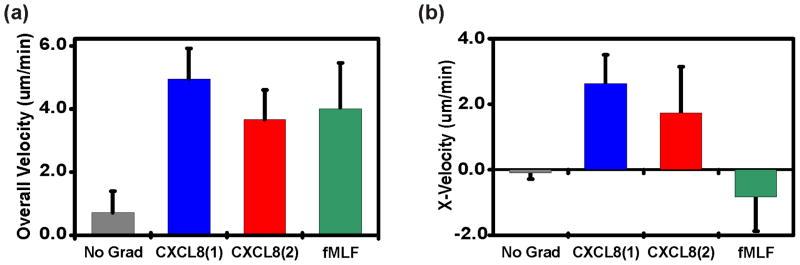
(a) A comparison of the average overall velocities during each stage for neutrophils responsive to all three gradients. (b) A comparison of the average X-velocity (along gradient axis) during each stage for neutrophils responsive to all three gradients.
When we compared the x-velocities of motile cells (i.e. velocity along the gradient axis) during the different desensitization assay stages (Fig. 5b) we discovered that the cell velocities during the initial and shifted CXCL8 gradients were significantly greater than the cell velocities measured when there was no gradient or when the cells were exposed to fMLF. However, a statistical analysis performed on the tabulated velocities output by the MATLAB program showed no statistically significant difference in the x-velocities between the two CXCL8 gradients (Stage II vs. Stage III). The x-velocities during fMLF gradient exposure were also not significantly different from those measured in the absence of any chemotactic gradient despite the clear migratory bias shown in Fig. 2c.
Discussion
Here we have described a new method for studying gradient-induced neutrophil desensitization using a microfluidic gradient generator capable of dynamic gradient tuning in combination with a MATLAB cell analysis program. Using the described method one can recreate a wide variety of desensitizing scenarios and obtain direct, quantitative information for both individual cells as well as selected subpopulations. In a demonstration study we showed how the new method could be used to correlate individual neutrophil responses with specific gradient characteristics when cells were exposed homologous desensitizion environments (CXCL8) followed by heterologous desensitization environments (fMLF).
Although only used to demonstrate one way in which the new method could be used, the wide variability in cell responses during the demonstration study hints at the challenges of studying neutrophil desensitization and the need for tools that can provide more chemically-complex and physiologically-relevant in vitro environments. The unexpected presence of “tethered cells” and the fact that many cells responded to the second CXCL8 and/or fMLF gradients but not the first CXCL8 gradient provides evidence that neutrophils indeed have initial activation states, and long-term chemical sensitivities that differ dramatically. The population-based approaches and analyses provided by traditional methods are simply ineffective at parsing out how specific complements of chemotactic factor receptors and their relative activation states influence neutrophil migratory behavior when presented with specific sets or sequences of chemotactic factor gradients.
One could easily extend the demonstration study described here to further characterize the nature of any desensitization by varying the time neutrophils were exposed to each gradient, or altering the slope and concentration range of the secondary gradients to see if equivalent levels of chemotaxis can be elicited by steeper gradients and/or higher concentrations of the respective factors. Using molecular biology tools one could influence the expression levels of different receptors and co-factors to explore how they influence the desensitization response. Although the exchange of manifold fluids to create gradients in the opposite orientation were used here to demonstrate the possibility of conducting heterologous desensitization studies, they could equally be applied to examining receptor turnover and neutrophil repolarization using a CXCL8 gradient oriented in the opposite direction as the first.
Given the number of factors known to induce chemotaxis in human neutrophils and the number of receptors and co-factors involved in transducing the gradient signal, one can clearly see that a nearly limitless number of permutable desensitization scenarios are possible, each of which yielding significant insight into our understanding of neutrophil chemotaxis.
Conclusions
Capitalizing on the dynamic gradient tuning capabilities of a previously reported microfluidic gradient generator we have demonstrated a method for studying gradient-induced desensitization of human neutrophils. The method we have described presents neutrophils with chemical environments more similar to those they may encounter in vivo allowing a more thorough and quantitative examination of the specific cues and mechanisms neutrophils use to navigate to a site of tissue damage or infection. Neutrophils in vivo are constantly sensing and responding to a milieu of different chemotactic factor gradients, prioritizing them to find invading pathogens as rapidly as possible. At no time are they exposed to homogeneous concentrations of factors and then exposed to a gradient. Using the described method neutrophils can be exposed to a wide variety of desensitization scenarios. The use of time-lapse phase-contrast and fluorescence microscopy in combination with MATLAB-based software allows correlation of cell behavior data with specific gradient characteristics to provide detailed, quantitative information about individual neutrophil migration in response to each imposed chemotactic factor gradient. Although the method was developed for human neutrophils, it could be more broadly applied to a wide variety of gradient-responsive cell types including other immune cells, neurons, embryonic stem cells, and bacteria.
Supplementary Material
Contributor Information
Thomas M. Keenan, Email: tkeenan@wisc.edu.
Albert Folch, Email: afolch@u.washington.edu.
Notes and references
- 1.Janeway C. Current Biology Publications. Garland Pub; London New York, NY: 2001. US, Editon edn. [Google Scholar]
- 2.Firtel RA, Chung CY. Bioessays. 2000;22:603–615. doi: 10.1002/1521-1878(200007)22:7<603::AID-BIES3>3.0.CO;2-#. [DOI] [PubMed] [Google Scholar]
- 3.Wu DQ. Cell Research. 2005;15:52–56. doi: 10.1038/sj.cr.7290265. [DOI] [PubMed] [Google Scholar]
- 4.Ali H, Richardson RM, Haribabu B, Snyderman R. J Biol Chem. 1999;274:6027–6030. doi: 10.1074/jbc.274.10.6027. [DOI] [PubMed] [Google Scholar]
- 5.Foxman EF, Campbell JJ, Butcher EC. J Cell Biol. 1997;139:1349–1360. doi: 10.1083/jcb.139.5.1349. [DOI] [PMC free article] [PubMed] [Google Scholar]
- 6.Campbell JJ, Foxman EF, Butcher EC. Eur J Immunol. 1997;27:2571–2578. doi: 10.1002/eji.1830271016. [DOI] [PubMed] [Google Scholar]
- 7.Nourshargh S, Perkins JA, Showell HJ, Matsushima K, Williams TJ, Collins PD. J Immunol. 1992;148:106–111. [PubMed] [Google Scholar]
- 8.Tomhave ED, Richardson RM, Didsbury JR, Menard L, Snyderman R, Ali H. J Immunol. 1994;153:3267–3275. [PubMed] [Google Scholar]
- 9.Zeilhofer HU, Schorr W. Curr Opin Hematol. 2000;7:178–182. doi: 10.1097/00062752-200005000-00009. [DOI] [PubMed] [Google Scholar]
- 10.Samanta AK, Oppenheim JJ, Matsushima K. J Biol Chem. 1990;265:183–189. [PubMed] [Google Scholar]
- 11.Burgener I, Jungi TW, Zurbriggen A, Tipold A. Vet Immunol Immunopathol. 1998;66:11–24. doi: 10.1016/s0165-2427(98)00143-3. [DOI] [PubMed] [Google Scholar]
- 12.Smith WB, Gamble JR, Clark-Lewis I, Vadas MA. Immunology. 1993;78:491–497. [PMC free article] [PubMed] [Google Scholar]
- 13.Abhyankar VV, Lokuta MA, Huttenlocher A, Beebe DJ. Lab Chip. 2006;6:389–393. doi: 10.1039/b514133h. [DOI] [PubMed] [Google Scholar]
- 14.Abhyankar VV, Toepke MW, Cortesio CL, Lokuta MA, Huttenlocher A, Beebe DJ. Lab Chip. 2008;8:1507–1515. doi: 10.1039/b803533d. [DOI] [PMC free article] [PubMed] [Google Scholar]
- 15.Agrawal N, Toner M, Irimia D. Lab Chip. 2008;8:2054–2061. doi: 10.1039/b813588f. [DOI] [PMC free article] [PubMed] [Google Scholar]
- 16.Cheng SY, Heilman S, Wasserman M, Archer S, Shuler ML, Wu M. Lab Chip. 2007;7:763–769. doi: 10.1039/b618463d. [DOI] [PubMed] [Google Scholar]
- 17.Gutierrez E, Groisman A. Anal Chem. 2007;79:2249–2258. doi: 10.1021/ac061703n. [DOI] [PubMed] [Google Scholar]
- 18.Irimia D, Charras G, Agrawal N, Mitchison T, Toner M. Lab Chip. 2007;7:1783–1790. doi: 10.1039/b710524j. [DOI] [PMC free article] [PubMed] [Google Scholar]
- 19.Irimia D, Liu SY, Tharp WG, Samadani A, Toner M, Poznansky MC. Lab Chip. 2006;6:191–198. doi: 10.1039/b511877h. [DOI] [PMC free article] [PubMed] [Google Scholar]
- 20.Li Jeon N, Baskaran H, Dertinger SK, Whitesides GM, Van de Water L, Toner M. Nat Biotechnol. 2002;20:826–830. doi: 10.1038/nbt712. [DOI] [PubMed] [Google Scholar]
- 21.Lin F, Nguyen CM, Wang SJ, Saadi W, Gross SP, Jeon NL. Biochem Biophys Res Commun. 2004;319:576–581. doi: 10.1016/j.bbrc.2004.05.029. [DOI] [PubMed] [Google Scholar]
- 22.Lin F, Nguyen CM, Wang SJ, Saadi W, Gross SP, Jeon NL. Ann Biomed Eng. 2005;33:475–482. doi: 10.1007/s10439-005-2503-6. [DOI] [PubMed] [Google Scholar]
- 23.Nalayanda DD, Kalukanimuttam M, Schmidtke DW. Biomed Microdevices. 2007;9:207–214. doi: 10.1007/s10544-006-9022-6. [DOI] [PubMed] [Google Scholar]
- 24.Saadi W, Rhee SW, Lin F, Vahidi B, Chung BG, Jeon NL. Biomed Microdevices. 2007;9:627–635. doi: 10.1007/s10544-007-9051-9. [DOI] [PubMed] [Google Scholar]
- 25.Schaff UY, Yamayoshi I, Tse T, Griffin D, Kibathi L, Simon SI. Ann Biomed Eng. 2008;36:632–646. doi: 10.1007/s10439-008-9453-8. [DOI] [PMC free article] [PubMed] [Google Scholar]
- 26.Tharp WG, Yadav R, Irimia D, Upadhyaya A, Samadani A, Hurtado O, Liu SY, Munisamy S, Brainard DM, Mahon MJ, Nourshargh S, van Oudenaarden A, Toner MG, Poznansky MC. J Leukoc Biol. 2006;79:539–554. doi: 10.1189/jlb.0905516. [DOI] [PubMed] [Google Scholar]
- 27.Keenan TM, Folch A. Lab Chip. 2008;8:34–57. doi: 10.1039/b711887b. [DOI] [PMC free article] [PubMed] [Google Scholar]
- 28.Kang T, Han J, Lee KS. Lab Chip. 2008;8:1220–1222. doi: 10.1039/b800859k. [DOI] [PubMed] [Google Scholar]
- 29.Keenan TM, Hsu CH, Folch A. Applied Physics Letters. 2006;89 [Google Scholar]
- 30.Irimia D, Balazsi G, Agrawal N, Toner M. Biophys J. 2009;96:3897–3916. doi: 10.1016/j.bpj.2008.12.3967. [DOI] [PMC free article] [PubMed] [Google Scholar]
- 31.Hsu CH, Chen C, Folch A. Lab Chip. 2004;4:420–424. doi: 10.1039/b404956j. [DOI] [PubMed] [Google Scholar]
- 32.Jo BH, Van Lerberghe LM, Motsegood KM, Beebe DJ. Journal of Microelectromechanical Systems. 2000;9:76–81. [Google Scholar]
- 33.Hung CI, Ke BJ, Huang GR, Hwei BH, Lai HF, Lee GB. Journal of Fluids Engineering-Transactions of the Asme. 2001;123:672–679. [Google Scholar]
- 34.Lin RZ, Ho CT, Liu CH, Chang HY. Biotechnol J. 2006;1:949–957. doi: 10.1002/biot.200600112. [DOI] [PubMed] [Google Scholar]
Associated Data
This section collects any data citations, data availability statements, or supplementary materials included in this article.