Abstract
Folate status and the status of the methionine cycle are typically assessed by measuring folate and metabolites in the plasma. It is assumed that plasma metabolite levels are proportional to their levels in tissues, but there is little information to support this assumption. We developed a mathematical model, based on known kinetics of the methionine cycle in the liver and tissues and transport kinetics of metabolites into and out of the plasma. The model accurately reproduces measured metabolite values pre and post folate fortification. The model allows us to study, in silico, the relationships between metabolite values in tissues and plasma, and how these vary with methionine and B vitamin input, and with mutations in the genes for enzymes in the methionine cycle. We explore the relationship between folate status and metabolite values in the plasma, the relationships between metabolite values and methylation capacity, the response to a methionine load, and the half-life of folate in plasma and tissues. The model shows that a high acute intake of folate remains largely restricted to the plasma and is rapidly excreted. We use the model to study the effects of Down syndrome and oxidative stress on metabolite values in plasma and tissues.
1 Introduction
The methionine cycle plays a critical role in cell metabolism and defects in methionine metabolism are associated with a variety of diseases ranging from cardiovascular disease to psychiatric disorders, DNA methylation status and cancer [1–5]. One of the metabolites in the methionine cycle, S-adenosylmethionine (SAM), is the universal methyl donor and is the substrate for a host of methyltransferases among which are the DNA methyltransferases and histone methyltransferases that regulate gene silencing and epigenetic inheritance. The level of SAM varies with methionine input and folate status, and, together with its product S-adenosylhomocysteine (SAH), is used as an indicator of methylation capacity [6, 7]. Another metabolite in the methionine cycle is homocysteine, and elevated levels of homocysteine are generally accepted as a major biomarker for cardiovascular disease [8, 9]. In addition, via the cystathionine-β-synthase (CBS) reaction, the methionine cycle provides the first step in the synthesis of reduced glutathione (GSH), a key antioxidant.
Aberrant function of the methionine cycle can arise from mutations in the genes that code for enzymes in the cycle and from deficiencies in vitamin cofactors for the enzymes. Vitamin B12 is an essential cofactor for methionine synthase (MS), which accepts methyl groups from 5-methyltetrahydrofolate and remethylates homocysteine to form methionine, and vitamin B6 is a cofactor for CBS, which transmethylates homocysteine and removes it from the methionine cycle in the synthesis of cystathionine, the first step in the synthesis of GSH.
The status of the methionine cycle is typically assessed by measuring the levels of its metabolites and its vitamin co-factors in the plasma. Plasma homocysteine, methionine, SAM, the SAM/SAH ratio, folate, and vitamins B6 and B12 are widely used as indicators of folate sufficiency, methylation capacity, and risk for heart disease and cancer. Although plasma metabolites are well established as biomarkers of disease, an understanding of the mechanism of disease requires knowing metabolite levels in the tissues where the methionine cycle operates. Thus it would be useful to know how the plasma levels of metabolites reflect their corresponding status within tissues. Unfortunately, it is difficult to obtain simultaneous plasma and tissue measurements for many metabolites over time, in different genetic backgrounds, and under various nutrient and micronutrient inputs.
Because much is known about the kinetics of the methionine cycle and the transport kinetics of metabolites into and out of the tissue and plasma compartments, it is possible to develop a mathematical model that allows us to examine, in silico, the expected association between tissue and plasma metabolite levels under many different genetic and environmental conditions. Here we report on the development of such a model that is based on previous models of the methionine cycle in the liver and in peripheral tissues into which we have incorporated a plasma compartment and in which we can account for dietary input of methionine and folate, their metabolism inside cells, the transport of metabolites between compartments and their elimination in the urine. We show that this model correctly reproduces a variety of experimental and clinical data, and we use the model to show that under certain conditions plasma levels of metabolites can be poor indicators of their corresponding levels in the tissues.
2 Methods
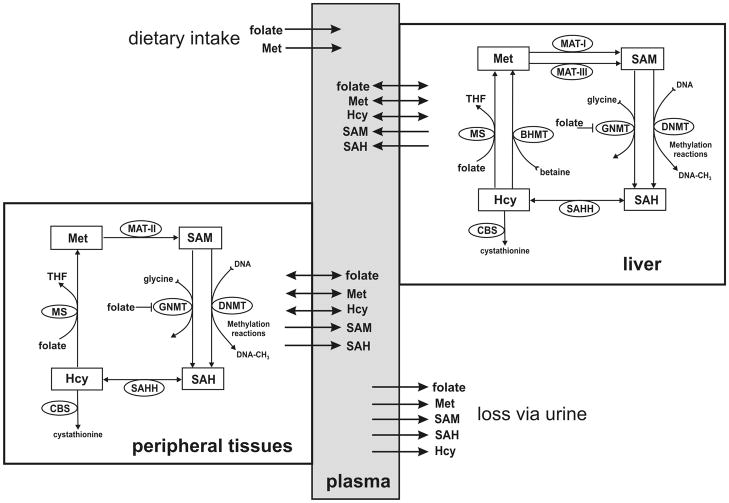
We developed a mathematical model for intracellular methionine cycle kinetics, input of substrates into the plasma, transport of metabolites between cells and the plasma, and removal of metabolites by catabolism and excretion. The model has three compartments: plasma, liver and peripheral tissues. The metabolic reaction diagrams and transport directions are shown in Figure 1. The kinetics of the liver and tissue methionine cycle are derived from [10] and [11], respectively. The model consists of 16 differential equations that express the rates of change of the metabolites in Figure 1. Each of the differential equations is a mass balance equation; the time rate of change of the particular metabolite equals the sum of the rates at which it is being made minus the rates it is being consumed in biochemical reactions, plus or minus the net transport rates from or to other compartments. The differential equations, rate equations, transporter kinetics and justifications are explained in detail in “Supporting Materials” together with all parameter values and steady-state values. The model was implemented in MATLAB (Mathworks, Natick, MA).
Figure 1.
The compartment model. Plasma metabolites are affected by dietary input, urinary output, metabolism, and transport into and out of metabolizing tissues.
3 Results and Discussion
3.1 Meaning of the compartments
The model we have developed consists of three compartments: the liver, peripheral tissues, and plasma (Figure 1). Input of methionine and folate are into the plasma compartment and from there to the liver and peripheral tissues. The peripheral tissue compartment represents all metabolizing tissues in the body, including the kidney. The excretory role of the kidney is represented by direct output from the plasma compartment. We recognize that no two tissues are likely to have identical metabolite levels or transport rates, so our tissue compartment represents an average effect, which in many cases may correspond to that found in red blood cells.
3.2 The steady-state
The steady-state values of metabolite concentrations computed by the model for the liver, plasma and tissues are shown in Table 1. The input and output rates and the net inter-compartment flux rates are in Table 2. These model steady-state concentrations and flux rates are within the normal or control ranges reported in the experimental and clinical literature (see Supporting Materials). In the model we can alter the input rates of methionine and folate, we can model the effects of under- and over-expression of the transporters and the enzymes in the methionine cycle, and we can account for the effects of changes in availability of vitamins B6 and B12 insofar as they affect the activities of the CBS and MS reactions, respectively, by altering the Vmax of those reactions.
Table 1.
Concentration of metabolites at steady-state (pre-fortification).
| Metabolite | [Plasma] | [Liver] | [Tissue] |
|---|---|---|---|
| folate | 12.40 nM | 9.06 μM | 0.416 μM |
| Met | 33.80 μM | 88.10 μM | 54.80 μM |
| SAM | 91.42 nM | 84.80 μM | 29.40 μM |
| SAH | 24.50 nM | 14.10 μM | 5.02 μM |
| Hcy | 8.78 μM | 3.28 μM | 1.04 μM |
Table 2.
Metabolite input, removal, and compartment transport rates (μM/hr)
| metabolite | Dietary intake | flux plasma to liver | flux plasma to tissue | net excretion rate | liver catabolism | tissue catabolism |
|---|---|---|---|---|---|---|
| folate | 0.0024 | 0.0015 | 0.0008 | 0.0001 | 0.0015 | 0.0008 |
| Methionine | 106 | 65.75 | 38.56 | 1.69 | . | . |
| Hcy | . | 3.77 | −3.91 | 0.14 | . | . |
| SAM | . | −0.05 | −0.77 | 0.82 | . | . |
| SAH | . | −0.008 | −0.026 | 0.034 | . | . |
Net inter-compartment flux rates. A negative symbol indicates transport towards the plasma.
For each of these changes, alone or in combination, we can compute the effects on tissue and plasma concentrations of metabolites and inter-compartment fluxes at steady-state. In addition, we can compute how concentrations and fluxes will change dynamically over time with varying inputs. In the sections that follow we use the model to simulate various experimental and clinical findings.
3.3 Folate: pre- and post-fortification
NHANES data from 1988–1994 indicated that the average folate intake was 200 μg/day. After the implementation of folate fortification in the US by the FDA in 1998, the average folate intake increased to 300 μg/day [12]. Our model assumes that the daily intake of folate is at pre-fortification levels (200 μg/day) and we simulated post-fortification levels of 300 μg/day regime by increasing folate input in our model by 50 percent. Our results are shown in Table 3, together with NHANES pre- and post-fortification data [13]. The model predicts folate and homocysteine levels within the ranges of the NHANES data for tissue folate as well as plasma Hcy levels with the exception of plasma folate levels post-fortification, where NHANES found a higher level than our model suggests. Plasma folate levels are very sensitive to recent folate intake [14], and are thus quite variable, and this may account for the discrepancy. Our model shows that to obtain the NHANES post-fortification plasma folate concentration shown in Table 3 would require an intake of 400 μg/day, which is only 100 μg/day above our assumption and could be achieved by taking a 1/4 of a typical daily multivitamin pill.
Table 3.
Effect of folate-fortification on folate and homocysteine levels.
| Metabolite | n | NHANES1,2 | model |
|---|---|---|---|
| plasma folate* | |||
| prefortification (1988–1994) | 9990 | 12.1±0.3 | 12.4 |
| postfortification (1999–2000) | 3223 | 30.2 ±0.7 | 18.8 |
| postfortification (2001–2002) | 3931 | 27.8 ± 0.5 | |
| tissue folate* | |||
| prefortification (1988–1994) | 9987 | 391±0.5 | 416 |
| postfortification (1999–2000) | 3249 | 618±0.11 | 622 |
| postfortification (2001–2002) | 3977 | 611±0.9 | |
| plasma Hcy** | |||
| prefortification (1988–1994) | 4193 | 8.7±0.01 | 8.7 |
| postfortification (1999–2000) | 3246 | 7.0±0.01 | 6.5 |
| postfortification (2001–2002) | 3976 | 7.3±0.01 | |
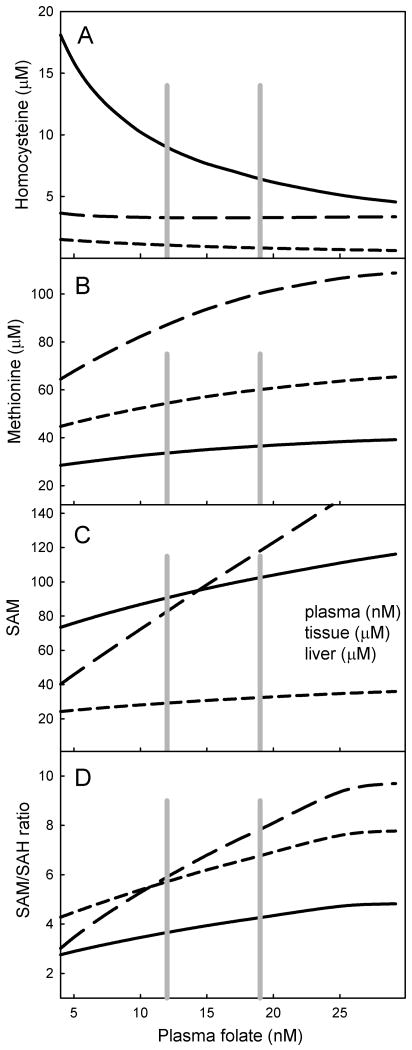
We simulated the steady-state effects of a broad range of variation in folate input. The dose-response curves for various metabolites in relation to plasma folate are shown in Figure 2. The range of values spans the pre- and post-fortified levels of plasma folate (gray lines in Figure 2). The highest levels of plasma folate shown in Figure 2 were obtained by simulating the recommended dietary folate intake of 400 μg/day. The level of plasma homocysteine is inversely proportional to plasma folate level (Figure 2A), and corresponds well to the relationship found by [15]. Our model suggests that tissue and liver homocysteine levels vary much less with variation in folate. The concentrations of SAM, the universal methyl group donor, show a different pattern (Figure 2B). The liver content of SAM is quite sensitive to folate diminution whereas the levels of tissue and plasma SAM change much less with declining folate status.
Figure 2.
Relationships between steady-state plasma folate levels and various metabolite levels due to variation in folate input. A, homocysteine; B, methionine; C, SAM; D, SAM/SAH ratio. Solid lines represent plasma, long dashes are liver, short dashes are tissue. Vertical gray lines indicate plasma folate levels calculated with the model from pre- and post- fortification folate intake levels.
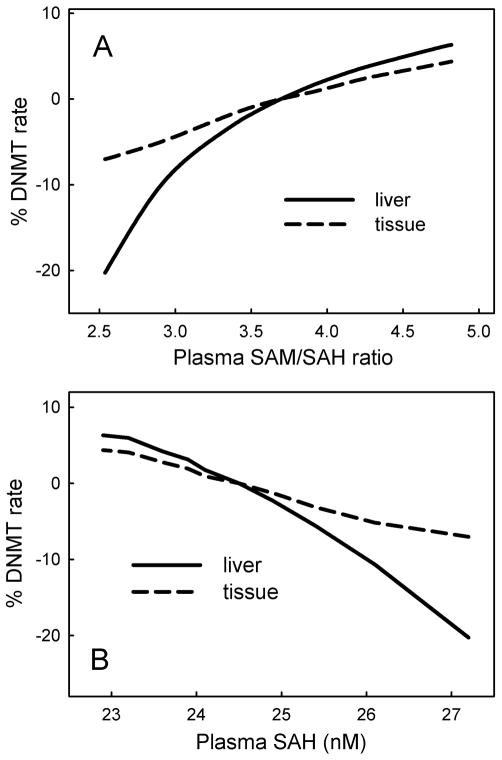
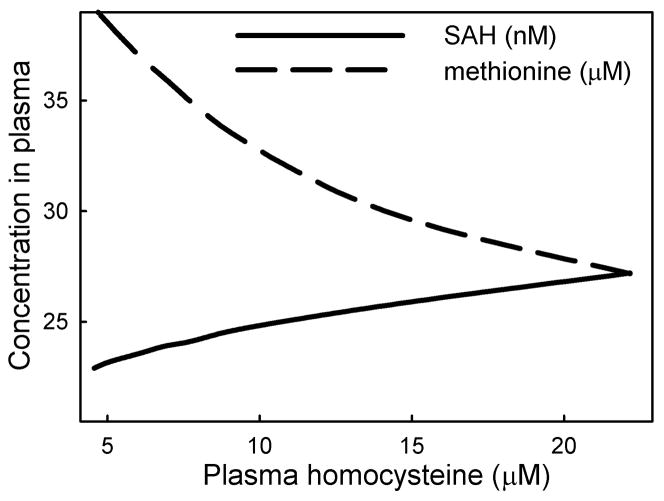
We examined the effect of variation of folate status on the relationship between the SAM/SAH ratio and the rate of the DNMT reaction (Figure 3A). Our model uses the kinetics of DNMT-1, the maintenance methyltransferase, which is the principal methyltransferase active in children and adults [16]. The SAM/SAH ratio is believed to be an indicator of methylation capacity [7, 17]: an increase in SAM enhances methyl-transfer reactions, and a decrease in SAH enhances methylation because SAH is a general inhibitor of methyltransferases. In our model we assume that the flux through the DNMT reaction is proportional to the DNA methylations capacity. Figure 3A shows that methylation rate is proportional to the plasma SAM/SAH ratio and that the liver shows a stronger positive relation than the peripheral tissues. Yi et al. [18] found a positive relationship between plasma SAH and DNA hypomethylation. Our simulation data likewise show a severe decline in flux through DNMT with increasing plasma SAH level (Figure 3B). Yi et al. [18] also found a positive relationship between plasma homocysteine and plasma SAH, and a negative relationship between plasma homocysteine and plasma methionine in healthy women with small variation in plasma homocysteine (5–17 μM). We likewise found a positive relationship of plasma homocysteine with plasma SAH and a negative relationship with plasma methionine (Figure 4).
Figure 3.
Rate of the DNMT in relation to plasma metabolite levels. The DNMT reaction represents methylation capacity. A, relationship between SAM/SAH ratio and methylation capacity in liver and peripheral tissue as both vary with folate status. The SAM/SAH ratio at normal folate status is computed by the model as 3.4, which is within the range found experimentally [38]. B, Relationship between plasma SAH level and tissue DNMT rate as both vary with folate input. Plasma SAH at normal folate status is computed by the model to be 24.50 nM, which is within the range found experimentally [38].
Figure 4.
Relationship between plasma homocysteine, SAH and methionine due to variation in folate status. Plasma homocysteine at normal folate status is12.40 μM.
3.4 Folate half-life and excess folate dosing
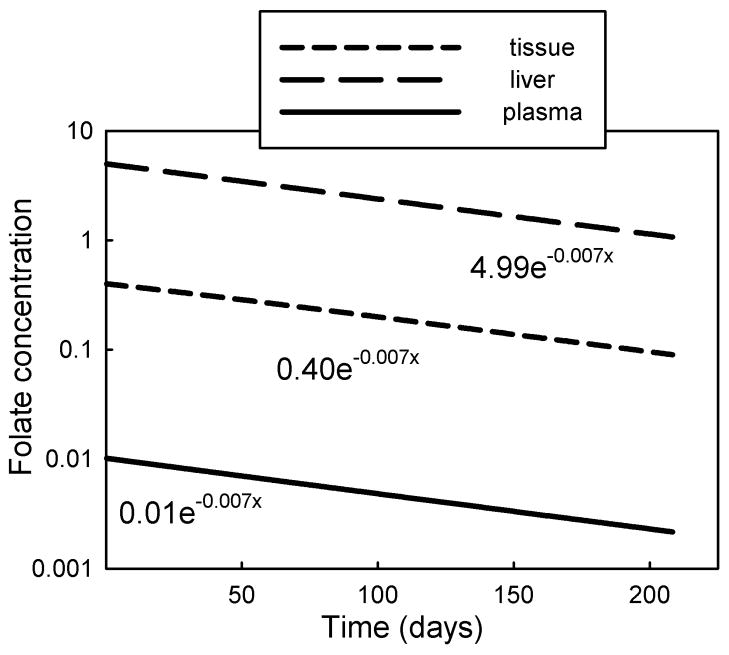
In order to verify that in our model net folate elimination and decay kinetics corresponded to observed values, we measured the half-life of folate by setting folate input to zero and following the folate concentrations in the three compartments over time. The decay profiles are shown in Figure 5. The half-life was 98.5 days, which corresponds well with the approximately 100 days estimates of net folate half-life reported in several studies [19–21]. Because the decay and removal rates of folate are slow relative to the inter-compartment folate transport and exchange rates, all compartments remain in mutual equilibrium and the half-life of folate in each compartment is identical (Figure 5).
Figure 5. Decay of folate in the three compartments.
after stopping folate input, showing identical half-lives (98.5 days) in each compartment.
Folates bind to and inhibit many enzymes in the folate cycle, a phenomenon known as substrate inhibition [22]. This is a homeostatic mechanism that may be an adaptation to periods of insufficient folate input because, as folate levels decline, enzyme activity increases and this maintains the reaction rates in the folate and methionine cycles [22–24]. There has been concern expressed about the possible deleterious effects of excessive folate intake because increasing folate levels could increase enzyme inhibition and thus have an effect equivalent to a folate deficiency [25–27]. Experimental data, however, suggest that high folate intake has only a modest effect on tissue and plasma folate levels, possibly due to saturable uptake and retention processes [28]. We simulated excessive folate intake in our model and monitored tissue levels and urinary excretion.
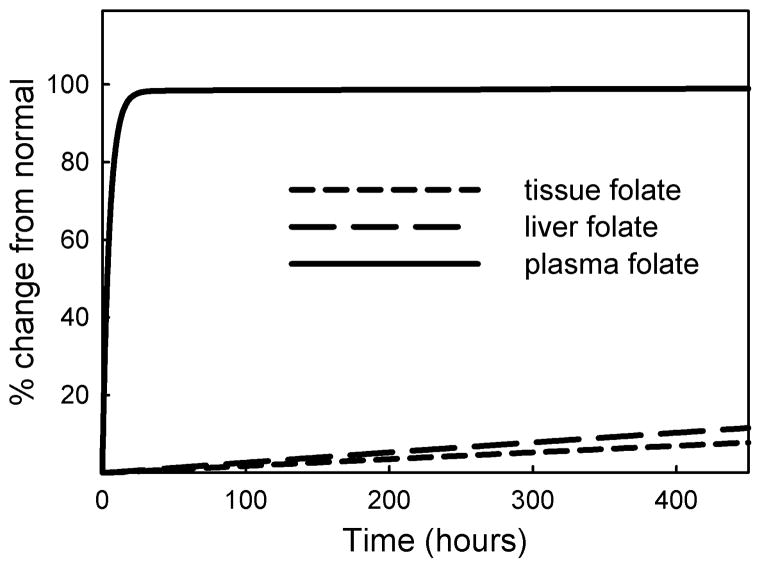
When we increased folate input by 2-fold we saw a rapid rise of plasma folate and a rapid increase in folate excretion during the first 10 hours, followed by a much slower rise in plasma folate level and urinary excretion rate (Figure 6). A persistently high level of plasma folate due to a chronic two-fold input leads to a slow but continuous elevation of plasma and intracellular folate, which reach their new steady state at twice the normal level (100% increase) after about 650 days.
Figure 6.
Simulation of a chronic 2-fold rate of folate input. At steady state plasma folate levels off at 25.3 nM (normal =12.40 nM), liver folate at 18.1 μM (normal = 9.06 μM) and tissue folate at 0.83 μM (normal = 0.416 μM).
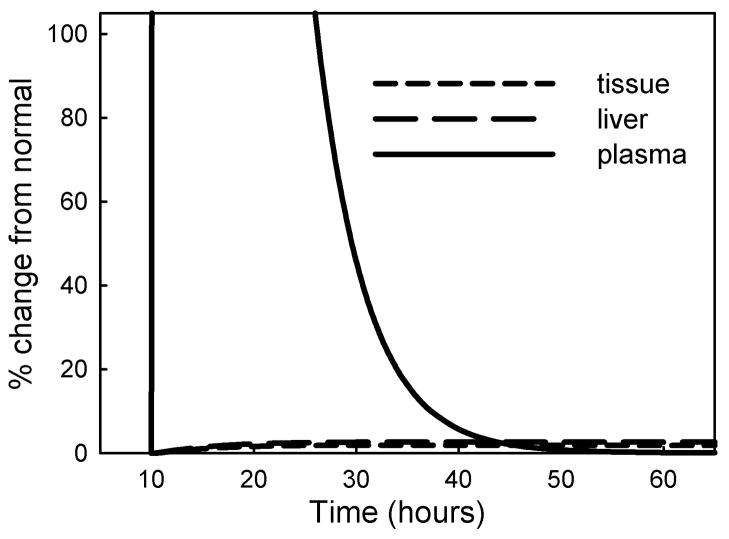
We next simulated the fate of a large infusion of excess folate by increasing folate input 100-fold for a period of 2 hours and following metabolite profiles for the next 60 hours (Figure 7). The folate remained largely in the plasma before being removed by urinary excretion, and there was a slight but persistent rise in liver and tissue folate (6% and 5% respectively). Overall, the results of our simulations indicate that a brief excessive dietary folate input remains largely restricted to the plasma and is rapidly eliminated. It causes only a small rise in tissue folate; this elevated tissue folate declines very slowly and takes some 800 days to return to normal.
Figure 7.
Simulation of an acute folate load. An infusion of 100-fold normal folate input for 2 hours, starting at 10 hours, causes a large rise in plasma folate and a small but persistent elevation of intracellular folate.
3.5 Vitamin B12 deficiency
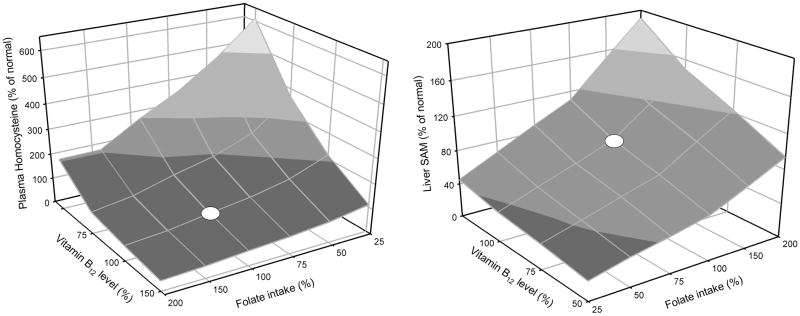
Vitamin B12 is a necessary co-factor for methionine synthase, the enzyme that remethylates homocysteine to methionine using a methyl group from 5-methyltetrahydrofolate. We modeled the effect of a vitamin B12 deficiency by reducing the Vmax of the methionine synthase reactions in tissue and liver by 20%. Table 4 shows the results of this simulation in the context of pre- and post- fortification folate input levels. Our model accurately reproduced plasma homocysteine levels from the NHANES study analyzed by Selhub et al. [29]. Lowered levels of vitamin B12 were associated with elevated plasma homocysteine, and this effect was completely reversed by the higher post-fortification level of folate intake. In our model a B12 deficiency also causes an accumulation of folate as 5-methyltetrahydrofolate, in accord with the ‘methyl-trap’ hypothesis [24, 30]. One concern with folate fortification is that it can mask a B12 deficiency. We therefore modeled the effect of variation in B12 status with variation in folate intake (Figure 8). These response surfaces illustrate that the relationships are nonlinear and the relative effects of variation in folate and B12 depend on the amount of variation and on where exactly on the surface an individual is located.
Table 4.
Plasma homocysteine levels (μmol/L) in response to variation in folate and vitamin B12 levels.
| Folate level* | Low B12 (80%)*** | High B12 (100%) |
|---|---|---|
| Low | ||
| Model | 12.52 | 8.78 |
| NHANES** | 11.9–15.5 | 7.6 – 10.9 |
| High | ||
| Model | 8.85 | 6.48 |
| NHANES** | 9.9 – 11.8 | 7.1 – 9.2 |
Low and high levels of folate in the model correspond to mean pre- and post-fortification input levels.
Range of least-squares geometric means of plasma Hcy calculated from pre- and post-fortification NHANES data from [29].
The effect of a B12 deficiency was modeled by reducing the Vmax of the methionine synthase reactions in liver and tissue to 80%.
Figure 8.
Simulation of effect of simultaneous variation in folate intake and vitamin B12 status on plasma homocysteine and liver SAM. Values represent % of normal. For folate normal is the pre-fortification intake. Variation in vitamin B12 was modeled by varying the Vmax of methionine synthase in liver and tissue. White dots indicate pre-fortification values of folate intake and normal vitamin B12 status.
3.6 Methionine load
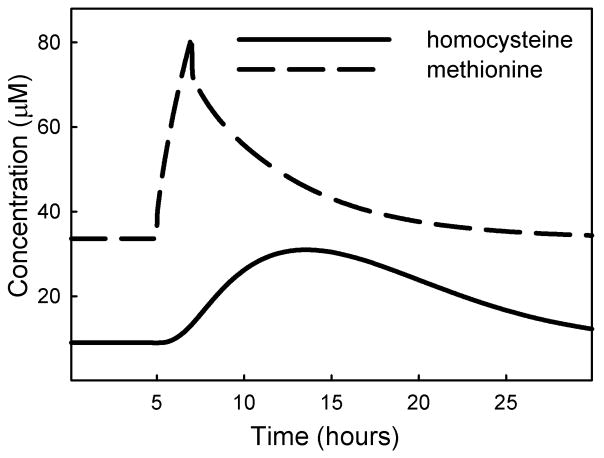
Methionine loading is used as a test for deficiency in transmethylation of homocysteine, which could be due to functional mutations in the gene for CBS, or a reduced vitamin B6 status. We simulated methionine loading by introducing a 2-hour methionine pulse at 6 times the normal input rate. The methionine pulse appears in the plasma as a peak that resolves in 10–15 hours. Homocysteine in the plasma rises gradually to just above 30 μM, (4 times above basal level) and declined to near basal level 24–30 hours after initiation of the methionine pulse (Figure 9), as found experimentally in [31, 32]. We then reduced CBS activity to 50% of normal and found that a methionine load raised the peak plasma homocysteine level to just over 50 μM. Although this looks like an increased response, it is actually only 2.5 times the higher basal level of homocysteine that is characteristic of a CBS deficiency. Silberberg and Dudman [33] noted that homocysteine levels after a methionine load are not always measured relative to the correct basal level of homocysteine, suggesting that reports of elevated homocysteine following a methionine load may not always be reliable. In the mathematical model presented here the percent increase relative to baseline is similar whether or not there is a CBS deficiency. Guttormsen et al. [34] measured the half-life of intravenously-injected homocysteine and found values ranging from 2.8 to 5.2 hours. When we raised the initial value of plasma homocysteine two-fold, we calculated a half-life of 5.2 hours as the concentration returned to steady-state, indicating that the homocysteine redistribution kinetics in our model closely resemble those found experimentally.
Figure 9.
Simulation of methionine load. Methionine input was raised 6-fold for a 2-hour period, starting at 5 hours.
3.7 Down syndrome and oxidative stress
Down syndrome is a complex set of developmental abnormalities that result from trisomy of chromosome 21 [35]. The gene for CBS is on chromosome 21, so some of the symptoms of Down syndrome could be due to overexpression of CBS [36, 37]. Increased CBS activity will lower the steady-state levels of homocysteine and SAM, which can be interpreted, respectively, as a beneficial and a deleterious effect. In addition, persons with Down syndrome often experience excess oxidative stress [6, 38], which affects the activities of several enzymes in the methionine cycle [10]. We simulated a triple dose of CBS by increasing the Vmax of the enzyme to 150%. We found that homocysteine and was depressed by 38% of normal (Table 5), which closely corresponds to that found in persons with Down syndrome [37]. Additionally, SAM decreased which corresponds with the trend found in persons with Down syndrome. The gene for superoxide dismutase is also on chromosome 21, and persons with Down syndrome often suffer from a mild degree of oxidative stress. When we simulated the addition of oxidative stress, we found that homocysteine rose slightly and SAM levels were reduced even more. The decrease in SAM levels corresponds with experimental data [37, 39]. In addition, Infantino et. al. [39] found that the levels of methionine were significantly reduced in cultured lymphoblast cells in down patients. Our model likewise shows a modest decrease in methionine in patients with CBS trisomy which is greatly enhanced by oxidative stress.
Table 5.
Effect of increasing oxidative stress on homocysteine and SAM concentrations in CBS trisomy.
4 Concluding remarks
We have developed a mathematical model of methionine metabolism and folate and the transport of metabolites between the plasma, liver and peripheral tissues for the purpose of investigating, in silico, the degree to which metabolite levels that are typically measured in the plasma reflect the levels of their counterparts in the tissues. With this model we can study the effects of variation in methionine and folate input, as well as variation in the activities of enzymes in the methionine cycle, where variation can be due to mutation, expression level, or availability of vitamin co-factors.
Collection of a blood sample is relatively non-invasive and is a preferred method for assessing health status by measuring the levels of metabolites and drawing inferences from the observed values. The interpretation of the significance of blood values is calibrated by deviations from the typical range and reasonable physiological expectations of functionality. Linkage of a particular range of values with health or disease is derived from statistical association studies. Our model allows us to infer liver and tissue values of metabolites and thus helps us to understand the cellular metabolic mechanisms that cause the changes in plasma levels.
We used the model to study the effect of folate fortification on tissue and plasma homocysteine levels and show a good correspondence to the empirical findings of the NHANES studies. We used the model to calculate the half-life of folate, and found it to be 98 days, which corresponds well with experimental estimates. High doses of folate remained largely in the plasma compartment and were rapidly eliminated via the urine. Although plasma folate rose to high levels, only a small fraction of the plasma folate entered tissues; however, once taken up the elevated tissue levels persisted for a long time.
We studied the effects of variation in folate intake on the tissue and plasma concentrations of homocysteine, methionine, SAM, and the SAM/SAH ratio (Figures 2–4). With the exception of methionine, the plasma values do not accurately reflect tissue values. Liver SAM levels increase more severely than plasma SAM levels at high folate status, and this likewise increases liver SAM/SAH ratio more than is reflected in the plasma. Interestingly, plasma homocysteine levels increased strongly with decreasing folate status, whereas tissue homocysteine levels were much less affected (Figure 2), suggesting that plasma homocysteine is a hypersensitive indicator of tissue homocysteine levels at lowered folate status.
In our model, methylation capacity is represented by the flux carried by the DNMT reaction. This flux is affected by the concentration of its substrate, SAM, its inhibitor SAH, and by folate status. In accord with experimental findings, our model showed a positive relationship between the SAM/SAH ratio in the plasma and flux through DNMT, and a negative relationship between plasma SAH levels and flux through DNMT.
We also used the model to simulate the effect of the higher level of CBS activity that occurs in Down syndrome. By itself, the increased CBS activity lowers plasma SAM and plasma homocysteine, as expected. However, some Down patients have an elevated plasma homocysteine, and also suffer from excessive oxidative stress. Oxidative stress affects the activity of several enzymes in the methionine cycle, and previous model results have shown that increased oxidative stress increased hepatic levels of homocysteine [10]. With the present model we were able to show that plasma homocysteine levels also increase with oxidative stress, and that liver and plasma SAM levels decrease.
Supplementary Material
Acknowledgments
This research was supported by NSF grant EF-1038593 to HFN and MCR, and a subcontract on NIH grant R01 ES019876 (D. Thomas, PI). We are grateful to Cornelia Ulrich, Jesse Gregory, Barry Shane and Jill James for helpful discussions.
Footnotes
Conflict of Interest. The authors declare they have no conflict of interest.
References
- 1.Davis C, Uthus E. DNA methylation, cancer susceptibility, and nutrient interactions. Experimental Biology and Medicine. 2004;229(10):988–995. doi: 10.1177/153537020422901002. [DOI] [PubMed] [Google Scholar]
- 2.Gavin D, Sharma R. Histone modifications, DNA methylation, and schizophrenia. Neuroscience & Biobehavioral Reviews. 2010;34(6):882– 888. doi: 10.1016/j.neubiorev.2009.10.010. [DOI] [PMC free article] [PubMed] [Google Scholar]
- 3.Ma J, Stampfer M, Christensen B, Giovannucci E, Hunter D, Chen J, Willett W, Selhub J, Hennekens C, Gravel R, et al. A polymorphism of the methionine synthase gene: association with plasma folate, vitamin B12, homocyst(e)ine, and colorectal cancer risk. Cancer Epidemiology Biomarkers &Prevention. 1999;8(9):825–829. [PubMed] [Google Scholar]
- 4.Refsum H, Ueland P, Nygard O, Vollset S. Homocysteine and cardiovascular disease. Annual Review of Medicine. 1998;49(1):31–62. doi: 10.1146/annurev.med.49.1.31. [DOI] [PubMed] [Google Scholar]
- 5.Sharma A, Kramer M, Wick P, Liu D, Chari S, Shim S, Osuelette D, Nagata M, Durand D, Kotb M, et al. D4 dopamine receptor-mediated phospholipid methylation and its implications for mental illnesses such as schizophrenia. Molecular Psychiatry. 1999;4:235–246. doi: 10.1038/sj.mp.4000522. [DOI] [PubMed] [Google Scholar]
- 6.James S, Cutler P, Melnyk S, Jernigan S, Janak L, Gaylor D, Neubrander J. Metabolic biomarkers of increased oxidative stress and impaired methylation capacity in children with autism. The American Journal of Clinical Nutrition. 2004;80(6):1611–1617. doi: 10.1093/ajcn/80.6.1611. [DOI] [PubMed] [Google Scholar]
- 7.Caudill M, Wang J, Melnyk S, Pogribny I, Jernigan S, Collins M, Santos-Guzman J, Swendseid M, EAC, James S. Intracellular S-adenosylhomocysteine concentrations predict global DNA hypomethylation in tissues of methyl-deficient cystathionine β-synthase heterozygous mice. Journal of Nutrition. 2001;131:2811–2818. doi: 10.1093/jn/131.11.2811. [DOI] [PubMed] [Google Scholar]
- 8.Selhub J. Homocysteine metabolism. Annu Rev Nutr. 1999;19(1):217–246. doi: 10.1146/annurev.nutr.19.1.217. [DOI] [PubMed] [Google Scholar]
- 9.Wald D, Law M, Morris J. Homocysteine and cardiovascular disease: evidence on causality from a meta-analysis. British Medical Journal. 2002;325:1–7. doi: 10.1136/bmj.325.7374.1202. [DOI] [PMC free article] [PubMed] [Google Scholar]
- 10.Reed M, Thomas R, Pavisic J, James S, Ulrich C, Nijhout H. A mathematical model of glutathione metabolism. Theoretical Biology and Medical Modelling. 2008;5(1):8. doi: 10.1186/1742-4682-5-8. [DOI] [PMC free article] [PubMed] [Google Scholar]
- 11.Ulrich C, Neuhouser M, Liu A, Boynton A, Gregory J, Shane B, James S, Reed M, Nijhout H. Mathematical modeling of folate metabolism: predicted effects of genetic polymorphisms on mechanisms and biomarkers relevant to carcinogenesis. Cancer Epidemiology Biomarkers & Prevention. 2008;17(7):1822–1831. doi: 10.1158/1055-9965.EPI-07-2937. [DOI] [PMC free article] [PubMed] [Google Scholar]
- 12.Bentley TGK, Willett WC, Weinstein MC, Kuntz KM. Population-level changes in folate intake by age, gender, and race/ethnicity after folic acid fortification. American Journal of Public Health. 2006;96(11):2040–2047. doi: 10.2105/AJPH.2005.067371. [DOI] [PMC free article] [PubMed] [Google Scholar]
- 13.Ganji V, Kafai MR. Trends in serum folate, RBC folate, and circulating total homocysteine concentrations in the United States: Analysis of data from National Health and Nutrition Examination Surveys, 1988–1994, 1999–2000, and 2001–2002. Journal of Nutrition. 2006;136(1):153–158. doi: 10.1093/jn/136.1.153. [DOI] [PubMed] [Google Scholar]
- 14.Lindenbaum J, Allen R. Clinical Spectrum and Diagnosis of Folate Deficiency. In: Bailey LB, editor. Folate in Health and Disease. New York: Marcel Dekker, Inc; 1995. pp. 43–66. [Google Scholar]
- 15.Selhub J, Jacques P, Wilson P, Rush D, Rosenberg I. Vitamin status and intake as primary determinants of homocysteinemia in an elderly population. Jama-Journal of the American Medical Association. 1993;270(22):2693–2698. doi: 10.1001/jama.1993.03510220049033. [DOI] [PubMed] [Google Scholar]
- 16.Pradhan S, Esteve P. Mammalian DNA (cytosine-5) methyltransferases and their expression. Clinical Immunology. 2003;109(1):6–16. doi: 10.1016/s1521-6616(03)00204-3. [DOI] [PubMed] [Google Scholar]
- 17.Williams K, Schalinske K. New insights into the regulation of methyl group and homocysteine metabolism. Jornal of Nutrition. 2007;137:311–314. doi: 10.1093/jn/137.2.311. [DOI] [PubMed] [Google Scholar]
- 18.Yi P, Melnyk S, Pogribna M, Pogribny I, Hines R, James S. Increase in plasma homocysteine associated with parallel increases in plasma S-adenosylhomocysteine and lymphocyte DNA hypomethylation. Journal of Biological Chemistry. 2000;275(38):29318–29323. doi: 10.1074/jbc.M002725200. [DOI] [PubMed] [Google Scholar]
- 19.Gregory J, Quinlivan E. In vivo kinetics of folate metabolism. Annu Rev Nutr. 2002;22(1):199–220. doi: 10.1146/annurev.nutr.22.120701.083554. [DOI] [PubMed] [Google Scholar]
- 20.Gregory J, Scott K. Modeling of folate metabolism. Advancs in Food and Nutrition Research. 1996;40:81–93. [PubMed] [Google Scholar]
- 21.Stites T, Bailey L, Scott K, Toth J, Fisher W, Gregory J. Kinetic modeling of folate metabolism through use of chronic administration of deuterium-labeled folic acid in men. The American Journal of Clinical Nutrition. 1997;65(1):53–60. doi: 10.1093/ajcn/65.1.53. [DOI] [PubMed] [Google Scholar]
- 22.Reed M, Lieb A, Nijhout H. The biological significance of substrate inhibition: A mechanism with diverse functions. Bioessays. 2010;32(5):422–429. doi: 10.1002/bies.200900167. [DOI] [PubMed] [Google Scholar]
- 23.Nijhout H, Reed M, Anderson D, Mattingly J, James S, Ulrich C. Long-range allosteric interactions between the folate and methionine cycles stabilize DNA methylation reaction rate. Epigenetics. 2006;1:81–87. doi: 10.4161/epi.1.2.2677. [DOI] [PubMed] [Google Scholar]
- 24.Nijhout H, Reed M, Budu P, Ulrich C. A mathematical model of the folate cycle. Journal of Biological Chemistry. 2004;279(53):55008–55016. doi: 10.1074/jbc.M410818200. [DOI] [PubMed] [Google Scholar]
- 25.Troen A, Mitchell B, Sorensen B, Wener M, Johnston A, Wood B, Selhub J, McTiernan A, Yasui Y, Oral E, et al. Unmetabolized folic acid in plasma is associated with reduced natural killer cell cytotoxicity among postmenopausal women. The Journal of Nutrition. 2006;136(1):189–194. doi: 10.1093/jn/136.1.189. [DOI] [PubMed] [Google Scholar]
- 26.Ulrich C, Potter J. Folate supplementation: too much of a good thing? Cancer Epidemiology Biomarkers & Prevention. 2006;15:189–193. doi: 10.1158/1055-9965.EPI-152CO. [DOI] [PubMed] [Google Scholar]
- 27.Smith A, Kim Y-I, Refsum H. Is folic acid good for everyone? The American Journal of Clinical Nutrition. 2008;87(3):517–533. doi: 10.1093/ajcn/87.3.517. [DOI] [PubMed] [Google Scholar]
- 28.Gregory J, Williamson J, Bailey L, Toth J. Urinary excretion of [2H4]folate by nonpregnant women following a single oral dose of [2H4]folic acid Is a functional index of folate nutritional status. The Journal of Nutrition. 1998;128(11):1907–1912. doi: 10.1093/jn/128.11.1907. [DOI] [PubMed] [Google Scholar]
- 29.Selhub J, Morris M, Jacques P. In vitamin B-12 deficiency, higher serum folate is associated with increased total homocysteine and methylmalonic acid concentrations. Proceedings of the National Academy of Sciences of the United States of America. 2007;104(50):19995–20000. doi: 10.1073/pnas.0709487104. [DOI] [PMC free article] [PubMed] [Google Scholar]
- 30.Shane B. Folate Chemistry and Metabolism. In: Bailey LB, editor. Folate in Health and Disease. New York: Marcel Dekker, Inc; 1995. pp. 1–22. [Google Scholar]
- 31.Loehrer F, Haefli W, Angst C, Browne G, Frick G, Fowler B. Effect of methionine loading on 5-methyltetrahydrofolate, S-adenosylmethionine and S-adenosylhomocysteine in lasma of health humans. Clinical Science. 1996;91:79–86. doi: 10.1042/cs0910079. [DOI] [PubMed] [Google Scholar]
- 32.Ueland P, Refsum H. Plasma homocysteine, a risk factor for vascular disease: plasma levels in health, disease, and drug therapy. Journal of Laboratory and Clinical Medicine. 1989;114:473–501. [PubMed] [Google Scholar]
- 33.Silberberg J, Dudman N. Methionine loading. In: Carmel R, Jacobsen D, editors. Homocystene in Health and Disease. Cambridge: Cambridge University Press; 2001. pp. 212–219. [Google Scholar]
- 34.Guttormsen A, Mansoor A, Fiskerstrand T, Ueland P, Refsum H. Kinetics of plasma homocysteine in healthy subjects after peroral homocysteine loading. Clinical Chemistry. 1993;39(7):1390–1397. [PubMed] [Google Scholar]
- 35.CJE . Down syndrome (trisomy 221) In: JBS, JBW, DSF, editors. The Metabolic and Molecular Bases of Inherited Disease. 3. New York: McGraw-Hill; 1995. pp. 749–794. [Google Scholar]
- 36.Pogribna M, Melnyk S, Pogribny I, Chango A, Yi P, James S. Homocysteine metabolism in children with Down syndrome: in vitro modulation. American Journal of Human Genetics. 2001;69:88–95. doi: 10.1086/321262. [DOI] [PMC free article] [PubMed] [Google Scholar]
- 37.Al-Gazali LI, Padmanabhan R, Melnyk S, Yi P, Pogribny IP, Pogribna M, Bakir M, Hamid ZA, Abdulrazzaq Y, Dawodu A, et al. Abnormal folate metabolism and genetic polymorphism of the folate pathway in a child with Down syndrome and neural tube defect. American Journal of Medical Genetics. 2001;103(2):128–132. doi: 10.1002/ajmg.1509. [DOI] [PubMed] [Google Scholar]
- 38.Melnyk S, Pogribna M, Pogribny I, Yi P, James S. Measurement of plasma and intracellular S-adenosylmethionine and S-adenosylhomocysteine utilizing coulometric electrochemical detection: Alterations with plasma homocysteine and pyridoxal 5 -phosphate concentrations. Clinical Chemistry. 2000;46:265–272. [PubMed] [Google Scholar]
- 39.Infantino V, Castegna A, Iacobazzi F, Spera I, Scala I, Andria G, Iacobazzi V. Impairment of methyl cycle affects mitochondrial methyl availability and glutathione level in Down s syndrome. Molecular Genetics and Metabolism. 2011;102(3):378–382. doi: 10.1016/j.ymgme.2010.11.166. [DOI] [PubMed] [Google Scholar]
Associated Data
This section collects any data citations, data availability statements, or supplementary materials included in this article.


