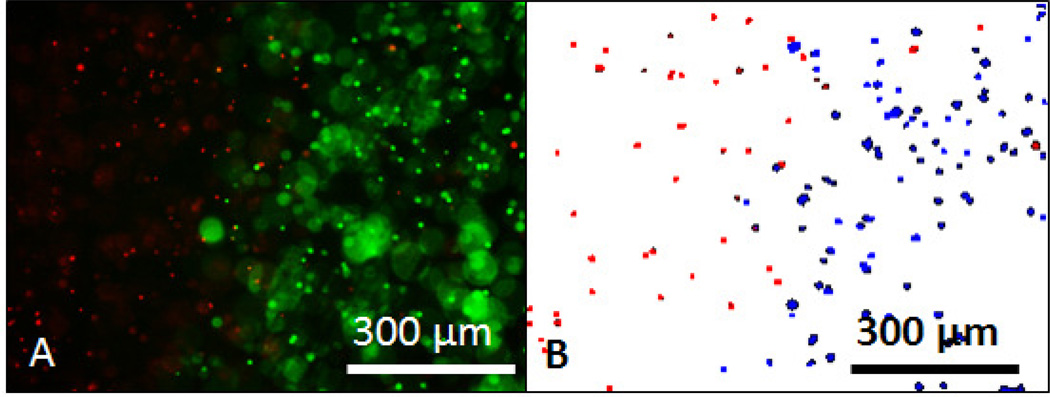
Figure 2.
The SPECTRL digital image analysis process. A) Combined fluorescent image of dead cells stained with propidium iodide (red) and live cells stained with calcein AM (green) within a phantom treated with laser irradiation. Out of focus cells are much larger and slightly fainter than in focus cells. B) Binary representation of the fluorescent image created by SPECTRL with dead cells (red) and live cells (blue) with out of focus cells removed.

