Abstract
Diffuse optical imaging (DOI) alone offers the possibility of simultaneously and noninvasively measuring neuronal and vascular signals in the brain with temporal resolution of up to 1 ms. However, while optical measurement of hemodynamic signals is well established, optical measurement of neuronal activation (the so-called fast signal) is just emerging and requires further optimization and validation. In this work, we present preliminary studies in which we measured the fast signal in 10 healthy volunteers during finger-tapping, tactile stimulation, and electrical median nerve stimulation. We used an instrument (CW4) with 8 source (690 and 830 nm) and 16 detector positions— more optodes than the instruments in previously reported studies. This allowed us to record the ipsilateral and contralateral sensorimotor cortex simultaneously, while at the same time measuring the evoked hemodynamic response. We used an acquisition time of 25 ms per image; after averaging approximately 1000 events, the signal-to-noise ratio was approximately 104. Since the expected relative intensity changes due to the fast signal (approximately 10−3) are smaller than the relative intensity changes due to physiological effects (approximately 10−1), we enhanced the suppression of competing signals such as the heartbeat-associated intensity changes, and established five criteria with which to assess the robustness of the fast signal. We detected the fast signal in 43% of the measurements during finger-tapping, 60% of those during tactile stimulation, and 23% of those during electrical median nerve stimulation. The relative changes in intensity associated with the fast signal were approximately 0.07% and the latency of the signal was approximately 100 ms.
Keywords: Neuronal activity, Optical imaging, Electro-encephalography, magneto-encephalography
Introduction
Electro-encephalography (EEG) and magneto-encephalography (MEG) provide direct measurements of neuronal activation through electrical and magnetic measures of neuronal discharge; positron emission tomography (PET) typically measures regional cerebral blood flow (rCBF) and cerebral metabolic rate of oxygen (CMRO2); functional magnetic resonance imaging (fMRI) measures blood oxygenation level dependent (BOLD) and blood flow signals. While implementation of these techniques has yielded great advances in the study of the human brain and the physiology of brain activation, there are still a number of questions about the connection between neuronal activation and the hemodynamic response that cannot be easily answered by coregistration of these modalities. Diffuse Optical Imaging (DOI) is the only imaging technique that is potentially able to provide simultaneous, noninvasive measurements of neuronal, metabolic and vascular signals from the brain cortex.
In the past 10 years, near-infrared spectroscopy (NIRS) and DOI have been shown to be effective tools for measuring local changes in cerebral hemodynamic during functional brain activation. Since the first demonstrations of noninvasive optical measures of brain function (Gratton and Corballis, 1995; Hoshi and Tamura, 1993; Villringer et al., 1993), studies have been performed on adult humans using visual (Heekeren et al., 1997), auditory (Sakatani et al., 1999), and somatosensory stimuli (Obrig et al., 1996). In addition, a number of studies have focused on the motor system (Colier et al., 1999; Franceschini et al., 2000; Hirth et al., 1997; Kleinschmidt et al., 1996). Other areas of scientific investigation include language (Sato et al., 1999), higher cognitive function (Hoshi and Tamura, 1993), and functional studies of patient populations (Fallgatter et al., 2000; Hock et al., 1997). The hemodynamic changes measured with NIRS and DOI have been shown to correlate with the BOLD fMRI signal (Kleinschmidt et al., 1996; Mehagnoul-Schipper et al., 2002; Strangman et al., 2002; Toronov et al., 2001; Yamamoto et al., 2002).
A more controversial point is whether DOI can be used to monitor neuronal activity noninvasively, based on changes in scattering induced by cell conformation and swelling changes. It has been known for some time that neuronal activity produces fast changes in optical properties—often called “fast signals”. These signals have a latency of about of 10–100 ms and are much faster than the metabolic (approximately 500–1000 ms) and hemodynamic (2–5 s) evoked responses. Invasive methods in isolated nerve preparations, tissues slices and explants were the first employed to measure the fast optical signals synchronously with electrical activity (Cohen 1973; Salzberg et al., 1988; Tasaki et al., 1992). Using dark-field microscopy to detect scattered light in cell culture, Stepnoski et al. (1991) have shown that neuronal activity is associated with an increase in light scattering. Light scattering changes in the brain can be related to changes in the index of refraction of neuronal membranes, to changes in the refractive index mismatch between the intra- and extracellular fluids, and to volume changes of cellular compartments. Exposed cortical tissue studies in animals have recently revealed fast light scattering changes corresponding to electrical evoked responses (Rector et al., 1997, 2001). Hemodynamic changes in the same 100-ms temporal range have been observed during brain activity by Sandman et al. (1984). Measurement of changes in the brain's optical properties through the intact head is more complex, but more appealing because of its application to humans. In the past few years, several attempts have been made to measure the fast signal in human subjects in vivo and noninvasively (Gratton et al., 1997b; Steinbrink et al., 2000; Wolf et al., 2002). Using a frequency-domain system, Gratton et al. (1995a) reported a transient increase in the phase shift in the visual and auditory cortex (Rinne et al., 1999), with latencies of 50 –100 ms following the onset of stimulation. These signals show the same time course as the electrophysiological response measured with EEG (Gratton et al., 1997b) and originate in the same location as does the hemodynamic evoked response. Steinbrink et al. (2000) measured a fast optical signal during electrical median nerve stimulation using a continuous-wave system. The single-channel instrument that they used, comprised of a halogen lamp emitting 150 mW and a PMT detector, had extremely low noise so as to maximize the signal-to-noise ratio (SNR). Wolf et al. (2002) measured the fast optical signal during finger-tapping stimulation with the same frequency-domain instrument as Gratton. They found that, because of the better SNR, the fast signal was more evident in the light intensity and amplitude than in the phase shift. From these efforts it is clear that, while noninvasive optical measurement of the fast signal is feasible, the main challenge to measuring it in humans is low SNR.
In this work, we tested the ability to measure the fast signal during finger-tapping, finger-tactile, and electrical median nerve stimulation. We used a continuous-wave instrument (CW4, TechEn) with eight source positions, each with two wavelengths (690 and 830 nm), and 16 detector positions. This allowed us to record the ipsilateral and contralateral sensorimotor cortex simultaneously, while at the same time measuring the evoked hemodynamic response. With the CW4 instrument, the major source of noise was not instrumental but physiological. The instrumental noise of the system at an acquisition rate of 20–50 Hz per image is approximately 0.1% in the measured intensity, and after averaging approximately 500–1000 events the SNR is approximately 104. The primary source of noise was physiological noise due to arterial pulsation. To suppress the signal due to heartbeat-associated intensity changes we used adaptive filters previously described in the literature (Gratton et al., 1995a; Wolf et al., 2002). Nevertheless, since the expected relative intensity changes due to the fast signal (approximately 10−3) are one order of magnitude smaller then the relative intensity changes due to physiological effects (approximately 10−2), we performed various analyses to validate our results and established five criteria with which to assess the robustness of the measured signal. By following these criteria, we were able to distinguish the fast signal from instrumental noise, systemic hemoglobin changes, and motion artifacts. As a result we detected fast neuronal signal in 43% of the measurements during finger tapping, 60% of those during tactile stimulation, and 23% of those during electrical median nerve stimulation. We believe that, in the future, we will be able to improve the detectability of the fast signal by improving the instrumentation, the stimulation protocols, and the signal processing.
Methods
Monte Carlo simulations
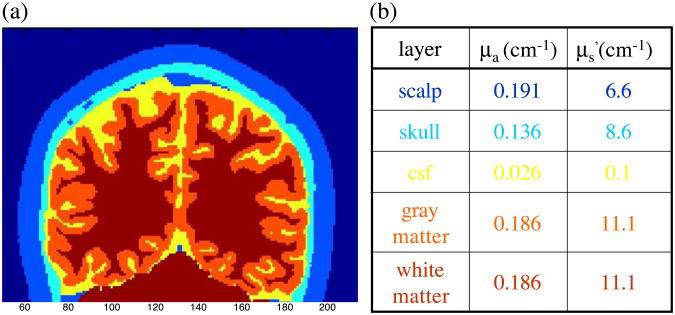
To predict the effect of a focal change of the optical coefficients within the brain cortex on our measurements, we performed Monte Carlo simulations. To accurately model photon migration through the human head we used structural MRI images. It is critical to consider an appropriate treatment of the complex, nonplanar air-tissue and internal tissue boundaries of the human head. Given this boundary information we implemented a Monte Carlo solution of the radiative transport equation (Boas et al., 2002). This Monte Carlo code allows us to obtain results in a complex 3D head model with a signal-to-noise ratio greater than 100 at distances of up to 30 mm with a 1 mm2 detector and with 108 photons propagated within 5–10 h of computer time on a Pentium III 1000 MHz CPU. Fig. 1a shows an example of an anatomical MRI of a human head segmented into five tissue types (scalp, skull, cerebral spinal fluid, and gray or white matter; see (Dale et al., 1999).
Fig. 1.
(a) Anatomical MRI of a human head segmented into five tissue types (scalp, skull, cerebral spinal fluid and gray/white matter); (b) Optical properties of the different tissue types chosen for the Monte Carlo simulations.
We used this Monte Carlo code to predict the effect of an absorbing or scattering inclusion within the brain cortex on the detected light intensity and phase shift. We chose optical properties for the different tissue types (see Fig. 1b) based on reports from the literature (Strangman et al., 2003; Torricelli et al., 2001; Zhao et al., 2002). To these tissue types we artificially added a tissue type for activated brain tissue with different scattering or absorbing optical properties and in different locations in the head.
DOI instrument
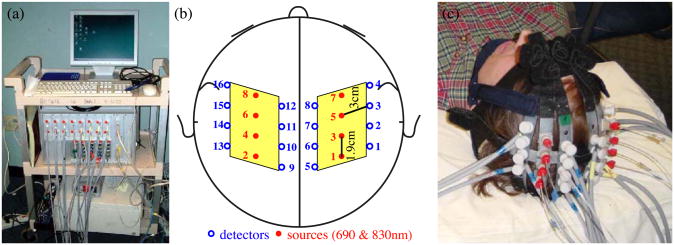
We used a multichannel continuous-wave optical imager (CW4) to obtain the measurements (see Fig. 2a). Developed at the Photon Migration Lab, Anthinoula A. Martinos Center for Biomedical Imaging, Massachusetts General Hospital, and assembled by TechEn, the imager has 18 lasers–9 lasers at 690 nm and 9 at 830 nm–and 16 detectors. The laser intensities are driven at 18 different frequencies, generated by a master clock between 4 and 7.4 kHz in approximately 200 Hz steps. These then drive the individual lasers with current stabilized square-wave modulation. Each laser delivers less than 5 mW to the tissue. For detectors, the imager employs avalanche photodiodes (APD's, Hamamatsu C5460-01), each of which is digitized at approximately 40 kHz. Each APD module is followed by a bandpass filter, a cut-on frequency of approximately 500 Hz to reduce 1/f noise and the 60 Hz room light signal, and a cut-off frequency of approximately 16 kHz to reduce the third harmonics of the square-wave signals. Next is a programmable gain stage. This is used to match the signal levels with the acquisition level on the analog-to-digital converter within the computer. A digital bandpass filter is used off-line to obtain the individual source signals. These are separated with an infinite-impulse-response filter with a 20 Hz band pass frequency. For the current study, light sources and optical detectors were coupled to optical fibers and arranged in a probe as shown in Fig. 2b. For the data analysis, we considered only the source–detector pairs at the minimum distance (3 cm)—that is, 14 couples in each hemisphere, for two imaged areas of 5.6 × 6.0 cm2.
Fig. 2.
(a) Photograph of the CW4 instrument. (b) Schematic drawing of the probe geometry. (c) Photograph of the optical probe on the head of a subject.
Protocols
The probe consisted of a flexible plastic array with source and detector fibers inserted into it (see Fig. 2c). The array was secured to the subject's head with Velcro and foam material. The subject then lay flat on foam bedding and we secured both arms with straps, to minimize intentional and extraneous movements.
In the finger-tapping protocol, we instructed subjects to touch their thumb with their index and middle fingers in time with a 4–5 Hz metronome beep (we adjusted the frequency for each subject so as not to overlap with an harmonic of the arterial pulsation frequency). In the finger-tactile protocol, an investigator touched the first three fingers of the subject's hand at the rate established for the finger-tapping protocol. In these protocols, we alternated 20-s stimulation periods with 20-s rest periods and repeated the on/off sequence 10 times for a duration of 420 s. In both protocols, auditory cues told the subject or investigator when to begin or end each period. The metronome beeps continued through both stimulation and rest periods, so as to avoid differences in auditory stimuli. For the electrical median nerve protocol, we applied 0.2-ms-long current pulses to either the right or left wrist of the subject (Grass stimulator, Astro-Med, Mod.S88K). We delivered the 4- to 5-Hz pulses in trains of 10 s, followed by 18 s of rest. For each subject, the current was adjusted to the level of motor threshold—that is, the lowest current that produces a visible contraction. The current values used ranged from 5 to 10 mA. The median nerve stimulation session consisted of an initial reference rest period followed immediately by a blocked design of 18 task and rest sequences.
We explained these instructions to the subjects before beginning the measurement sessions. During the sessions, a pulse oximeter (Nellcor, N-200) continuously recorded the arterial saturation and the heart rate at the subjects' toes. A strain gauge belt (Sleepmate/Newlife Technologies, Resp-EZ) placed around the subjects' upper abdomens monitored their respiratory efforts. We employed the analog outputs of the pulse oximeter and strain gauge for continuous coregistration of physiological and optical data. Finger-tapping and finger-tactile were recorded with contact sensors attached to the subject's fingers. For finger-tapping a low voltage signal was sent to the auxiliary data acquisition board every time the subject's thumb touched the other fingers; for finger-tactile the low voltage signal was sent every time the investigator fingers touched the subject's fingers. Similarly, we synchronized the median nerve stimulation with the optical data by collecting the analog output from the back panel of the Grass stimulator. The auxiliary card acquires at a rate of 1 kHz, synchronously with the data acquisition card for the optical data. We measured the delay between the stimulation onset signals acquired with the auxiliary card and the optical signals acquired with the CW4 system. We verified that the delay between the two datasets is 30–40 ms and that it is constant during 5–10 min of data acquisition. We considered this delay in our data analysis. Apart from this constant offset, the instrumental temporal errors of our system are smaller than our temporal resolution, which was set to 25 ms by the low pass filter of the data.
Participants
We enrolled 10 healthy subjects in the study, including 6 males and 4 females. The subjects were 22–39 years old (mean age: 30 years; S.D. = 6 years). Most of the subjects followed the protocols described above once in a single session. Subjects 1 and 2 participated in three separate sessions, repeating the three protocols twice during those sessions. Subject 3 performed the finger-tapping and finger-tactile stimulation protocols twice in two separate sessions. Subject 9 did not perform the median nerve stimulation protocol; subject 10 performed the electrical median nerve stimulation protocol only. The study was approved by the Massachusetts General Hospital Institutional Review Board. All of the subjects gave written informed consent.
Data analysis
We processed the optical raw data off-line with in-house software implemented in MatLab (Mathworks, Sherborn, MA). The digital bandpass filter used to obtain the individual source signals was set at 20 Hz and we resampled the data at 40 Hz. To eliminate slow drifts, we normalized and high-pass filtered (0.5 Hz) the intensity data. To remove the arterial pulsation and its higher harmonics, we employed more specific filters, which fit the amplitude and period of the heartbeat at each point (Gratton et al., 1995a). Finally, because the fast optical signals reported exhibit an intensity change about 0.1%, it was necessary to block average 700–1000 stimuli to achieve a standard error of approximately 0.005% to 0.01%—below the expected amplitude of the fast signal.
Spatial maps of the measured percent intensity change for the fast signal were produced using a back-projection approach (Franceschini et al., 2000). We normalized the maps with respect to the time t = 0 of the stimulus. The map in each hemisphere encompassed 14 source-detector couples, and covered an area of 5.6 × 6.0 cm2 (=33.6 cm2). The pixel size was 0.4 cm2 for a total number of 84 pixels. The individual pixel values were linearly interpolated to produce the final optical maps.
We established five criteria with which to assess the robustness of the measured fast signal. These are as follows: (1) The block average of the signal at the two acquired wavelengths (690 and 830 nm) should have the same temporal evolution. (2) The block average of the signal during the rest period with a false stimulation sequence should be flat. To determine the statistical significance of the signal during stimulation relative to the signal at rest, the difference between the two curves should have a P value < 0.05. (3) Subsets of the stimulation sequence considering only odd or even stimuli, or random sequences of 1/3 of the stimuli, should generate a signal with the same temporal evolution as the one obtained using all of the stimuli. (4) The block average of the signal obtained during ipsilateral stimulation should be smaller than that obtained during contralateral stimulation. Finally, (5) the fast signal in the spatial maps should be localized in the hemisphere contralateral to the stimulated hand.
By analyzing the optical signal on a longer time scale (seconds) we measured the hemodynamic evoked response (Franceschini et al., 2003). Our paradigm consisted of a repetition of 10 (18, for the electrical stimulation) blocks of 20 s (10 s) of stimulation followed by 20 s of rest. By block averaging these 10 (18) periods we obtained the hemodynamic response. Briefly, we translated the temporal changes in intensity into temporal changes in the absorption coefficient (Δμa) using the differential-pathlength-factor (DPF) method (Delpy et al., 1988), and from the values of Δμa at two wavelengths determined the changes in oxy- and deoxy-hemoglobin concentrations. Hemoglobin maps were obtained using the same back- projection approach as for the fast signal maps. With this analysis, the values of the hemoglobin changes are qualitative and not quantitative because we did not consider the partial volume effect, because we used literature values for the DPF, and because we did not take into account possible changes in scattering (Franceschini et al., 2003; Strangman et al., 2003). The amplitude and spatial extent of the hemoglobin response was compared with those of the simultaneously acquired fast signal.
Results
Monte Carlo simulations
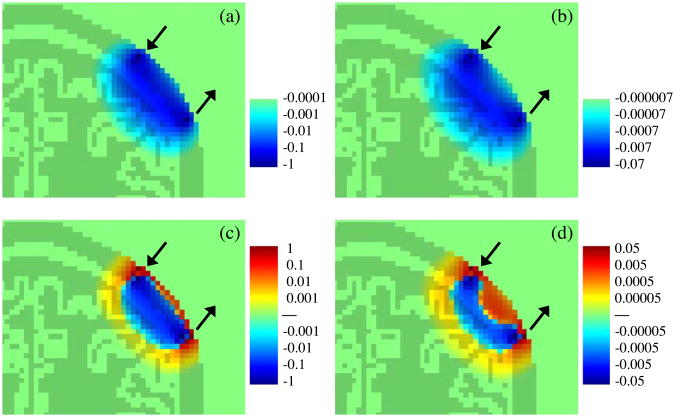
Fig. 3 shows the photon migration spatial sensitivity profile for absorbing (top panels) and scattering (bottom panels) inclusions obtained with a Monte Carlo simulation in a 3D head model. In each panel the light and dark green colors depict the head and brain structure in the MRI slice of the head containing the source and detector. The two arrows indicate the source and detector positions. Note that in the case of a scattering inclusion, depending on the position of the scattering perturbation relative to the source and detector, detected light intensity (c) and phase shift (d) change sign from positive (red) to negative (blue), and for some positions do not change with respect to the baseline (green). This behavior is different from that of an absorbing inclusion, for which light intensity (a) and phase shift (b) always decrease (this is why the positive color scale is missing in the Figs. a and b). The color scales of intensity and phase changes depend on the magnitude and volume of the absorbing/scattering inclusion. Consequently the logarithmic scales indicate relative changes with respect to spatial position of the inclusion (percentage of changes for intensity, and degrees for phase shift). In the figure we limit the color scales to span four orders of magnitude from both the positive and negative maximum changes.
Fig. 3.
Photon migration spatial sensitivity profile (logarithmic scale) for absorbing (panels a and b), and scattering (panels c and d) inclusions. Panels a and c report intensity changes (%); panels b and d report phase shift changes (in degree).
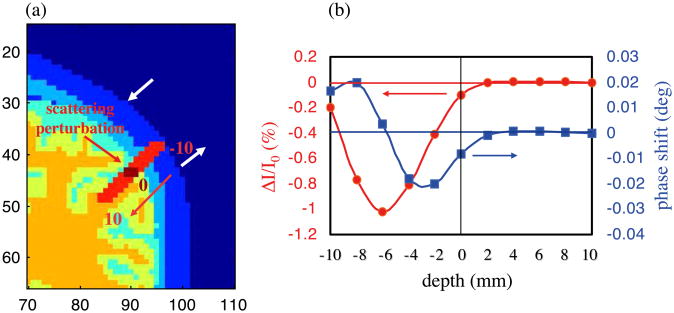
The intensity and phase changes induced by a focal scattering increase at different depths within the cortex are shown in Fig. 4. Based on these simulations, we see that a scattering inclusion that causes a 0.1% change in intensity in the brain cortex will cause a phase shift of 0.008° at a modulation frequency of 100 MHz. This phase shift is at the detection limit for current frequency-domain systems (Wolf et al., 2002) (see related section in the discussion).
Fig. 4.
(a) Position of the scattering inclusion in the head (red line); (b) Intensity (red curve, left axis) and phase (blue curve, right axis) changes due to the scattering inclusion. The origin (depth = 0) corresponds to a pixel on the cortex. We moved the scattering inclusion 10 mm above the cortex (−10 in the figure), and 10 mm deeper in the brain (+10 in the figure), with 2mm steps along the red line (panel a). Source and detector positions are indicated by the black arrows.
Experiments
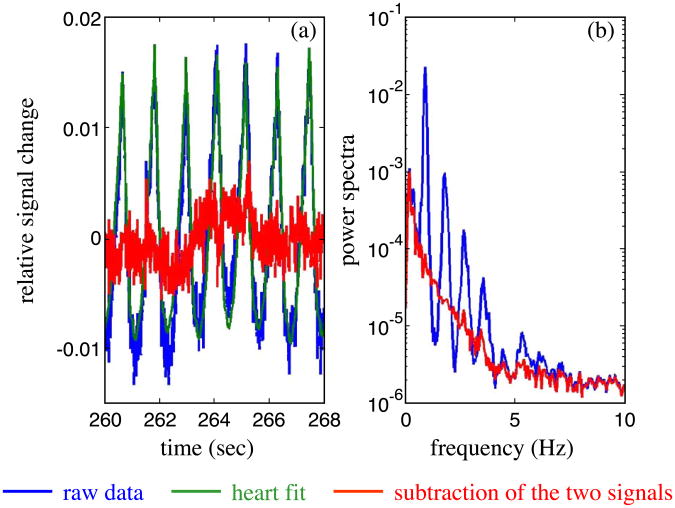
Our major signal processing effort focused on optimizing filters that reduce the background physiological variation without biasing the resultant fast neuronal signal. While the instrumental noise of our CW system is typically less than 0.1% and easily reduced by block averaging a large number of stimuli (500–1000 stimuli), the physiological noise, including arterial pulsations, respiration, and Mayer waves, causes intensity oscillations of 1–5% in amplitude. In this case, as many as 10,000 events may be required to reduce the signals to below the contrast of the fast signal. Mayer waves and respiration are low frequency oscillations, typically 0.1 and 0.3 Hz, respectively, and we can efficiently filter them by applying a high pass filter with a cut-on frequency of 0.5–1 Hz. The oscillations of the optical data due to arterial pulsation have a frequency of about 1 Hz with strong second, third, and fourth harmonics. In our experiments we adjusted the stimulation rate for each subject to a frequency between 4 and 5 Hz, optimized to be shifted respect to any arterial pulsation harmonics. We used an adaptive filter to remove the heartbeat from the intensity data. As proposed by Gratton et al. (1995a), this filter first calculates an average heartbeat pulse waveform, and then subtracts this waveform from each individual heartbeat after fitting for beat-to-beat variation in the amplitude and period. Fig. 5a reports 8 s of the raw data (blue) collected in one of our subjects at 100 Hz. The green curve in the same figure shows the adaptive heart filter, and the red curve is the resulting data after subtraction of the heart signal. Fig. 5b reports the power spectra of the raw data (blue) and of the filtered data (red). As shown in Fig. 5b, our filter can achieve a reduction of more than a factor of 10 in the fundamental and successive heart harmonics.
Fig. 5.
(a) Temporal traces of the raw optical signal (blue), the heart fit (green), and the subtraction of the two curves (red). (b) Power spectra of the raw (blue) and filtered (red) data.
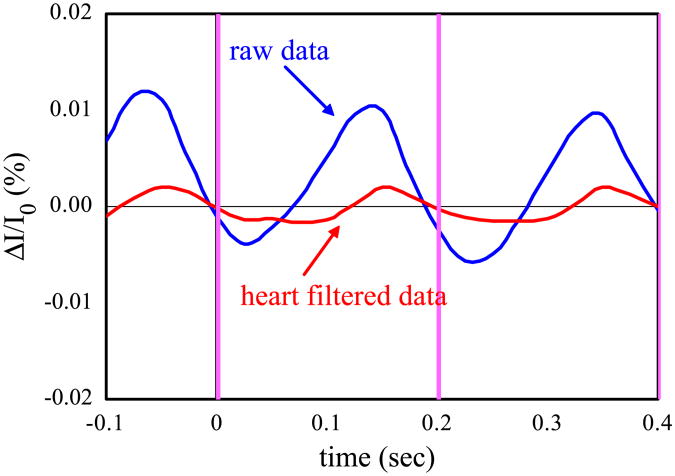
An example of the effectiveness of the adaptive heart filter is shown in Fig. 6. The graphs report the time traces of the optical signal acquired on subject number 2 during rest, block averaged with a false stimulation sequence of 1000 stimuli at a rate of 5 Hz. The blue curve is obtained by block averaging the optical data high pass filtered at 2 Hz, the red curve is obtained from the same data after removing the heart with the adaptive filter. Cleary, without the heart filter we might falsely interpret the optical signal as a fast response to the stimulus.
Fig. 6.
Time traces of the block averaged intensity during the rest periods block averaged with a false stimulation sequence (subject number 2). The blue curve is calculated from the optical data high pass filteredat 2 Hz, the red curve is calculated from the optical data filtered with the adaptive heart filter.
Most of our measurements on the 10 subjects provided us with a reliable optical signal. We measured a significant hemoglobin response to brain activation for all three of the protocols in all but one subject (participant number 8), for whom the SNR was low. We have reported these hemodynamic results in more detail in a different paper (Franceschini et al., 2003). For the fast signal, in 7 of the 10 subjects, we measured statistically significant intensity changes (P value < 0.05) that satisfied the criteria described in the Data Analysis section. In particular, we detected a robust fast signal in 43% of the measurements during finger tapping, 60% of those during tactile stimulation, and 23% of those during electrical median nerve stimulation. Table 1 summarizes the results for the contralateral fast intensity changes induced by the three stimuli for the right and left hand stimulations in all of the subjects.
Table 1.
| subject # | tapping | tactile | electrical | |||
|---|---|---|---|---|---|---|
| R | L | R | L | R | L | |
| 1 | MA | MA | + | − | + | − |
| lb | + | + | + | + | − | − |
| 2 | + | + | − | − | − | − |
| 2b | MA | MA | − | + | + | − |
| 3 | + | + | + | + | − | − |
| 3b | MA | MA | MA | MA | ||
| 4 | D | + | + | + | − | + |
| 5 | + | + | + | + | − | − |
| 6 | MA | MA | MA | MA | MA | MA |
| 7 | MA | MA | MA | MA | − | − |
| 8 | D | D | D | D | D | D |
| 9 | MA | MA | + | + | ||
| 10 | − | + | ||||
| total positive | 43% | 60% | 23% | |||
The first column indicates the subject number. The next columns report the results for the fast signal detection in the contralateral side of the brain during the three stimulation protocols. R and L indicate the hand performing the task. The + signs, and the gray cell, indicate an intensity change with a P value < 0.05, the − indicates a change under the 0.05 threshold for P. MA indicates fast changes in intensity attributed to motion artifacts. The D's for subject 8 indicate discarded cases due to a low measurement signal-to-noise ratio. The D in the right finger-tapping column for subject 4 indicates the loss of a data file due to a technical problem. A blank box means that the subject did not perform the specific task.
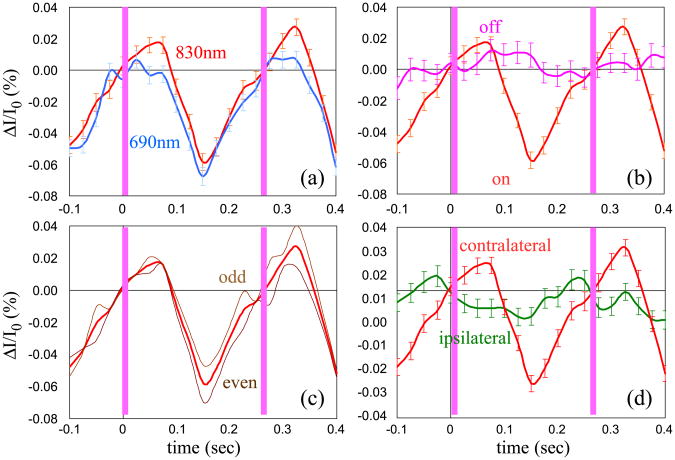
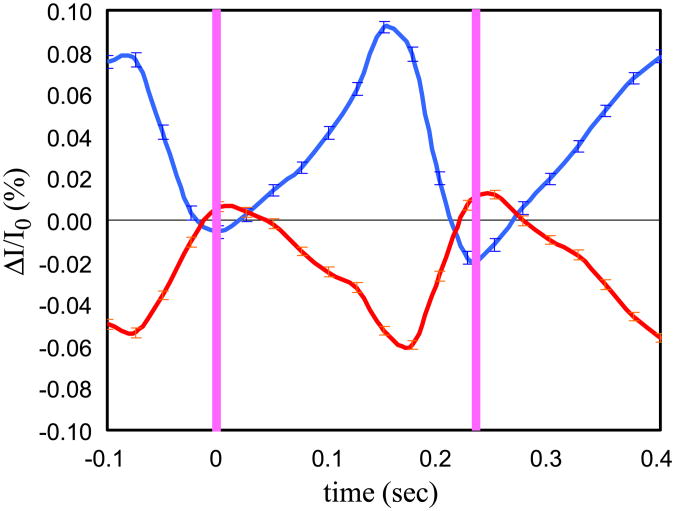
Examples of time traces of the block averaged optical signal during two stimuli are reported in the figures below. The red curve in Fig. 7 represents the time trace of the blocked average signal during stimulation for the source–detector pair in the contralateral hemisphere with maximum percent intensity changes at 830 nm during left hand finger-tapping stimulation for subject number 5. We plot two activation periods in the graphs (the pink vertical bars indicate when the fingers touch). In the four graphs, we compare the red curve with other curves obtained as per the first four criteria, which assess the robustness of the measured fast signal. In particular: graph (a) compares the signal at the two wavelengths (690 and 830 nm) at the channel of maximal response; in graph (b) the signal obtained during stimulation is compared with the signal obtained during the rest periods block averaged with a false stimulation sequence (the t test between these two curves gives a P value < 0.05); in graph (c) the block average of odd and even events is compared with the block average of all the events; we verified that random sequences considering only 1/3 of the stimuli provide time traces of the fast signal similar to those obtained by using all of the stimuli. Graph (d) compares the signal recorded in the same channel during ipsilateral and contralateral stimulation. For each curve we averaged about 800 stimuli and the error bars are the standard errors.
Fig. 7.
Time traces of the block averaged intensity during left hand finger-tapping stimulation for subject number 5. The red curve in all of the graphs is the signal for the source–detector pair in the contralateral hemisphere with maximum percent intensity changes at 830 nm. The blue curve in panel (a) is the same signal as detected at 690 nm. In panel (b) the pink curve is the signal from the same source–detector couple obtained during the rest periods block averaged with a false stimulation sequence. In panel (c) the brown curves are the block average of odd and even events. In panel (d) the green curve is the signal during ipsilateral stimulation. The pink vertical bars indicate the times when the fingers touch. The error bars are the standard errors.
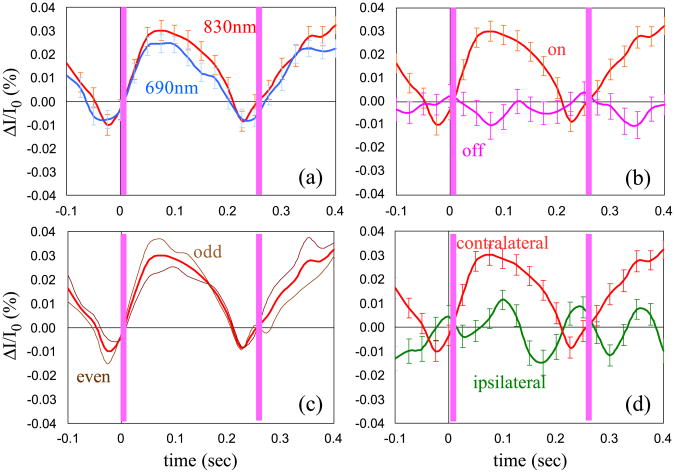
Fig. 8 shows the same criteria for the same subject, for the same source–detector pair, for left hand finger-tactile stimulation. The repetition rate of the stimulus in this subject was 3.7 Hz.
Fig. 8.
As Fig. 7, but left hand finger-tactile stimulation for same subject number 5.
We calculated the latency and the amplitude of the fast signal for each subject and each stimulation by considering the source–detector pair with the largest response. We defined the latency as the time from the origin to the first positive (P peak) and negative (N peak) maximum of the optical signal. For finger-tapping, the origin was the time at which the thumb and the middle finger touched; for finger-tactile, when the finger of the experimenter touched the first three fingers of the subject; for median nerve stimulation, when the 0.2-ms current pulse was delivered. The amplitude is given by the peak-to-peak percent intensity change of the optical signal. Table 2 reports the average and the standard errors of the P and N peaks and the amplitude of the signal at the two wavelengths calculated for all of the positive fast signal cases (both left and right hand stimulation) listed in Table 1.
Table 2.
| Stimulation | P peak (ms) | N peak (ms) | Amplitude at 690 nm (%) | Amplitude at 830 nm (%) |
|---|---|---|---|---|
| Tapping | 60 ± 20 | 180 ± 15 | 0.10 ± 0.04 | 0.12 ± 0.02 |
| Tactile | 90 ± 15 | 180 ± 20 | 0.07 ± 0.01 | 0.07 ± 0.02 |
| Electrical | 20 ± 10 | 125 ± 20 | 0.04 ± 0.01 | 0.04 ± 0.02 |
Average across subjects and standard error of the latency and the amplitude of the fast signal. Uncertainties are given as standard errors.
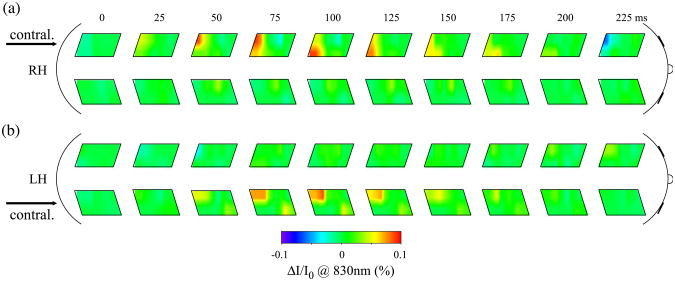
The spatial maps of the block averaged intensity changes measured in subject number 5 during the first 225 ms of tactile stimulation are reported in Fig. 9. The top maps refer to a right hand task; the bottom maps refer to a left hand task. The corresponding contralateral cortex is indicated by an arrow. The maps show an increase of intensity (red) with a latency of about 100ms. The small asymmetry of the activation area in the optical maps during left and right stimulation is because placement of the left and right probes on the head of this subject was not perfectly symmetrical.
Fig. 9.
Sequence of optical maps of intensity changes during right (a) and left (b) hand tactile stimulation. Time equal zero represents the time when the fingers touch. The arrows indicate the brain hemisphere contralateral to the stimulated hand.
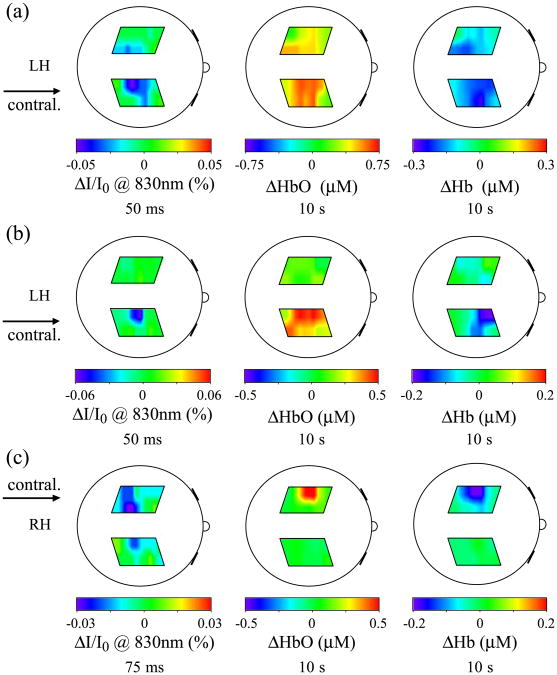
Fig. 10 reports the back-projection maps of the fast signal intensity changes (left), the oxy-hemoglobin changes (middle), and deoxy-hemoglobin changes (right) in three examples illustrating the different situations we encountered in comparing the fast signal with the hemoglobin maps: (a) left hand finger-tapping stimulation (subject number 2); (b) left hand finger-tactile stimulation (subject number 1b); and (c) right hand finger-tactile stimulation (subject number 2). In the first case, Fig. 10a, the three signals are colocalized, but the hemodynamic maps show a broader activation area than does the fast signal map. There is an ipsilateral activation in both the fast signal and the hemodynamic response. In Fig. 10b, the oxy- and deoxy-hemoglobin maps also show a broader activation area than does the fast signal map. In this case deoxy-hemoglobin is more anterior than the fast signal. In Fig. 10c, both oxy- and deoxy-hemoglobin are more anterior than the fast signal, which in this case is broader than the hemodynamic.
Fig. 10.
Fast signal maps (left) 50–75 ms after stimulus onset, compared with corresponding oxy-hemoglobin (center) and deoxy-hemoglobin (right) maps after 10 s of stimulation. (a) Subject number 2 during left hand finger-tapping stimulation; (b) subject number 1 during left hand finger-tactile stimulation; (c) subject number 2 during right hand finger-tactile stimulation.
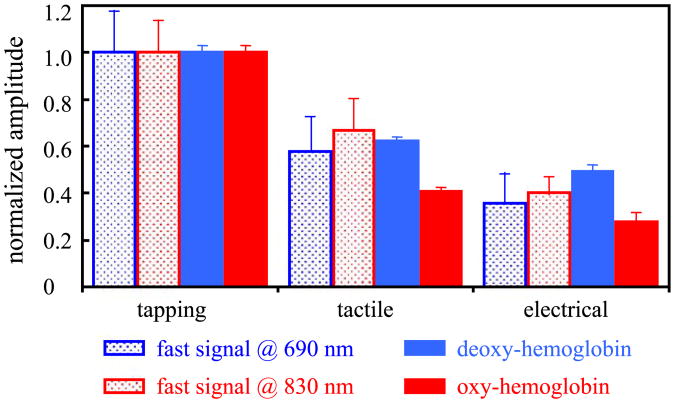
In Fig. 11 we compare the amplitude of the fast signal with the changes in oxy- and deoxy-hemoglobin concentrations for all of the cases in which we recorded a positive fast signal. For the fast signal we consider the amplitude reported in Table 2; for the hemoglobin changes we consider the average amplitude between 5 and 10 s after the onset of the stimulation. For the comparison, we normalize the fast signal and the hemoglobin concentration changes with the amplitude of the finger-tapping stimulation. The error bars represent the standard errors.
Fig. 11.
Amplitude of the fast signal and hemoglobin concentration normalized with respect to the amplitude during finger-tapping stimulation. The amplitudes are given by the grand average during both left and right hand stimulation of all of the subjects who show positive detection of fast signal.
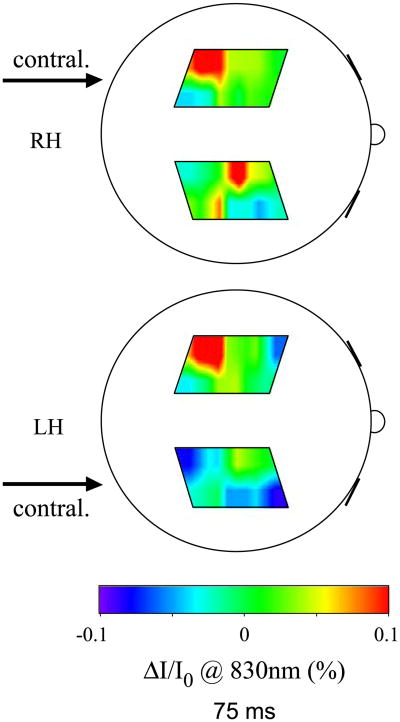
A problem that we encounter during finger-tapping is our inability to separate the evoked fast response from possible motion artifacts. In some cases the tapping at 4–5 Hz caused vibrations, which propagated through the subject's arm and shoulder to the subject's head. These vibrations changed the optical coupling between the probe and the head, causing changes in the detected intensity. In these cases, the intensity change was not localized but spread over a large area, the timing of the onsets was different at different locations, and the spatial pattern of the changes is relatively insensitive to right or left hand stimulation. Fig. 12 shows maps of intensity changes that we attribute to motion artifacts. The maps are from subject 2b during right (top) and left (bottom) hand tapping 75 ms after the finger touch.
Fig. 12.
Optical maps of intensity changes affected by motion artifacts during right (top) and left (bottom) hand stimulation 75 ms after stimulus onset. The arrows indicate the brain hemisphere contralateral to the stimulated hand.
In some cases, for the same stimuli, the fast signal maximum was positive and sometimes was negative. We noticed this behavior across subjects, but also in the same subject for adjacent source–detector locations. Fig. 13 shows an example of this during right hand finger-tapping stimulation in subject 3. The red and blue curves show the percent intensity changes for source 2 with detector 9 and 13, respectively.
Fig. 13.
Intensity changes in two adjacent locations on subject number 3 during right hand finger-tapping.
Discussion
The experimental results presented in this paper demonstrate the feasibility of measuring the fast signal with DOI. In fact, in the cases in which we detected rapid intensity changes, the changes revealed the expected characteristics for signals related to brain activity, namely, (1) the larger change in intensity is on the side contralateral to the stimulated hand; (2) the timing is similar to that reported (Gratton et al., 1995b, 2001; Steinbrink et al., 2000), and (3) the optical maps show the fast signal spatially localized in the same region as the hemodynamic response. Since the amplitude of the fast signal is small and buried under instrumental and/or physiological noise, we established five criteria with which to assess its robustness and validity. We also show possible measurement artifacts that need to be considered, and illustrate our preliminary findings as to the origin of the optical fast signal (scattering or absorption) and the neurovascular coupling (spatial colocalization, size and amplitude of the fast and hemodynamic signals).
Detectability of the fast signal
While the literature on optical measurements of hemodynamic response to brain activation is increasingly voluminously, few previous efforts in the literature report noninvasive optical measurements of the fast signal in humans. The measurement of the fast signals is much more difficult than that of hemodynamic because the time scale and the amplitude are both two orders of magnitude smaller, necessitating use of instruments that acquire at a rate higher than 20 Hz with a good SNR. Also, while hemodynamic response is optically measurable by averaging few trials, an average of several hundreds of stimuli is necessary to measure the fast signal. Our system is the first to allow imaging of a large area of the head (two 5.6 × 6.0 cm2 maps) with adequate temporal resolution (40–100 Hz), good SNR (1000–10,000), and simultaneous measurement at two wavelengths (690 and 830 nm). The limited number of sources and detectors of our system, and the fact that we did not have overlapping measurements with the probe geometry used, and therefore had to use back-projection to reconstruct our images, gave us a poor spatial resolution and nonuniform spatial sensitivity. In the optical maps in Figs. 9 and 10, the activated area is large due to our poor spatial resolution. This does not necessarily mean that the fast signal is spread over a large area. In fact, the fast signal can be well localized but in a position that is probed by multiple source–detector pairs. With back- projection the whole volume probed by these source–detector pairs will appear as activated. Moreover, because of the non-uniform spatial sensitivity of our probe geometry, we will not be able to detect the fast signal if the focal changes due to the fast signal occur in a low sensitivity area.
Because of the weakness of the fast signal, we decided to add five criteria to the statistical significance (P value < 0.05) when assessing the validity of the measurement. Figs. 7 and 8 show the time course of the fast signal and illustrate four of the five criteria. In graphs (a) the signal at two wavelengths is compared. The amplitude of the signal at the two wavelengths can be slightly different (for reasons we will discuss below), but the signal should be present in both. Also, the time course should be the same, since the temporal effect of any absorption or scattering changes should be equal for the two wavelengths. Graphs (b) show that the signal obtained by a block average of rest periods using a false stimulation sequence is different than the signal obtained averaging with the real sequence during the stimulation periods. The signal obtained by the block average during rest should be flat. If not optimally filtered, possible measurement artifacts such as arterial pulsation and other physiological or instrumental noises can contribute to a signal change that can lead to a false fast signal (see Fig. 6). Graphs (c) compare the signals obtained using the block average of two subsets of stimuli. That the two subgroups are identical indicates that the resultant signal is not due, for example, to a random spike during the measurement, or to noise at a different frequency that is not completely averaged out by blocking 500–1000 stimuli. Graphs (d) compare the results of fast signal measurements in the same location during stimulation of contralateral and ipsilateral hands. We expect that the amplitude of the fast signal will be lower during ipsilateral stimulation than during contralateral stimulation. This will be in agreement with the hemodynamic response, which is typically smaller during ipsilateral somatosensory stimulation (Franceschini et al., 2003).
Finally the fifth criterion, which requires spatial localization of the fast signal in a small area contralateral to the stimulated hands is shown in (Figs. 9, 10, and 12). The limits we place on the spatial extent of the activation allow us to recognize the false fast signal generated by motion artifacts. Our major concern during the 4–5 Hz finger-tapping is the transmission of vibrations from the subject's arm to the subject's shoulder and head. These vibrations modify the optical coupling between fibers and skin, causing changes in delivered and detected intensity, which can contribute to the optical signal in such a way as to overlap with the fast signal. Since the vibrations are caused by the stimulus, these artifacts have the same frequency of the stimulation, but should affect all of the source–detector pairs. The ability of our instrument to simultaneously map two large areas of the brain in the two hemispheres allows us to discern these measurement artifacts from the real, localized neuronal signal. Unfortunately we were not able to subtract the motion artifact from the neuronal activation signal, and we had to discard the datasets that presented common signal changes in all of the source–detector locations.
Table 1 reports the results of fast signal detection in all of the subjects for all of the stimuli. The intensity changes were statistically significant, and satisfied our five criteria in 43% of the measurements during finger tapping, 60% of those during tactile stimulation, and 23% of those during electrical median nerve stimulation. Because of the probable scattering nature of the fast signal, and because our probe geometry was not dense enough to cover the sensorimotor area homogeneously, we may have missed the activation in cases where the activation was localized in the zero sensitivity zone of the sources and detectors shown in the simulated Monte Carlo data in Fig. 3. We believe that improved detectability of the fast signal will be achieved by increasing the number of optodes and providing more uniform spatial coverage through overlapping measurements.
In measuring the fast signal during median nerve stimulation we achieved a lower detection rate than with the other two stimuli. In agreement with previous PET studies (Mima et al., 1999), we have shown (Franceschini et al., 2003) that median nerve electrical stimulation elicited a weaker hemodynamic response than did active movement and tactile stimulation. In addition, for the hemodynamic response, the size of the activated brain area during median nerve stimulation is half of that during the other two stimuli (Franceschini et al., 2003). Assuming a near-linear model of neurovascular coupling (Heeger et al., 1999; 2000; Hess et al., 2000; Logothetis et al., 2001; Yang et al., 1997), the lower amplitude and smaller size of the hemodynamic response should correspond to a weaker neuronal activation localized in a smaller area. This would imply a smaller fast signal intensity change, a lower SNR, and a lower detection rate for median nerve stimulation relative to motor and tactile stimulation.
The lower detection rate during finger-tapping than during tactile stimulation—even if finger-tapping provides a stronger activation—is because, with this stimulus, we discarded several datasets that were affected by motion artifacts, as discussed above.
Measured latency and amplitude of the fast signal
Measurements of the fast signal reported show a latency of about 50–150 ms (Gratton et al., 1997b; Steinbrink et al., 2000). In a study by Gratton et al. (1997b), a comparison of visual evoked potentials (VEP) and fast signal measurements repeated in the same subjects shows good temporal correlation, with a peak response for both signals at about 100 ms after stimulation. The good temporal agreement between the optical fast signal and the electrical activity in Gratton et al. (1997b) suggests that the fast signal should be directly related to neuronal activity rather to the subsequent hemodynamic response. In difference to the study of Gratton et al. (1997b), our stimuli are presented at a higher repetition rate such that the measured fast signal does not reach a baseline between stimuli. We thus have difficulty in zeroing our signals. As a result, we observe positive and negative peaks during the 200-ms interstimulus interval in agreement with Gratton et al. (1997b) and Steinbrink et al. (2000). In all but one of our measurements, the positive peak preceded the negative peak. The latency of the P peak was 60, 90, and 20 ms for tapping, tactile and electrical stimulation, respectively. The latency of the negative peak was 180 ms for tapping and tactile stimulation and 125 ms for electrical stimulation. In the case of median nerve stimulation we had a smaller standard deviation than with the other two stimulations.
Two different groups have reported amplitude changes of the fast signal for median nerve stimulation (Steinbrink et al., 2000), and finger-tapping (Wolf et al., 2002) stimulation. The amplitude changes range from 0.02% to 0.3% for different stimuli and different subjects. Our results show amplitude changes of the same order of magnitude (from 0.01% to 0.24%). We did not find any significant differences in the amplitudes of the signal at the two wavelengths. However, we observed that the amplitude of the fast signal decreases significantly from tapping to electrical stimulation.
Origin of the fast signal
In vitro optical measurements in neurons and other brain cells have been shown to produce light scattering changes (Andrew et al., 1994; Cohen 1973; Cohen et al., 1968; Federico et al., 1994; Stepnoski et al., 1991). It has been shown that fast hemodynamic changes (Sandman et al., 1984) on a time scale of 100 ms correlate with event-related potentials. At present, it is not clear whether the fast changes measured optically in vivo noninvasively are due to scattering or absorption changes.
Our experimental results seem to confirm the hypothesis that the fast signal is the result of changes in light scattering caused by changes in the physical properties of cells. The Monte Carlo simulations reported in Fig. 3 show that the light spatial sensitivity profile in the human head differs due to absorbing or scattering perturbations. In the case of a scattering variation, the light intensity and phase shift bundles show areas of positive, negative, and zero change. In our measurements, the results for the fast signal show increases and decreases in intensity for the same stimulus in different subjects, and in some cases for adjacent optodes on the same subject (see Fig. 13). This sign change is not justified in the case of a focal absorption change. However, as the Monte Carlo results show, it can happen in the presence of a focal scattering change. Based on these simulations, depending on the relative positions of the focal activation and the location of the optodes, we can detect positive or negative intensity changes. Thus, our experimental findings support the hypothesis that the fast signal has a scattering origin. Still, to validate the findings, we need to take measurements with a much denser array of sources and detectors so as to achieve a higher spatial resolution, and preferably with 6 or more wavelengths to spectroscopically distinguish scattering from absorption changes.
The data at the two wavelengths used in this study (690 and 830 nm) do not reveal any information about the spectral characteristics of the fast signal. If the signal change results from a hemodynamic response, we might expect a larger signal change at 830 than at 690 nm consistent with a dominant oxy-hemoglobin modulation relative to deoxy-hemoglobin as normally seen with brain activation. The fact that the amplitude of the fast signal is the same at both wavelengths suggests another contrast mechanism, but does not alone rule out absorption.
Phase versus amplitude measure of the fast signal
Studies have shown that phase measurements are more sensitive to scattering changes than to absorption changes (Gratton et al., 1997a). Because the fast signal appears to be the result of a scattering perturbation, phase measurements of the fast signal were originally considered more effective than other measurements (Gratton et al., 1997b). However, more recent works have argued that, because intensity measurements offer a higher signal-to-noise ratio, these are the more effective measurements of the fast signal (Steinbrink et al., 2000). Our Monte Carlo simulations show that a focal scattering change in the cortex that causes a 0.1% change in intensity causes only a 0.008° phase shift at 100 MHz (see Fig. 4). These results, obtained in our more realistic and more sophisticated 3D head model, confirm the results of previous Monte Carlo simulation (Steinbrink et al., 2000) obtained in a simplified geometry (Okada et al., 1997). The results shown in Fig. 4 show a particular case, dependent on the magnitude and location of the scattering change and on the optical properties and thickness of the different layers. Nevertheless, by looking at the spatial sensitivity Figs. 3c and d, it is clear that there are no deep locations in the head for which we can have a large phase shift and a small intensity change. Since the intensity and phase bundles in the brain essentially overlap, intensity and phase changes for different scattering properties of the perturbation and different head optical properties and geometries will scale maintaining a similar relative difference, as shown in Fig. 4.
The instrumental noise of our CW system, acquiring at a rate of 10–50 Hz, is typically less than 0.1%. Thus, when averaging hundreds of stimuli, we can achieve a standard error of 0.001– 0.005% and a contrast-to-noise ratio of 30. With an optimized frequency-domain system, Wolf et al. reports a phase noise level of 0.001° after averaging the signal over the stimulation period (5–10 min) (Wolf et al., 2002). This translates to a noise level of 0.1–0.2° when acquiring at a rate of 40 Hz (the reported noise in the intensity for that system is 0.05–0.08% at 40 Hz). By averaging 1000 events, the noise on the phase (0.004–0.006°) will still be of the same order of magnitude as the phase shift due to the fast signal (from our calculations 0.008°). To achieve the same contrast-to-noise ratio of an intensity measurement it will be necessary to average 100,000 trials with a phase measurement. This explains the intensity measurements' higher fast signal detection rate relative to phase measurements reported by Wolf et al. (2002). Because of the higher contrast-to-noise ratio, we conclude that intensity measurements are more effective than phase measurements for the noninvasive detection of the fast signal.
Improving the signal-to-noise ratio in the measured fast signal
In our experiments, while the instrumental noise was sufficiently reduced by averaging 500–1000 stimuli, physiological fluctuations such as arterial pulsation caused intensity changes 10–50 times larger than those expected from the fast signal, and necessitated additional signal processing to remove them. Previous works have shown the importance of optimizing the filters that reduce the background physiological variation without biasing the resultant fast neuronal signal (Gratton et al., 1995a). Mayer waves (approximately 0.1 Hz) and respiration (approximately 0.3 Hz) can be efficiently filtered by applying a high pass filter of 0.5–1 Hz. Because the intensity oscillations due to arterial pulsation have a frequency of about 1 Hz, with strong harmonics that extend to the frequency band of the fast signal, we cannot efficiently use band pass filters. Fig. 6 (blue curve) shows that when the arterial oscillations are not prefiltered that averaging 1000 stimuli does not remove the arterial signal and the resultant signal can look like fast signal. As shown in Fig. 5, our current adaptive filter can achieve a reduction of a factor 10 or more on the arterial pulsation intensity fluctuations, which is adequate for detection of the fast signal after averaging approximately 100–500 events. Improvements in the filters can increase the detectability of the fast signal. For example, filters to suppress motion artifacts will allow us to not discard most of the finger-tapping stimulation datasets. A reduction of the residual physiological 1/f noise shown in Fig. 5b to the instrumental noise floor will allow us to reduce the number of stimuli necessary to achieve a good SNR.
Coregistration of hemoglobin and fast signal
Previous works (Gratton and Fabiani, 2001; Gratton et al., 2000, 2001; Wolf et al., 2002) using systems with fewer source–detector combinations and covering smaller areas of the cortex have shown colocalized fast signal and vascular response. Fig. 10 compares optical maps of the fast signal with corresponding maps of hemodynamic response. The three examples reported show that, while in some cases the signals seem to be well colocalized, there are other cases in which the fast signal and the hemodynamic response are in slightly different locations or have different sizes. Based on these results, we cannot draw any strong conclusions about spatial colocalization and spatial extent of the neuronal and hemodynamic signals. This is because of the low resolution and the inhomogeneous spatial sensitivity to focal changes associated with the back-projection method used with our probe geometry. In fact, in our work, we wished to acquire contralateral and ipsilateral motor cortices simultaneously, and to extend the coverage to two large areas so as to be able to discern motion and systemic artifacts from the fast signal. The resulting probe geometry, while assuring the coverage of two large areas, gave us poor spatial resolution and allowed for image reconstruction with back-projection only, because of the lack of overlapping measurements. To overcome this limitation, we will need to develop a system with a larger number of optodes and a probe geometry with overlapping measurements, and employ tomography instead of back-projection to reconstruct the images.
In this work, we activated the sensorimotor cortex with three different stimuli. We know from the literature (Mima et al., 1999), and from our findings (Franceschini et al., 2003), that the hemodynamic evoked response has smaller amplitude with passive movement than with active movement. In Fig. 11, we compare the grand average of the relative amplitude of the fast signal during tactile and electrical stimulation with respect to finger-tapping stimulation with the corresponding relative amplitudes of oxy- and deoxy-hemoglobin (Franceschini et al., 2003). The relative changes in the fast signal and deoxy-hemoglobin show the same decrease in amplitude with stimulus type. We observe a slightly weaker correspondence between fast signal and oxy-hemoglobin concentration. This is because during finger-tapping the oxy-hemoglobin concentration is contaminated by the systemic increase in heart rate and blood pressure (Franceschini et al., 2003). These systemic signals are in the arterial side and therefore have minimal influence on deoxy-hemoglobin concentration. Furthermore, they are smaller or not even present during passive stimulation (tactile and electrical). It is exciting to observe the same decrease in amplitude for both hemoglobin and the fast signal, which should represent a direct measurement of neuronal activation. The linear correspondence between the amplitude of neuronal and vascular response under different stimuli may indicate a linear model of neurovascular coupling. Still, because of the strong assumptions and approximations we made when calculating hemoglobin changes, and because we considered only the intensity changes for the fast signal, our results are not quantitative. For instance the decrease in amplitude with the type of stimuli might also reflect a decrease in size or increase in depth of the activation, thus increasing the partial volume reduction of the measured amplitude of the optical signals.
Conclusions
Thus far we have been able to measure a fast optical change in intensity following activation (latency approximately 50–150 ms) in about approximately 60% of the subjects tested. This success rate follows the adoption of rigid exclusion criteria to avoid misinterpretation due to possible measurement artifacts. The relative changes in intensity associated with this signal were in average 0.07%, larger than the instrumental noise (0.001–0.005 after averaging approximately 1000 stimuli). We believe that we can improve this statistic by optimizing the protocol and the signal processing, and by using a denser source–detector array with overlapping measurements to provide more uniform coverage of the head. The ability of measuring optically the neuronal activation in humans, noninvasively, simultaneously with the vascular response will lead to the advance of our understanding of brain physiology by revealing amplitude–spatial–temporal features of neurovascular coupling not currently accessible with existing imaging techniques.
Acknowledgments
We would like to thank John Thompson, and Shalini Nadgir for technical assistance during the measurements. We are grateful to the volunteers who participated in this study. The authors thank Anders Dale for providing the 3D MRI segmented head data. This research is supported by the U.S. National Institutes of Health (NIH) grants R01-MH62854, R01-HD42908, and 5P41-RR14075.
References
- Andrew RD, Macvicar BA. Imaging cell volume changes and neuronal excitation in the hippocampal slice. Neuroscience. 1994;62:371–383. doi: 10.1016/0306-4522(94)90372-7. [DOI] [PubMed] [Google Scholar]
- Boas DA, Culver J, Stott J, Dunn AK. Three dimensional Monte Carlo code for photon migration through complex heterogeneous media including the adult head. Opt Express. 2002;10:159–170. doi: 10.1364/oe.10.000159. [DOI] [PubMed] [Google Scholar]
- Cohen LB. Changes in neuron structure during action potential propagation and synaptic transmission. Physiol Rev. 1973;53:373–413. doi: 10.1152/physrev.1973.53.2.373. [DOI] [PubMed] [Google Scholar]
- Cohen LB, Keynes RD, Hille B. Light scattering and birefringence changes during nerve activity. Nature. 1968;218:438–441. doi: 10.1038/218438a0. [DOI] [PubMed] [Google Scholar]
- Colier WN, Quaresima V, Oeseburg B, Ferrari M. Human motor-cortex oxygenation changes induced by cyclic coupled movements of hand and foot. Exp Brain Res. 1999;129:457–461. doi: 10.1007/s002210050913. [DOI] [PubMed] [Google Scholar]
- Dale AM, Fischl B, Sereno MI. Cortical surface-based analysis: I. Segmentation and surface reconstruction. Neuroimage. 1999;9:179–194. doi: 10.1006/nimg.1998.0395. [DOI] [PubMed] [Google Scholar]
- Delpy DT, Cope M, van der Zee P, Arridge S, Wray S, Wyatt J. Estimation of optical pathlength through tissue from direct time of flight measurement. Phys Med Biol. 1988;33:1433–1442. doi: 10.1088/0031-9155/33/12/008. [DOI] [PubMed] [Google Scholar]
- Fallgatter AJ, Strik WK. Reduced frontal functional asymmetry in schizophrenia during a cued continuous performance test assessed with near-infrared spectroscopy. Schizophr Bull. 2000;26:913–919. doi: 10.1093/oxfordjournals.schbul.a033505. [DOI] [PubMed] [Google Scholar]
- Federico P, Borg SG, Salkauskus AG, MacVicar BA. Mapping patterns of neuronal activity and seizure propagation by imaging intrinsic optical signals in the isolated whole brain of the guinea-pig. Neuroscience. 1994;58:461–480. doi: 10.1016/0306-4522(94)90073-6. [DOI] [PubMed] [Google Scholar]
- Franceschini MA, Toronov V, Filiaci M, Gratton E, Fanini S. On-line optical imaging of the human brain with 160-ms temporal resolution. Opt Express. 2000;6:49–57. doi: 10.1364/oe.6.000049. [DOI] [PubMed] [Google Scholar]
- Franceschini MA, Fantini S, Thompson JJ, Culver JP, Boas DA. Hemodynamic evoked response of the sensorimotor cortex measured non-invasively with near-infrared optical imaging. Psychophysiology. 2003;40:548–560. doi: 10.1111/1469-8986.00057. [DOI] [PMC free article] [PubMed] [Google Scholar]
- Gratton G, Corballis PM. Removing the heart from the brain: compensation for the pulse artifact in the photon migration signal. Psychophysiology. 1995;32:292–299. doi: 10.1111/j.1469-8986.1995.tb02958.x. [DOI] [PubMed] [Google Scholar]
- Gratton G, Fabiani M. Shedding light on brain function: the event-related optical signal. Trends Cogn Sci. 2001;5:357–363. doi: 10.1016/s1364-6613(00)01701-0. [DOI] [PubMed] [Google Scholar]
- Gratton G, Corballis PM, Cho E, Fabiani M, Hood DC. Shades of gray matter: noninvasive optical images of human brain responses during visual stimulation. Psychophysiology. 1995a;32:505–509. doi: 10.1111/j.1469-8986.1995.tb02102.x. [DOI] [PubMed] [Google Scholar]
- Gratton G, Fabiani M, Friedman D, Franceschini MA, Fantini S, Corballis PM, Gratton E. Rapid changes of optical parameters in the human brain during a tapping task. J Cogn Neurosci. 1995b;7:446–456. doi: 10.1162/jocn.1995.7.4.446. [DOI] [PubMed] [Google Scholar]
- Gratton E, Fantini S, Franceschini MA, Gratton G, Fabiani M. Measurements of scattering and absorption changes in muscle and brain. Philos Trans R Soc London, Ser B. 1997a;352:727–735. doi: 10.1098/rstb.1997.0055. [DOI] [PMC free article] [PubMed] [Google Scholar]
- Gratton G, Fabiani M, Corballis PM, Hood DC, Goodman-Wood MR, Hirsch J, Kim K, Friedman D, Gratton E. Fast and localized event-related optical signals (EROS) in the human occipital cortex: comparisons with the visual evoked potential and fMRI. Neuroimage. 1997b;6:168–180. doi: 10.1006/nimg.1997.0298. [DOI] [PubMed] [Google Scholar]
- Gratton G, Sarno A, Maclin E, Corballis PM, Fabiani M. Toward noninvasive 3-D imaging of the time course of cortical activity: investigation of the depth of the event-related optical signal. Neuroimage. 2000;11:491–504. doi: 10.1006/nimg.2000.0565. [DOI] [PubMed] [Google Scholar]
- Gratton G, Goodman-Wood MR, Fabiani M. Comparison of neuronal and hemodynamic measures of the brain response to visual stimulation: an optical imaging study. Hum Brain Mapp. 2001;13:13–25. doi: 10.1002/hbm.1021. [DOI] [PMC free article] [PubMed] [Google Scholar]
- Heeger DJ, Boynton GM, Demb JB, Seidemann E, Newsome WT. Motion opponency in visual cortex. J Neurosci. 1999;19:7162–7174. doi: 10.1523/JNEUROSCI.19-16-07162.1999. [DOI] [PMC free article] [PubMed] [Google Scholar]
- Heeger DJ, Huk AC, Geisler WS, Albrecht DG. Spikes versus bold: what does neuroimaging tell us about neuronal activity? Nat Neurosci. 2000;3:631–633. doi: 10.1038/76572. [DOI] [PubMed] [Google Scholar]
- Heekeren HR, Obrig H, Wenzel R, Eberle K, Ruben J, Villringer K, Kurth R, Villringer A. Cerebral haemoglobin oxygenation during sustained visual stimulation—a near-infrared spectroscopy study. Philos Trans R Soc London, Ser B. 1997;352:743–750. doi: 10.1098/rstb.1997.0057. [DOI] [PMC free article] [PubMed] [Google Scholar]
- Hess A, Stiller D, Kaulisch T, Heil P, Scheich H. New insights into the hemodynamic blood oxygenation level-dependent response through combination of functional magnetic resonance imaging and optical recording in gerbil barrel cortex. J Neurosci. 2000;20:3328–3338. doi: 10.1523/JNEUROSCI.20-09-03328.2000. [DOI] [PMC free article] [PubMed] [Google Scholar]
- Hirth C, Obrig H, Valdueza J, Dirnagl U, Villringer A. Simultaneous assessment of cerebral oxygenation and hemodynamics during a motor task. a combined near infrared and transcranial doppler sonography study. Adv Exp Med Biol. 1997;411:461–469. doi: 10.1007/978-1-4615-5865-1_59. [DOI] [PubMed] [Google Scholar]
- Hock C, Villringer K, Muller-Spahn F, Wenzel R, Heekeren H, Schuh-Hofer S, Hofmann M, Minoshima S, Schwaiger M, Dirnagl U, Villringer A. Decrease in parietal cerebral hemoglobin oxygenation during performance of a verbal fluency task in patients with Alzheimer's disease monitored by means of near-infrared spectroscopy (NIRS)-correlation with simultaneous rcbf-pet measurements. Brain Res. 1997;755:293–303. doi: 10.1016/s0006-8993(97)00122-4. [DOI] [PubMed] [Google Scholar]
- Hoshi Y, Tamura M. Detection of dynamic changes in cerebral oxygenation coupled to neuronal function during mental work in man. Neurosci Lett. 1993;150:5–8. doi: 10.1016/0304-3940(93)90094-2. [DOI] [PubMed] [Google Scholar]
- Kleinschmidt A, Obrig H, Requardt M, Merboldt KD, Dirnagl U, Villringer A, Frahm J. Simultaneous recording of cerebral blood oxygenation changes during human brain activation by magnetic resonance imaging and near-infrared spectroscopy. J Cereb Blood Flow Metab. 1996;16:817–826. doi: 10.1097/00004647-199609000-00006. [DOI] [PubMed] [Google Scholar]
- Logothetis NK, Pauls J, Augath M, Trinath T, Oeltermann A. Neurophysiological investigation of the basis of the fMRI signal. Nature. 2001;412:150–157. doi: 10.1038/35084005. [DOI] [PubMed] [Google Scholar]
- Mehagnoul-Schipper DJ, van der Kallen BF, Colier WN, van der Sluijs MC, van Erning LJ, Thijssen HO, Oeseburg B, Hoefnagels WH, Jansen RW. Simultaneous measurements of cerebral oxygenation changes during brain activation by near-infrared spectroscopy and functional magnetic resonance imaging in healthy young and elderly subjects. Hum Brain Mapp. 2002;16:14–23. doi: 10.1002/hbm.10026. [DOI] [PMC free article] [PubMed] [Google Scholar]
- Mima T, Sadato N, Yazawa S, Hanakawa T, Fukuyama H, Yonekura Y, Shibasaki H. Brain structures related to active and passive finger movements in man. Brain. 1999;122:1989–1997. doi: 10.1093/brain/122.10.1989. [DOI] [PubMed] [Google Scholar]
- Obrig H, Hirth C, Junge-Hulsing JG, Doge C, Wolf T, Dirnagl U, Villringer A. Cerebral oxygenation changes in response to motor stimulation. J Appl Physiol. 1996;81:1174–1183. doi: 10.1152/jappl.1996.81.3.1174. [DOI] [PubMed] [Google Scholar]
- Okada E, Firbank M, Schweiger M, Arridge SR, Cope M, Delpy DT. Theoretical and experimental investigation of near-infrared light propagation in a model of the adult head. Appl Opt. 1997;36:21–31. doi: 10.1364/ao.36.000021. [DOI] [PubMed] [Google Scholar]
- Rector DM, Poe GR, Kristensen MP, Harper RM. Light scattering changes follow evoked potentials from hippocampal schaeffer collateral stimulation. J Neurophysiol. 1997;78:1707–1713. doi: 10.1152/jn.1997.78.3.1707. [DOI] [PubMed] [Google Scholar]
- Rector DM, Rogers RF, Schwaber JS, Harper RM, George JS. Scattered-light imaging in vivo tracks fast and slow processes of neurophysiological activation. Neuroimage. 2001;14:977–994. doi: 10.1006/nimg.2001.0897. [DOI] [PubMed] [Google Scholar]
- Rinne T, Gratton G, Fabiani M, Cowan N, Maclin E, Stinard A, Sinkkonen J, Alho K, Naatanen R. Scalp-recorded optical signals make sound processing in the auditory cortex visible? Neuroimage. 1999;10:620–624. doi: 10.1006/nimg.1999.0495. [DOI] [PubMed] [Google Scholar]
- Sakatani K, Chen S, Lichty W, Zuo H, Wang YP. Cerebral blood oxygenation changes induced by auditory stimulation in newborn infants measured by near infrared spectroscopy. Early Hum Dev. 1999;55:229–236. doi: 10.1016/s0378-3782(99)00019-5. [DOI] [PubMed] [Google Scholar]
- Salzberg BM, Obaid AL. Optical studies of the secretory event at vertebrate nerve terminals. Exp Biol. 1988;139:195–231. doi: 10.1242/jeb.139.1.195. [DOI] [PubMed] [Google Scholar]
- Sandman CA, O'Halloran JP, Isenhart R. Is there an evoked vascular response? Science. 1984;224:1355–1357. doi: 10.1126/science.6729458. [DOI] [PubMed] [Google Scholar]
- Sato H, Takeuchi T, Sakai KL. Temporal cortex activation during speech recognition: an optical topography study. Cognition. 1999;73:B55–B66. doi: 10.1016/s0010-0277(99)00060-8. [DOI] [PubMed] [Google Scholar]
- Steinbrink J, Kohl M, Obrig H, Curio G, Syre F, Thomas F, Wabnitz H, Rinneberg H, Villringer A. Somatosensory evoked fast optical intensity changes detected non-invasively in the adult human head. Neurosci Lett. 2000;291:105–108. doi: 10.1016/s0304-3940(00)01395-1. [DOI] [PubMed] [Google Scholar]
- Stepnoski RA, Laporta A, Raccuia-Behling F, Blonder GE, Slusher RE, Kleinfeld D. Noninvasive detection of changes in membrane potential in cultured neurons by light scattering. Proc Natl Acad Sci U S A. 1991;88:9382–9386. doi: 10.1073/pnas.88.21.9382. [DOI] [PMC free article] [PubMed] [Google Scholar]
- Strangman G, Culver J, Thompson J, Boas D. A quantitative comparison of simultaneous BOLD fMRI and NIRS recordings during functional brain activation. Neuroimage. 2002;17:719. [PubMed] [Google Scholar]
- Strangman G, Franceschini MA, Boas DA. Factors affecting the accuracy of near-infrared spectroscopy concentration calculations for focal changes in oxygenation parameters. Neuroimage. 2003;18:865–879. doi: 10.1016/s1053-8119(03)00021-1. [DOI] [PubMed] [Google Scholar]
- Tasaki I, Byrne PM. Rapid structural changes in nerve fibers evoked by electric current pulses. Biochem Biophys Res Commun. 1992;188:559–564. doi: 10.1016/0006-291x(92)91092-5. [DOI] [PubMed] [Google Scholar]
- Toronov V, Webb A, Choi JH, Wolf M, Michalos A, Gratton E, Hueber D. Investigation of human brain hemodynamics by simultaneous near-infrared spectroscopy and functional magnetic resonance imaging. Med Phys. 2001;28:521–527. doi: 10.1118/1.1354627. [DOI] [PubMed] [Google Scholar]
- Torricelli A, Pifferi A, Taroni P, Giambattistelli E, Cubeddu R. In vivo optical characterization of human tissues from 610 to 1010 nm by time-resolved reflectance spectroscopy. Phys Med Biol. 2001;46:2227–2237. doi: 10.1088/0031-9155/46/8/313. [DOI] [PubMed] [Google Scholar]
- Villringer A, Planck J, Hock C, Schleinkofer L, Dirnagl U. Near infrared spectroscopy (NIRS): a new tool to study hemodynamic changes during activation of brain function in human adults. Neurosci Lett. 1993;154:101–104. doi: 10.1016/0304-3940(93)90181-j. [DOI] [PubMed] [Google Scholar]
- Wolf M, Wolf U, Choi JH, Gupta R, Safonova LP, Paunescu LA, Michalos A, Gratton E. Functional frequency-domain near-infrared spectroscopy detects fast neuronal signal in the motor cortex. Neuroimage. 2002;17:1868–1875. doi: 10.1006/nimg.2002.1261. [DOI] [PubMed] [Google Scholar]
- Yamamoto T, Kato T. Paradoxical correlation between signal in functional magnetic resonance imaging and deoxygenated haemoglobin content in capillaries: a new theoretical explanation. Phys Med Biol. 2002;47:1121–1141. doi: 10.1088/0031-9155/47/7/309. [DOI] [PubMed] [Google Scholar]
- Yang X, Hyder F, Shulman RG. Functional MRI BOLD signal coincides with electrical activity in the rat whisker barrels. Magn Reson Med. 1997;38:874–877. doi: 10.1002/mrm.1910380604. [DOI] [PubMed] [Google Scholar]
- Zhao H, Tanikawa Y, Gao F, Onodera Y, Sassaroli A, Tanaka K, Yamada Y. Maps of optical differential pathlength factor of human adult forehead, somatosensory motor and occipital regions at multi-wavelengths in NIR. Phys Med Biol. 2002;47:2075–2093. doi: 10.1088/0031-9155/47/12/306. [DOI] [PubMed] [Google Scholar]


