

Abstract
Background
The relationship between CD4+ T-cell counts determined soon after seroconversion with HIV-1 (baseline CD4), nadir CD4, and CD4 levels attained during highly active antiretroviral therapy (HAART) is unknown.
Methods
Longitudinal, including baseline (at or soon after HIV diagnosis), intermediate (nadir), and distal (post-HAART) CD4+ T-cell counts were assessed in 1085 seroconverting subjects who achieved viral load suppression from a large well-characterized cohort. The association of baseline with post-HAART CD4+ T-cell count was determined after adjustment for other relevant covariates.
Results
A higher baseline CD4+ T-cell count predicted a greater post- HAART CD4+ T-cell count, independent of the nadir and other explanatory variables. Together, baseline and nadir strongly predicted the post-HAART CD4+ count such that a high baseline and lower nadir were associated with a maximal immune recovery after HAART. Likelihood of recovery of the baseline count after HAART was significantly higher when the nadir/baseline count ratio was consistently ≥0.6.
Conclusions
Among viral load suppressing seroconverters, the absolute CD4+ T-cell count attained post-HAART is highly dependent on both baseline and nadir CD4+ T-cell counts. These associations further support the early diagnosis and initiation of HAART among HIV-infected persons.
Keywords: CD4 count, highly active antiretroviral therapy, outcomes, predictors, treatment response
INTRODUCTION
Among HIV-1–infected individuals receiving highly active antiretroviral therapy (HAART), the extent of CD4+ T-cell count recovery varies significantly, despite suppression of the viral load (VL). The clinical implication of this conundrum is significant because suboptimal CD4+ T-cell count recovery1–5 is associated with an increased risk of adverse clinical events.2,6–11 Prior studies have documented the negative impact of a low nadir CD4+ T-cell count on the recovery of CD4+ T-cell counts during HAART12–17 prompting the recommendation to initiate HAART at higher CD4+ T-cell counts. However, much less is known about the relationship between the proximal (baseline) CD4+ T-cell count close to infection and the CD4+ T-cell count recovery during HAART. Conceptually, it is natural to expect that after a potent therapeutic correction, CD4+ T-cell counts should return to pre-infection levels. This expectation would imply that in observational epidemiological studies, one might observe a close association between the baseline and the post-HAART CD4+ T-cell counts. Whether such an association is independent of the known relationship between the nadir and post-HAART CD4+ T-cell counts is currently unclear.
To address these questions, we evaluated a large military cohort of HIV-infected individuals with equal access to health care and in whom CD4+ T-cell counts were available soon after seroconversion, during the untreated disease course, and after initiation of HAART. With this unique resource, we sought to determine whether the baseline CD4+ T-cell counts also (and independently) influenced immune reconstitution as measured using the CD4+ T-cell counts attained during HAART after adjusting for variables known to influence immune recovery.18–29
MATERIALS AND METHODS
Study Participants
Data for this study are from HIV-infected participants of the Department of Defense HIV Natural History Study30 who initiated HAART between January 1, 1996, and January 1, 2008, whose characteristics are summarized in Table 1 and are further described elsewhere.31 Subjects who had at least 3 CD4+ T-cell count measurements after 2 years of HAART initiation were included in the present study. All individuals in the military have undergone mandatory HIV screening since the cohort began in 1985 and are tested regularly while on active duty. Enrolled subjects are seen every 6 months for HIV-related evaluations, including CD4 and VL measurements. In addition, interim CD4 and VL taken at other facilities are also entered into the database. Of these participants, 1560 (66%) had baseline and nadir CD4+ counts and at least 3 CD4 measurements available more than 2 years after HAART initiation (definitions of these time points are provided in Figure 1A). We further included only subjects with previously documented HIV-negative tests (seroconverters) and excluded subjects that never reached VL suppression or had an AIDS event after HAART. The latter 2 groups (n = 135) were excluded so that analyses would include subjects who experienced successful HAART treatment thereby reducing many confounders associated with both poor adherence and inadequate CD4 response. These exclusions also made the interpretations from our study relevant to HIV clinics in resource rich settings. Therefore, we finally included 1085 subjects who fulfilled the inclusion criteria shown in Figure 1B. Further, because we also aimed to characterize overall pattern of the CD4+ T-cell count change over time in addition to the 3 aforementioned snapshots, we estimated the CD4+ T-cell count trends over time. For that, we included longitudinally measured CD4+ T-cell counts which were available on 2131 (25,138 CD4 measurement, median; 11.8/participant) and 2180 (36,855 CD4 measurements, median; 16.9/participant) participants before and after HAART was initiated, respectively.
TABLE 1.
Characteristics of the Study Subjects
| Characteristic | n* | Description† |
|---|---|---|
| Age at HAART (yrs) | 1084 | 34.2 (7.6) |
| Female gender | 1085 | 68 (6.3%) |
| Ethnicity | ||
| European Americans | 1085 | 488 (45.0%) |
| African Americans | 476 (43.9%) | |
| Hispanic Americans | 84 (7.7%) | |
| Others | 37 (3.4%) | |
| CD4+ T cell counts (cells/μL) | ||
| Baseline‡ | 1085 | 470 (338–630) |
| Nadir‡ | 1085 | 311 (225–414) |
| Mean of phase II‡ | 1085 | 577 (422–741) |
| VL parameters | ||
| Baseline VL (log10 copies/mL) | 1082 | 4.28 (0.83) |
| Pre HAART VL (log10 copies/mL) | 1045 | 4.23 (0.75) |
| Cumulative VL (log10 copy-months/mL) | 1081 | 18.85 (10.4) |
| Overall VL decay constant | 1085 | 0.026 (0.086) |
| Temporal characteristics | ||
| Seroconversion window (yrs)‡ | 1085 | 1.37 (0.87–2.42) |
| HIV diagnosis to first CD4 (days) ‡ | 1085 | 39 (26–63) |
| HIV diagnosis to HAART (yrs) ‡ | 1085 | 2.34 (0.27–5.71) |
| Nadir to HAART (mo)‡ | 1085 | 2.00 (0.26–12.78) |
| Follow-up on HAART (yrs)‡ | 1085 | 7.58 (4.41–10.15) |
| HAART to VL suppression (yrs)‡ | 1075 | 0.41 (0.13–1.03) |
| Other characteristics | ||
| Initiated in late HAART era | 1085 | 750 (69.1%) |
| AIDS before HAART initiation | 1085 | 29 (2.7%) |
| Prior use of ART | 1085 | 519 (7.8%) |
Number of subjects on whom indicated data was available.
For continuous variables, the values represent mean (SD).
For continuous variables not following normal distribution, the values represent median (interquartile range width).
Interval between the last HIV-negative test to the first HIV-positive test.
FIGURE 1.
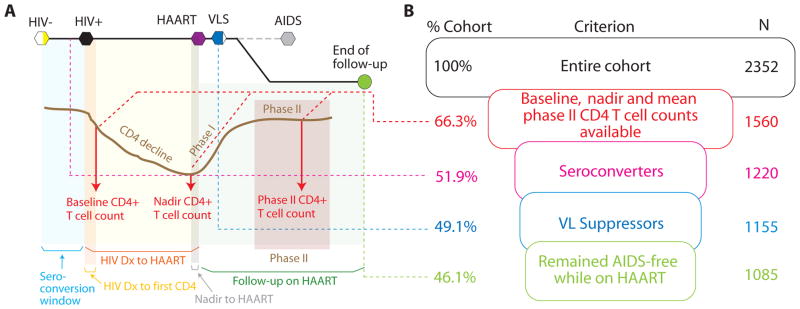
Theoretical framework and the cohort used in this study. A, The various terms used in this article are depicted in the context of a typical HIV pathogenesis events calendar. HIV-related events are shown at the top of the chart as hexagons. Partially filled hexagons indicate that not all of the cohort subjects had that event. Grayed out dashed line and the AIDS outcome indicate that these subjects were excluded from the study, and the remaining subjects were followed (green circle). The brown curve indicates a prototypic CD4+ T-cell count trajectory aligned with the HIV-related events described at the top. Postinfection, there is a decline in CD4+ T-cell count till HAART is begun after which the CD4+ T-cell count rebounds in 2 phases—phase I is a rapid reconstitution phase that, on average, is 2 years; and phase II where the rise is very slow. The red arrows indicate the 3 time points at which CD4+ T-cell counts were measured in this study (baseline measurement is close to seroconversion, nadir measurement is close to HAART initiation, and phase-II measurements are over the steady state after HAART initiation). Colored shaded areas represent the various time windows that have described in Table 1. B, The inclusion criteria funnel for the present study. The criteria are shown in boxes, whereas the proportion of the cohort fulfilling each criterion is shown to the left of the box, and the number of subjects included at each criterion is shown to the right of the boxes. To put the inclusion criteria in perspective of HIV pathogenesis, colorcoded dashed lines are shown to be extending from panel A into panel B. Of note, 228 (21%) of the recruited study subjects achieved VL suppression within 24 weeks of HAART initiation and remained VL suppressed throughout the period of follow-up.
Definitions
Baseline CD4+ T-cell count was defined as the first CD4+ T-cell count measurement after diagnosis of HIV infection (Fig. 1A). Nadir CD4+ T-cell count was the lowest CD4 measured during disease before HAART initiation. We have observed previously in this cohort that after HAART initiation, there are 2 phases of CD4+ T-cell count changes: phase I after initiation of HAART where there is a rapid increase in CD4+ T-cell counts over the first 2 years, followed by phase II with a slower gain.32 For this reason, in those subjects who had at least 3 CD4+ T-cell count measurements available 2 years post- HAART, we computed for each subject their phase II post- HAART CD4 count. This was defined as the average of all the CD4+ T-cell count measurements available beyond 2 years of therapy, thus approximating the maximum steady-state CD4+ T-cell count level attained.
In our analyses, we also included as covariates the overall exponential VL decay constant computed for the entire duration of therapy and the cumulative VL (defined as the area under the curve obtained using the trapezoidal rule) of the log10 VL from time of initiation of HAART because these 2 parameters were strong independent factors associated with CD4+ T-cell count recovery and AIDS risk during HAART, respectively.31 VL suppression on HAART was defined as attainment of a VL <400 copies per milliliter. In this cohort, VL suppression was achieved in 93% of subjects at 5 years31,32 and was associated with a prominent and durable increase in CD4+ T-cell counts compared with those who did not achieve this virologic threshold on HAART. Pre-HAART VL was defined as the average of all VL measurements 1 year before initiation of HAART (average number of pre-HAART VL measurements were 4.4 with a standard deviation of 5.27). AIDS events were defined using the 1993 classification but did not include CD4 count <200 cells per microliter as an endpoint.34
Statistical Analysis
We examined the association of baseline and nadir CD4+ T-cell counts with mean phase II CD4+ T cell counts using the following regression models. First, linear regression was used for the outcome of mean phase II CD4+ T-cell count considering the outcome as a continuous variable. We observed that the outcome variable was not normally distributed and continued to be nonnormally distributed even when the logarithmic or square-root transformations were used. Therefore, we could not use the ordinary least squares method for these analyses and instead used a nonparametric regression procedure—quantile regression. Second, we dichotomized the outcome of mean phase II post-HAART CD4 count as < or ≥500 cells per microliter. Using this binary outcome, we conducted logistic regression analyses. For both the linear and logistic regressions, we performed univariate and multivariate analyses. Covariates in the multivariate analyses included age at HAART initiation, gender, African American ethnicity, previous receipt of ART, AIDS before HAART, pre-HAART VL, overall VL decay constant during HAART, cumulative VL during HAART, and late HAART era (after calendar year 2000). Time to HAART from HIV diagnosis (or estimated date of seroconversion for known seroconverters), time on HAART, age at HAART initiation, pre-HAART VL, overall VL decay constant, and cumulative VL were included in the model as continuous variables. Also, we used χ2 test for linear trend (expressed as proportion of overall χ2) to determine the possibility of a gradient of association across categories of the baseline and mean phase II CD4+ T-cell counts. Third, to determine the time trends of CD4+ T-cell counts, we conducted nonlinear generalized estimating equations (GEE) modeling on the panel data of CD4 counts indexed from the date of initiation of HAART and extending 6 years before and after HAART initiation. The GEE results were then spline-smoothed using the Stata routine rc_spline by taking annual knots, and 95% confidence interval (CI) bands were computed for these data. The GEE models were computed assuming equal-correlation structure. Prognostic use of baseline and nadir CD4+ T-cell counts was assessed using a receiver-operating characteristic (ROC) curve and the estimated area under this curve. ROC curves were used to plot the bivariate distribution of the true-positive rate (sensitivity) and the false-positive rate (1 specificity) by varying the cut-off for dichotomization over the observed range of values. Area under the ROC curve indicated the predictive accuracy of the test under consideration. All statistical analyses were conducted using Stata 10.0 (College Station, TX) software package. Statistical significance was evaluated at a type I error rate of 0.05.
RESULTS
Influence of Baseline CD4+ T-Cell Count on CD4 Recovery
The subject characteristics are shown in Table 1. We first conducted univariate linear regression models to determine whether the baseline CD4+ T-cell count predicted the phase II post-HAART CD4 count. Figure 2A shows that there was a strong statistical association between these 2 variables. For each additional CD4+ T cell at baseline, there was a 0.36 cell higher phase II post-HAART CD4 count. Using multivariate linear regression analyses, we observed that (Fig. 2B) independent of VL, nadir CD4+ T-cell count, and other parameters, the baseline CD4+ T-cell count continued to be a strongly associated with the mean phase II CD4+ T-cell count (regression coefficient 0.48).
FIGURE 2.

Association of the baseline CD4+ T-cell count and nadir CD4+ T-cell count with phase II post-HAART CD4+ T-cell counts. A, Correlation of the baseline CD4+ T-cell count with the mean phase II CD4+ T-cell counts. Shown is a scatter plot for these 2 variables with the results of bivariate quantile regression analyses overlaid onto the scatter plot. The red line is the mean regression line with the brown lines enveloping the 95% confidence region. The results of regression are described at the top as regression coefficient, its 95% confidence interval, and statistical significance. B, Association of baseline and mean phase II CD4+ T-cell counts before and after accounting for the seroconversion window. The results are from multivariate quantile regression models. Vertical colored bars represent the point estimate, whereas the error bars represent the 95% confidence intervals for the regression coefficient. Each model is adjusted for covariates that in previous analyses were shown to associate with mean phase II CD4 cell counts 2 years post-HAART and included: age at HAART initiation, gender, African American ethnicity, previous receipt of ART, AIDS before HAART, pre-HAART VL, overall VL decay constant during HAART, cumulative VL during HAART, and late HAART era (after calendar year 2000). Time to HAART from HIV diagnosis (or estimated date of seroconversion for known seroconverters), time on HAART, age at HAART initiation, pre-HAART VL, overall VL decay constant, and cumulative VL were included in the model as continuous variables. Leftmost bar (overall) is before accounting for the serconversion window (SctWin), the hollow bar indicates results from a model that included SctWin as a covariate (as a continuous variable), whereas the remaining 3 bars are models for the indicated strata based on tertiles of SctWin (1 year and 1.94 years). C, Association of baseline and mean phase II CD4+ T-cell counts after accounting for the nadir CD4+ T-cell counts. Results are from regression models specified in legend to panel B but conducted within the indicated strata of nadir CD4+ T-cell counts. Filled bars represent the models without adjustment for seroconversion window, whereas hollow bars represent models accounting for the seroconversion window as a covariate. Seroconversion window was used as a continuous variable in the regression models. D, Influence of baseline and nadir CD4+ T-cell counts on mean phase II CD4+ T-cell count. Each of these 3 variables was divided into 3 strata as indicated. The stacked bars show the proportion of study subjects who attained the indicated phase II CD4+ T-cell count for a given combination of baseline and nadir CD4+ T-cell count stratum. The color-coded number at the top of each bar identifies a particular combination of baseline and nadir CD4+ T-cell counts. Note that, group 3 does not exist. Gp, group. E, Association between categories of baseline CD4+ T-cell count and those of mean phase II CD4+ T-cell counts before and after stratifying by nadir CD4+ T-cell count. The overall association is shown by the χ2 statistic to the right of the chart. The chart shows the proportion of this χ2 that is attributable to a linear association, which was estimated as the χ2 due to linearity/total χ2. The χ2 due to linearity was estimated as (n−1) r, where n is the number of observations, and r is Pearson correlation coefficient between category codes. F, Trajectories of CD4 cell counts 6 years before and after HAART initiation based on the baseline and nadir CD4 counts. Plot shows average (thick lines) and 95% confidence bands (thin colorcoded lines) estimates for the nonlinear spline-smoothed trajectories of CD4+ T-cell counts during HIV disease based on the same 8 exclusive groups shown in panel C among all subjects on HAART. Time zero indicates the time of HAART initiation. N, number of subjects; M, number of CD4+ T cell count measurements.
An important point to consider in our analysis was the variability in the seroconversion window—the duration between the last HIV-negative and first HIV-positive test (Fig. 1A, Table 1). We observed that there indeed was a weak yet statistically significant negative correlation between the width of the seroconversion window and the baseline CD4+ T-cell count (Pearson correlation coefficient = 20.10, P = 0.0013), that is, subjects with longer seroconversion windows had lower baseline CD4 counts. Thus it was possible that our analyses could have been influenced by this negative correlation and the variability in the seroconversion window. We used 2 different approaches to account for this variability. First, we adjusted the association between the baseline and mean phase II CD4+ T-cell counts by additionally including the seroconversion window (SctWin) as a covariate (hollow bar labeled “adjusted for SctWin” in Figure 2B). We found that this association was not substantially influenced by inclusion of seroconversion window. Second, we categorized subjects into 3 groups based on the tertiles of seroconversion window—the tertiles were at 1 year and 1.94 years. Within each tertile group, we estimated the same regression model and found that in all the 3 groups the multivariate strength of association between the baseline and mean phase II CD4+ T-cell counts was comparable. Consistent with these observations, subjects with a baseline CD4+ T-cell count of <500 cells per microliter were 2.27-fold more likely to have a mean phase II CD4+ T-cell count that was <500 cells per microliter (odds ratio: 2.27, 95% CI: 1.75 to 2.94). After adjusting for all potential confounders, this likelihood further increased (odds ratio: 3.19, 95% CI: 2.27 to 4.49).
To assess the association of baseline CD4+ T-cell count on phase II post-HAART CD4+ T-cell count, independent of nadir CD4, we first categorized study subjects according to 3 clinically meaningful strata of nadir CD4+ T-cell counts (Fig. 2C). Within the 3 strata of nadir CD4 counts (<200, 200–349, and ≥350 cells per microliter), the median time at which the nadir CD4 count was recorded before HAART initiation was 1.17, 2.89, and 1.74 months, respectively, suggesting that the pre-HAART nadir CD4 occurred near the time of HAART initiation. We found that the phase II CD4+ T-cell count was strongly predicted by the baseline CD4 count within each stratum of the nadir CD4 cell count before or after the adjustment for seroconversion window (Fig. 2C). Additional analyses were conducted which adjusted for length of follow-up and included a square root transformation of the baseline CD4 count resulting in similar findings (data not shown).
To investigate further the relationship between baseline, nadir, and post-HAART CD4 counts, we stratified subjects according to their baseline (<350, 350–699, and ≥700 cells/mL) and nadir (<200, 200–349, and ≥350 cells/mL) CD4+ cell count and determined the proportion of subjects who attained CD4+ counts 2 years after HAART of <350, 350–699, and ≥700 cells per microliter (Fig. 2D). Within each category of subjects classified by their nadir CD4+ T-cell count, the proportion of subjects on HAART who reconstituted to CD4+ T-cell counts of ≥700 cells per microliter increased in a step-wise manner with increasing baseline CD4+ T-cell count. We tested this statistically by using a combination of the Pearson χ2 test and the χ2 test for linear trend and then estimated the proportion of the total Pearson χ2 that was attributable to a linear association between the categories of baseline CD4+ T-cell count and the mean phase II CD4+ T-cell count (Fig. 2E). We observed that across the categories of nadir CD4+ T-cell count, 50%–74% of the total association was attributable to a clear linear trend between the categories of baseline CD4+ T-cell count and the mean phase II CD4+ T-cell count. The results shown in Figure 2D and 2E together strongly indicated that the association of baseline CD4+ T-cell count and the mean phase II CD4+ T-cell count was largely independent of the nadir CD4+ T-cell count.
Joint Influence of Baseline and Nadir CD4+ T Cell Counts on CD4 Recovery
To investigate further the joint relationship between baseline and nadir CD4+ T-cell counts with the mean phase II CD4+ T-cell counts, we computed the CD4+ T-cell count trajectories 6 years before and after HAART initiation for each of the group of subjects categorized according to their baseline and nadir CD4+ cell count (Fig. 2F). The highest mean phase II CD4+ T-cell counts were found among 3 categories of subjects: those with baseline CD4 counts of ≥700 and nadir CD4 counts of ≥200 cells per microliter (Fig. 2F, groups 8 and 9) and those with baseline CD4 counts of 350–700 cells per microliter and nadirs of ≥350 cells per microliter (Fig. 2E, group 6). To determine whether the actual gain in CD4+ T-cell counts (difference between mean phase II and nadir CD4+ T-cell counts) differed by baseline and nadir CD4 counts, we used quantile regression. In multivariate analysis, we observed that the baseline CD4+ T-cell count had a significantly positive impact on the gain (coefficient 0.18, 95% CI: 0.10 to 0.26, P, 0.001), whereas the nadir CD4+ T-cell count had a significantly negative impact (coefficient 20.29, 95% CI: 20.40 to 20.18, P < 0.001) on the number of cells gained. These results corroborate those shown in Figure 2F such that for a given nadir CD4 count, a higher baseline CD4+ T-cell count was associated with a larger gain in CD4+ T cells. On the other hand, for a given baseline count, a lower nadir was associated with a larger gain after HAART. The conjoint effects on the predicted number of cells gained are depicted in Figure 3A which shows that a combination of high baseline CD4+ T-cell count and a low nadir CD4+ T-cell count is most likely to be benefited by HAART in terms of the number of cells gained.
FIGURE 3.
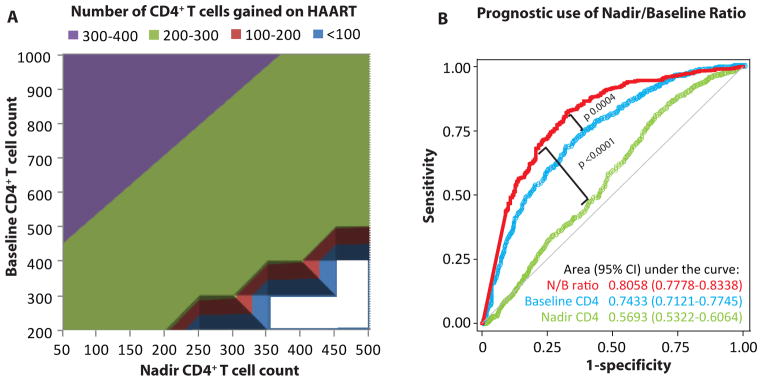
Combined influence of the baseline and nadir CD4+ T-cell counts on immunological reconstitution during HAART. A, Predicted number of CD4+ T cells gained during HAART based on the baseline and nadir CD4+ T-cell counts. The number of cells gained is the difference between the nadir CD4+ T-cell count and the mean phase II CD4+ T-cell count. All cell counts are expressed as cells per microliter. The results are from multivariate quantile regression models. Each model is adjusted for the same covariates as those in Figure 2B and for seroconversion window. Baseline and nadir CD4+ T-cell counts were used as continuous variables. Blank areas indicate theoretically nonexistent combinations. As can be seen from the purple colored triangular area, highest number of cells are gained when a high baseline CD4+ T-cell count is combined with a low nadir CD4+ T-cell count. B, Prognostic use of the nadir/baseline ratio. The plot shows the receiever-operating characteristic curves for the prediction of achievement of the baseline CD4+ T-cell counts during phase II based on the ratio of nadir and baseline CD4+ T-cell counts (red curve). Comparative ROC curves for baseline CD4+ T-cell count (blue curve) and nadir CD4+ T-cell count (green curve) for the same outcome are also shown. Gray diagonal line indicates the line of no prognostic use. N/B ratio, nadir/baseline CD4+ T-cell count ratio.
Nadir/Baseline CD4+ T-Cell Count Ratio Predicts CD4 Recovery From HAART
Last, to translate these findings into clinically relevant information, we first addressed the following question: Can a composite measure based on the baseline and nadir CD4+ T-cell counts be used to predict the likelihood of immune reconstitution? To answer this question, we generated the ratio of nadir to baseline CD4+ T-cell counts (nadir/baseline ratio) and used the dichotomous outcome of achievement of the baseline CD4+ T-cell count in mean phase II as a measure of adequate CD4 recovery. Using a ROC curve, we observed (Fig. 3B) that the nadir/baseline ratio had a prognostic accuracy of 81% as indicated by the area under the ROC curve. Compared with the predictive accuracy of either baseline CD4+ T-cell count (P = 0.0004) or nadir CD4+ T-cell count (P < 0.0001), the nadir/baseline ratio provided a significantly higher prognostic information. The optimum prognostically useful cut-off for this ratio was 0.6, equivalent to a CD4 decline of 40% from baseline. A ratio larger than this cut-off had prognostic sensitivity of 82.8%, specificity of 66.9%, and accuracy of 77.4%. The likelihood of successful reconstitution (that is achievement of baseline CD4+ T-cell count values during phase II) was 0.83 in subjects with nadir/baseline ratio of ≥0.6 and 0.34 in subjects with a ratio <0.6.
We next assessed the extent to which interindividual variability in immune reconstitution was explained by the nadir/baseline ratio. For these analyses, we considered three outcomes that can conceptually reflect adequate immune reconstitution: achievement of the baseline CD4+ T-cell count during phase II, mean phase II CD4+ T-cell count ≥500 cells per microliter, and a gain of at least 200 CD4+ T cells per microliter during HAART. In the study subjects, 716 (66.0%), 699 (64.4%), and 690 (63.6%) subjects achieved these 3 outcomes, respectively. Using logistic regression analyses, we observed that the nadir/baseline ratio explained 22.2% variability in the outcome of return to baseline CD4+ T-cell count, 3.2% variability in the outcome of mean phase II CD4+ T-cell count ≥500 cells per microliter, and 0.1% variability in the outcome of a gain of at least 200 CD4+ T cells per microliter during HAART. Interestingly, baseline CD4+ T-cell count and nadir CD4+ T-cell count, when considered individually, explained only 14.3% and 0.7% variability in the outcome of return to baseline CD4+ T-cell count suggesting that the nadir/baseline ratio may be tapping synergistic information content of these 2 parameters—a finding that corroborates the ROC curves shown in Figure 3B.
DISCUSSION
There are 2 major findings of our analyses. First, the baseline CD4+ T-cell count observed during the early stages of HIV infection is a strong predictor of the CD4+ T-cell count attained after HAART, independent of the nadir CD4+ T-cell count and other explanatory covariates that have previously been ascribed to underlie interindividual differences in immunological reconstitution after HAART.1,18–29,35–39 Prior studies have evaluated the impact of CD4 and VL just before initiation of HAART on immune recovery (eg, nadir CD4, pre- HAART VL). However, the impact of proximal parameters such as the degree of initial CD4 depletion during acute HIV infection (especially involving key CD4+ T-cell subsets in lymph nodes and the gut) or the pre-infection CD4 count, as reflected by the baseline CD4, on distal events during HIV disease such as extent and capacity of CD4 reconstitution are lacking. Our observation may have implications for clinical practice because it indicates that among patients with low baseline CD4 postseroconversion, the attainment of predetermined levels of CD4+ T-cell counts such as 500 cells per microliter may be difficult. That is, there might be a maximum ceiling dictated partly by the baseline CD4 which may limit the CD4+ T-cell gains during HAART. Although existence of such a ceiling for an individual patient may be difficult to determine in clinical practice, our results indicate that it may be clinically useful to consider the baseline CD4+ T-cell count as an approximate guideline for targeting the post-HAART recovery. Conversely, patients who presented with high baseline CD4+ T-cell counts may have had high pre-infection CD4 counts and/or a more modest extent of CD4 + T-cell depletion during acute HIV infection indicating a greater immunologic reserve capacity (eg, preservation of naive and central memory CD4 cells) or other associated immunologic advantages during HIV infection allowing for greater CD4+ T-cell recovery after HAART.40–44 However, it is possible that the baseline CD4+ T-cell count may not fully reflect the pre-infection count. Nevertheless, the fact that seroconversion window did not significantly influence our results points toward the clinical utility of this observation. Our findings indicate that the baseline CD4+ T-cell counts measured as close to serconversion as clinically feasible are an important independent indicator of immune recovery potential.
Second, during suppressive HAART, the average cell gain was highly associated with both the nadir and baseline CD4 counts independently. Specifically for a given nadir CD4 count, an individual with a high baseline CD4 would have a greater CD4 cell gain than an individual with a lower baseline CD4. Similarly for a given baseline CD4 count, an individual with a lower nadir CD4 would have a greater gain than an individual with a higher nadir. These novel results suggest that in the presence of HAART, the immune system seeks to attain the previous equilibrium dictated by the earliest CD4+ T-cell count soon after infection.
Our study implies 2 potential considerations for clinical practice. First, we developed a novel marker, the nadir/baseline ratio as one with high degree of association with future course of immune reconstitution after HAART. This finding further implies that (A) it may be useful to have a knowledge of baseline CD4+ T-cell count as close to seroconversion as feasible; and (B) if the CD4+ T-cell count falls below 60% of this value, the situation is less likely to yield to a robust immune reconstitution even if VL suppression is achieved. However, additional clinical studies are needed to directly address this hypothesis. Nevertheless, this finding is in line with the view that early HIV diagnosis and HAART-initiation can be beneficial.45 Second, our study implies that knowledge of the baseline CD4+ T-cell count may provide a clinician with a realistic therapeutic goal for CD4 recovery after HAART.
The strength of our study is that our cohort allowed us to index per subject extensive longitudinal CD4+ T-cell count data from the proximal stages of HIV infection, through the period of CD4 depletion (pre-HAART nadir CD4) and CD4 during HAART. However, there are limitations to this study. First, in the present analyses, we did not describe the particular treatment regimens24 or level of adherence because the vast majority of participants were able to achieve and maintain virologic suppression within the first year of therapy and maintain suppression thereafter independent of regimen used. Additionally, rates of adherence were high overall in this cohort.31 Second, although study participants were part of a well-characterized cohort of HIV-infected individuals who received comparable health care, we cannot exclude the possibility of an indication bias with respect to HAART initiation such that subjects with more advanced disease could have been more likely to have received therapy. Not withstanding this potential limitation, the relationship between the CD4+ T-cell counts assessed during the proximal (baseline), intermediate (nadir), and distal (during HAART) phases of HIV disease course can only be evaluated within the context of an observational study and not a clinical trial which typically lack information on baseline CD4 counts and are for a short duration after HAART initiation. Third, the results of this study may not be readily generalizable to clinical practice because our selection protocol included subjects who achieved VL suppression and did not develop AIDS after HAART initiation. Therefore, our study sample was more likely representative of a population that would have favorable post- HAART CD4 response.
In summary, by capitalizing on extensive longitudinal CD4+ T-cell counts early after seroconversion and corroborating the 3-phased measurements of these counts, we found that the baseline CD4+ T-cell count strongly predicted the CD4+ T-cell count recovery beyond the pre-HAART nadir CD4+ T-cell count. Our findings are novel and previously unrecognized due to the fact that most clinical studies do not have access to early postinfection CD4+ T-cell counts.
Acknowledgments
Support for this work (IDCRP-000-03) was provided by the Infectious Disease Clinical Research Program (IDCRP), a Department of Defense program executed through the Uniformed Services University of the Health Sciences. This project has been funded in whole, or in part, with federal funds from the National Institute of Allergy and Infectious Diseases, National Institutes of Health (NIH), under Inter-Agency Agreement Y1-AI-5072. This work was also supported by the Veterans Administration Center on AIDS and HIV infection of the South Texas Veterans Health Care System, and a MERIT (R37046326) award from the NIH to S.K.A. S.K.A. is also supported by a VA MERIT award and is a recipient of the Elizabeth Glaser Scientist Award, the Burroughs Wellcome Clinical Scientist Award in Translational Research, and the Doris Duke Distinguished Clinical Scientist Award. The content of this publication is the sole responsibility of the authors and does not necessarily reflect the views or policies of the NIH or the Department of Health and Human Services, the Department of Defense or the Departments of the Army, Navy or Air Force. Mention of trade names, commercial products, or organizations does not imply endorsement by the US Government.
The authors would like to thank our participants for their enormous contributions over the years and the IDCRP HIV Working Group.
Footnotes
The authors have no conflicts of interest to disclose.
References
- 1.Tan R, Westfall AO, Willig JH, et al. Clinical outcome of HIV-infected antiretroviral-naive patients with discordant immunologic and virologic responses to highly active antiretroviral therapy. J Acquir Immune Defic Syndr. 2008;47:553–558. doi: 10.1097/QAI.0b013e31816856c5. [DOI] [PubMed] [Google Scholar]
- 2.Grabar S, Le Moing V, Goujard C, et al. Clinical outcome of patients with HIV-1 infection according to immunologic and virologic response after 6 months of highly active antiretroviral therapy. Ann Intern Med. 2000;133:401–410. doi: 10.7326/0003-4819-133-6-200009190-00007. [DOI] [PubMed] [Google Scholar]
- 3.van Griensven J, Zachariah R, Rasschaert F, et al. Discordant immunologic and virologic responses to antiretroviral therapy and associated mortality in a large treatment program in Rwanda. J Acquir Immune Defic Syndr. 2009;50:556–558. doi: 10.1097/QAI.0b013e31819b15f3. [DOI] [PubMed] [Google Scholar]
- 4.Moore DM, Hogg RS, Chan K, et al. Disease progression in patients with virological suppression in response to HAART is associated with the degree of immunological response. AIDS. 2006;20:371–377. doi: 10.1097/01.aids.0000196180.11293.9a. [DOI] [PubMed] [Google Scholar]
- 5.Valdez H, Connick E, Smith KY, et al. Limited immune restoration after 3 years’ suppression of HIV-1 replication in patients with moderately advanced disease. AIDS. 2002;16:1859–1866. doi: 10.1097/00002030-200209270-00002. [DOI] [PubMed] [Google Scholar]
- 6.Moore DM, Hogg RS, Yip B, et al. Discordant immunologic and virologic responses to highly active antiretroviral therapy are associated with increased mortality and poor adherence to therapy. J Acquir Immune Defic Syndr. 2005;40:288–293. doi: 10.1097/01.qai.0000182847.38098.d1. [DOI] [PubMed] [Google Scholar]
- 7.El-Sadr WM, Lundgren JD, Neaton JD, et al. CD4+ count-guided interruption of antiretroviral treatment. N Engl J Med. 2006;355:2283–2296. doi: 10.1056/NEJMoa062360. [DOI] [PubMed] [Google Scholar]
- 8.Achhra AC, Amin J, Law MG, et al. Immunodeficiency and the risk of serious clinical endpoints in a well studied cohort of treated HIV-infected patients. AIDS. 2010;24:1877–1886. doi: 10.1097/QAD.0b013e32833b1b26. [DOI] [PMC free article] [PubMed] [Google Scholar]
- 9.Ruiz L, Paredes R, Gomez G, et al. Antiretroviral therapy interruption guided by CD4 cell counts and plasma HIV-1 RNA levels in chronically HIV-1-infected patients. AIDS. 2007;21:169–178. doi: 10.1097/QAD.0b013e328011033a. [DOI] [PubMed] [Google Scholar]
- 10.Mussini C, Bedini A, Borghi V, et al. CD4 cell-monitored treatment interruption in patients with a CD4 cell count > 500 × 106 cells/l. AIDS. 2005;19:287–294. [PubMed] [Google Scholar]
- 11.Miller V, Mocroft A, Reiss P, et al. Relations among CD4 lymphocyte count nadir, antiretroviral therapy, and HIV-1 disease progression: results from the EuroSIDA study. Ann Intern Med. 1999;130:570–577. doi: 10.7326/0003-4819-130-7-199904060-00005. [DOI] [PubMed] [Google Scholar]
- 12.Sterling TR, Chaisson RE, Moore RD. HIV-1 RNA, CD4 T-lymphocytes, and clinical response to highly active antiretroviral therapy. AIDS. 2001;15:2251–2257. doi: 10.1097/00002030-200111230-00006. [DOI] [PubMed] [Google Scholar]
- 13.Egger M, May M, Chene G, et al. Prognosis of HIV-1-infected patients starting highly active antiretroviral therapy: a collaborative analysis of prospective studies. Lancet. 2002;360:119–129. doi: 10.1016/s0140-6736(02)09411-4. [DOI] [PubMed] [Google Scholar]
- 14.Anastos K, Barron Y, Miotti P, et al. Risk of progression to AIDS and death in women infected with HIV-1 initiating highly active antiretroviral treatment at different stages of disease. Arch Intern Med. 2002;162:1973–1980. doi: 10.1001/archinte.162.17.1973. [DOI] [PubMed] [Google Scholar]
- 15.Kaplan JE, Hanson DL, Cohn DL, et al. When to begin highly active antiretroviral therapy? Evidence supporting initiation of therapy at CD4+ lymphocyte counts <350 cells/microL. Clin Infect Dis. 2003;37:951–958. doi: 10.1086/377606. [DOI] [PubMed] [Google Scholar]
- 16.Tarwater PM, Gallant JE, Mellors JW, et al. Prognostic value of plasma HIV RNA among highly active antiretroviral therapy users. AIDS. 2004;18:2419–2423. [PubMed] [Google Scholar]
- 17.Kitahata MM, Gange SJ, Abraham AG, et al. Effect of early versus deferred antiretroviral therapy for HIV on survival. N Engl J Med. 2009;360:1815–1826. doi: 10.1056/NEJMoa0807252. [DOI] [PMC free article] [PubMed] [Google Scholar]
- 18.Grabar S, Pradier C, Le Corfec E, et al. Factors associated with clinical and virological failure in patients receiving a triple therapy including a protease inhibitor. AIDS. 2000;14:141–149. doi: 10.1097/00002030-200001280-00009. [DOI] [PubMed] [Google Scholar]
- 19.Kaufmann GR, Bloch M, Zaunders JJ, et al. Long-term immunological response in HIV-1-infected subjects receiving potent antiretroviral therapy. AIDS. 2000;14:959–969. doi: 10.1097/00002030-200005260-00007. [DOI] [PubMed] [Google Scholar]
- 20.Florence E, Lundgren J, Dreezen C, et al. Factors associated with a reduced CD4 lymphocyte count response to HAART despite full viral suppression in the EuroSIDA study. HIV Med. 2003;4:255–262. doi: 10.1046/j.1468-1293.2003.00156.x. [DOI] [PubMed] [Google Scholar]
- 21.Hunt PW, Deeks SG, Rodriguez B, et al. Continued CD4 cell count increases in HIV-infected adults experiencing 4 years of viral suppression on antiretroviral therapy. AIDS. 2003;17:1907–1915. doi: 10.1097/00002030-200309050-00009. [DOI] [PubMed] [Google Scholar]
- 22.Robbins GK, Spritzler JG, Chan ES, et al. Incomplete reconstitution of T cell subsets on combination antiretroviral therapy in the AIDS Clinical Trials Group protocol 384. Clin Infect Dis. 2009;48:350–361. doi: 10.1086/595888. [DOI] [PMC free article] [PubMed] [Google Scholar]
- 23.Kaufmann GR, Bloch M, Finlayson R, et al. The extent of HIV-1-related immunodeficiency and age predict the long-term CD4 T lymphocyte response to potent antiretroviral therapy. Aids. 2002;16:359–367. doi: 10.1097/00002030-200202150-00007. [DOI] [PubMed] [Google Scholar]
- 24.Kaufmann GR, Furrer H, Ledergerber B, et al. Characteristics, determinants, and clinical relevance of CD4 T cell recovery to <500 cells/microL in HIV type 1-infected individuals receiving potent antiretroviral therapy. Clin Infect Dis. 2005;41:361–372. doi: 10.1086/431484. [DOI] [PubMed] [Google Scholar]
- 25.Moore RD, Keruly JC. CD4+ cell count 6 years after commencement of highly active antiretroviral therapy in persons with sustained virologic suppression. Clin Infect Dis. 2007;44:441–446. doi: 10.1086/510746. [DOI] [PubMed] [Google Scholar]
- 26.Wu H, Connick E, Kuritzkes DR, et al. Multiple CD4+ cell kinetic patterns and their relationships with baseline factors and virological responses in HIV type 1 patients receiving highly active antiretroviral therapy. AIDS Res Hum Retroviruses. 2001;17:1231–1240. doi: 10.1089/088922201750461285. [DOI] [PubMed] [Google Scholar]
- 27.Viard JP, Mocroft A, Chiesi A, et al. Influence of age on CD4 cell recovery in human immunodeficiency virus-infected patients receiving highly active antiretroviral therapy: evidence from the EuroSIDA study. J Infect Dis. 2001;183:1290–1294. doi: 10.1086/319678. [DOI] [PubMed] [Google Scholar]
- 28.Lederman MM, McKinnis R, Kelleher D, et al. Cellular restoration in HIV infected persons treated with abacavir and a protease inhibitor: age inversely predicts naive CD4 cell count increase. AIDS. 2000;14:2635–2642. doi: 10.1097/00002030-200012010-00002. [DOI] [PubMed] [Google Scholar]
- 29.Ferraris L, Bellistri GM, Pegorer V, et al. Untangling the immunological implications of nadir on CD4+ cell recovery during suppressive highly active antiretroviral therapy. Clin Infect Dis. 2008;46:149–150. doi: 10.1086/524087. [DOI] [PubMed] [Google Scholar]
- 30.Weintrob AC, Grandits GA, Agan BK, et al. Virologic response differences between African Americans and European Americans initiating highly active antiretroviral therapy with equal access to care. J Acquir Immune Defic Syndr. 2009;52:574–580. doi: 10.1097/QAI.0b013e3181b98537. [DOI] [PubMed] [Google Scholar]
- 31.Marconi VC, Grandits GA, Weintrob AC, et al. Outcomes of highly active antiretroviral therapy in the context of universal access to healthcare: the U.S. Military HIV Natural History Study. AIDS Res Ther. 2010;7:14. doi: 10.1186/1742-6405-7-14. [DOI] [PMC free article] [PubMed] [Google Scholar]
- 32.Marconi VC, Grandits G, Okulicz JF, et al. 2011 Cumulative Viral Load and Virologic Decay Patterns after Antiretroviral Therapy in HIV-Infected Subjects Influence CD4 Recovery and AIDS. PLoS ONE. 2011;6:17956. doi: 10.1371/journal.pone.0017956. [DOI] [PMC free article] [PubMed] [Google Scholar]
- 33.Ahuja SK, Kulkarni H, Catano G, et al. CCL3L1-CCR5 genotype influences durability of immune recovery during antiretroviral therapy of HIV-1-infected individuals. Nat Med. 2008;14:413–420. doi: 10.1038/nm1741. [DOI] [PMC free article] [PubMed] [Google Scholar]
- 34.From the Centers for Disease Control and Prevention. 1993 revised classification system for HIV infection and expanded surveillance case definition for AIDS among adolescents and adults. JAMA. 1993;269:729–730. [PubMed] [Google Scholar]
- 35.Gazzola L, Tincati C, Bellistri GM, et al. The absence of CD4+ T cell count recovery despite receipt of virologically suppressive highly active antiretroviral therapy: clinical risk, immunological gaps, and therapeutic options. Clin Infect Dis. 2009;48:328–337. doi: 10.1086/595851. [DOI] [PubMed] [Google Scholar]
- 36.Torti C, Cologni G, Uccelli MC, et al. Immune correlates of virological response in HIV-positive patients after highly active antiretroviral therapy (HAART) Viral Immunol. 2004;17:279–286. doi: 10.1089/0882824041310630. [DOI] [PubMed] [Google Scholar]
- 37.Mellors JW, Munoz A, Giorgi JV, et al. Plasma viral load and CD4+ lymphocytes as prognostic markers of HIV-1 infection. Ann Intern Med. 1997;126:946–954. doi: 10.7326/0003-4819-126-12-199706150-00003. [DOI] [PubMed] [Google Scholar]
- 38.Rodriguez B, Sethi AK, Cheruvu VK, et al. Predictive value of plasma HIV RNA level on rate of CD4 T-cell decline in untreated HIV infection. JAMA. 2006;296:1498–1506. doi: 10.1001/jama.296.12.1498. [DOI] [PubMed] [Google Scholar]
- 39.Battegay M, Nuesch R, Hirschel B, et al. Immunological recovery and antiretroviral therapy in HIV-1 infection. Lancet Infect Dis. 2006;6:280–287. doi: 10.1016/S1473-3099(06)70463-7. [DOI] [PubMed] [Google Scholar]
- 40.Schacker TW, Bosch RJ, Bennett K, et al. Measurement of naive CD4 cells reliably predicts potential for immune reconstitution in HIV. J Acquir Immune Defic Syndr. 2010;54:59–62. doi: 10.1097/QAI.0b013e3181c96520. [DOI] [PMC free article] [PubMed] [Google Scholar]
- 41.Brenchley JM, Silvestri G, Douek DC. Nonprogressive and progressive primate immunodeficiency lentivirus infections. Immunity. 2010;32:737–742. doi: 10.1016/j.immuni.2010.06.004. [DOI] [PMC free article] [PubMed] [Google Scholar]
- 42.Margolick JB, Gange SJ, Detels R, et al. Impact of inversion of the CD4/CD8 ratio on the natural history of HIV-1 infection. J Acquir Immune Defic Syndr. 2006;42:620–626. doi: 10.1097/01.qai.0000223028.55080.9d. [DOI] [PubMed] [Google Scholar]
- 43.Caruso A, Licenziati S, Canaris AD, et al. Contribution of CD4+, CD8+CD28+, and CD8+CD28− T cells to CD3+ lymphocyte homeostasis during the natural course of HIV-1 infection. J Clin Invest. 1998;101:137–144. doi: 10.1172/JCI195. [DOI] [PMC free article] [PubMed] [Google Scholar]
- 44.Amadori A, Zamarchi R, Chieco-Bianchi L. CD4: CD8 ratio and HIV infection: the “tap-and-drain” hypothesis. Immunol Today. 1996;17:414–417. doi: 10.1016/0167-5699(96)10049-9. [DOI] [PubMed] [Google Scholar]
- 45.Lifson AR, Krantz EM, Eberly LE, et al. Long-term CD4+ lymphocyte response following HAART initiation in a U.S. Military prospective cohort. AIDS Res Ther. 2011;8:2. doi: 10.1186/1742-6405-8-2. [DOI] [PMC free article] [PubMed] [Google Scholar]