

Abstract
Objective
Using data from the Alzheimer’s Disease Neuroimaging Initiative (ADNI) population, we examined (1) cross-sectional relationships between amyloid deposition, hypometabolism, and cognition, and (2) associations between amyloid and hypometabolism measurements and longitudinal cognitive measurements.
Methods
We examined associations between mean cortical florbetapir uptake, mean 18F-fluorodeoxyglucose–positron emission tomography (FDG-PET) within a set of predefined regions, and Alzhiemer’s Disease Assessment Scale (ADAS-cog) performance in 426 ADNI participants (126 normal, 162 early mild cognitive impairment [EMCI], 85 late MCI [LMCI], 53 Alzheimer disease [AD] patients). For a subset of these (76 normal, 81 LMCI) we determined whether florbetapir and FDG-PET were associated with retrospective decline in longitudinal ADAS-cog measurements.
Results
Twenty-nine percent of normal subjects, 43% of EMCI patients, 62% of LMCI patients, and 77% of AD patients were categorized as florbetapir positive. Florbetapir was negatively associated with concurrent FDG and ADAS-cog in both MCI groups. In longitudinal analyses, florbetapir-positive subjects in both normal and LMCI groups had greater ongoing ADAS-cog decline than those who were florbetapir negative. However, in normal subjects, florbetapir positivity was associated with greater ADAS-cog decline than FDG, whereas in LMCI, FDG positivity was associated with greater decline than florbetapir.
Interpretation
Although both hypometabolism and β-amyloid (Aβ) deposition are detectable in normal subjects and all diagnostic groups, Aβ showed greater associations with cognitive decline in normal participants. In view of the minimal cognitive deterioration overall in this group, this suggests that amyloid deposition has an early and subclinical impact on cognition that precedes metabolic changes. At moderate and later stages of disease (LMCI/AD), hypometabolism becomes more pronounced and more closely linked to ongoing cognitive decline.
The emergence of positron emission tomography (PET) for imaging fibrillar β-amyloid (Aβ) in vivo is a critical development in the study of Alzheimer disease (AD). Recent amyloid PET studies have raised important questions about how amyloid deposition influences cognitive trajectories, particularly early in the course of disease. Determining the consequences of Aβ at different phases of disease and the relationship between Aβ and other well-known biomarkers of AD such as 18F-fluorodeoxyglucose (FDG) remain important questions that will contribute to our understanding of the clinical relevance of amyloid PET imaging and the development of effective therapies for AD.
Hypometabolism, measured with FDG-PET, is associated with cognitive decline1 and conversion from mild cognitive impairment (MCI) to AD.2,3 Recent work has demonstrated that the presence of amyloid is also associated with decline4,5 and conversion.6,7 Integrating data from a variety of sources, researchers have proposed that the time course of Aβ deposition and hypometabolism depends on disease stage,8–10 such that amyloid deposition precedes synaptic and neuronal dysfunction, which is in turn followed by cognitive decline. This model has been supported by several studies comparing the 2 PET measurements with respect to longitudinal decline,11,12 but this work has been limited by small sample sizes and access to patients at different phases of disease.
In this study, FDG-PET and amyloid PET data acquired through the Alzheimer’s Disease Neuroimaging Initiative (ADNI) made it possible to compare these measurements in a large sample at different levels of disease severity. [18F]Florbetapir is a PET ligand that has been recently added to the ADNI imaging protocol, and has been validated in a study demonstrating close correspondence between cortical amyloid deposition measured with florbetapir in end-of-life patients and immunohistochemistry measurements of fibrillar Aβ at autopsy.13
We examined cross-sectional relationships between Aβ (measured with florbetapir), hypometabolism (measured with FDG-PET), and cognitive performance (measured with the cognitive subscale of the Alzheimer’s Disease Assessment Scale [ADAS-cog]) in the ADNI population. A subset of the normal and MCI participants had retrospective longitudinal cognitive performance data available. Examining PET measurements (florbetapir, FDG) and cognitive change over time in these 2 diagnostic groups (normal, MCI) allowed us to test the hypothesis that amyloid deposition precedes hypometabolism and both are linked to longitudinal decline.
Subjects and Methods
Study Design
ADNI is a longitudinal multisite study supported by the NIH, private pharmaceutical companies, and nonprofit organizations with approximately 50 medical center and university sites across the United States and Canada (www.loni.ucla.edu/ADNI). ADNI 1 enrolled approximately 800 participants (normal, a group initially recruited as MCI and now termed late MCI [LMCI], and AD) with multiple longitudinal biomarker and cognitive measurements at 6 to 12-month intervals for 2 to 3 years. This initial study was followed by ADNI GO, which enrolled 200 subjects in a new diagnostic group called early MCI (EMCI), characterized as subtle memory impairment that is intermediate between normal subjects and LMCI; and ADNI 2, which enrolled approximately 550 additional normal, EMCI, LMCI, and AD participants. Approximately ⅔ of subjects enrolled during ADNI 1 are still being followed longitudinally. Longitudinal florbetapir, FDG, magnetic resonance imaging (MRI), cerebrospinal fluid, and cognitive measurements are obtained for all newly enrolled and continuing participants.
Participants
Our study population was 426 ADNI participants with an available florbetapir and MRI scan as of November 2011 (126 normal, 162 early MCI, 85 LMCI, 53 AD); 417 of these participants also had an FDG-PET scan acquired approximately concurrently with the florbetapir scan (average time between FDG-PET and florbetapir, <1 week). Approximately ⅔ of the total sample were newly enrolled subjects who had no longitudinal follow-up, whereas approximately ⅓ were continuing normal (n = 76) and LMCI (n = 81) participants from ADNI 1 who were followed for an average of about 4 years prior to their florbetapir scans.
Full inclusion/exclusion criteria are described in detail at www.adni-info.org. Briefly, all subjects were between the ages of 55 and 90 years, had completed at least 6 years of education, were fluent in Spanish or English, and were free of any other significant neurologic diseases. LMCI participants had a subjective memory complaint, a Clinical Dementia Rating (CDR) of 0.5, and were classified as single- or multidomain amnestic.14 The EMCI group differed from LMCI only based on education-adjusted scores for the delayed paragraph recall subscore on the Wechsler Memory Scale–Revised Logical Memory II such that EMCI subjects were intermediate between normal subjects and LMCI. Normal subjects had CDR scores of 0, and patients with AD met standard diagnostic criteria.15
The ADAS-cog16 was used in our cross-sectional analyses and as the primary outcome variable in our longitudinal analyses; total score ranges from 0 to 70, with a higher score indicating poorer cognitive function. We also assessed changes in diagnostic status (eg, remaining LMCI or converting to AD), which was determined at individual testing sites.
Apolipoprotein E (APOE) genotypes were determined with blood samples for all except 2 EMCI subjects.
Florbetapir Image Acquisition and Analysis
ADNI PET image data were acquired as described online (adni.loni.ucla.edu/about-data-samples/image-data/), and processed by our laboratory as described online (adni.loni.ucla.edu/research/pet-post-processing/) and summarized briefly below.
Florbetapir image data were acquired 50 to 70 minutes postinjection, and images were averaged, spatially aligned, interpolated to a standard voxel size, and smoothed to a common resolution of 8mm full width at half maximum.
For quantification of florbetapir, we used 1 or, in most cases, 2 structural 1.5T or 3T MRI scans (magnetization-prepared rapid acquisition gradient echo [MPRAGE]) acquired concurrently with the florbetapir scan to define cortical regions of interest and the cerebellar reference region. MPRAGE scans within 1 year of the florbetapir scan were available for approximately 80% of subjects. For the remaining subjects, we used the MPRAGE that was closest in time to the florbetapir scan (average MRI–florbetapir interval = 1.9 ± 0.8 years). MPRAGE images were segmented and parcellated into individual cortical regions with Freesurfer version 4.5.0 (surfer.nmr.mgh.harvard.edu/), which was used to extract mean florbetapir uptake from gray matter within lateral and medial frontal, anterior, and posterior cingulate, lateral parietal, and lateral temporal regions relative to uptake in the whole cerebellum (white and gray matter). This summary measure was used as the florbetapir cortical mean for each subject.
FDG Image Acquisition and Analysis
FDG image data were acquired 30 to 60 minutes postinjection, and images were downloaded from the ADNI website after preprocessing (frames were averaged, spatially aligned, interpolated to a standard voxel size, and smoothed to a common resolution of 8mm full width at half maximum). We then spatially normalized each FDG image to the standard 15O-H2O PET template using SPM5.17
We determined mean FDG uptake for each subject within a set of predefined and previously validated3,18 regions of interest (metaROIs) based on a literature review as described elsewhere in detail.19 Each subject’s summary FDG index was the mean of the 5 metaROIs (right and left inferior temporal and lateral parietal regions, and a bilateral posterior cingulate cortex region) relative to the mean of a pons and cerebellar vermis reference region.
Cutoffs for Participant Classification
Categorization of subjects as abnormal (+) or normal (−) on florbetapir was derived from a recent study in which 1.10 was the upper limit of the 95% confidence interval for the distribution of florbetapir means of young healthy controls.20 (In a separate study, no individuals with a cortical florbetapir mean less than approximately 1.10 had intermediate to high likelihood of AD according to National Institute on Aging/Reagan Institute criteria based on neuropathology at autopsy.13) To account for image processing differences between those studies and the current study, a subset of ADNI florbetapir images (total = 324; normal = 93, EMCI = 128, LMCI = 62, AD = 41) were processed using both methods. We regressed cortical means from the current study (processed with Freesurfer) on cortical means from the processing method used in the Joshi et al20 and Clark et al13 studies and used the resulting regression line (y = 0.80x + 0.23) to convert the cutoff of 1.10 to a very similar threshold of 1.11 for Freesurfer-processed data (Supplementary Fig 2).
The FDG cutoff was derived in a previous study showing that a mean of 1.21 from the same predefined regions of interest was the threshold that best differentiated between ADNI AD patients and normal controls in a receiver operating characteristic analysis.3
Using the cutoff criteria described above, florbetapir and FDG status for each individual was determined as abnormal positive (+) or normal negative (−).
Statistical Analyses
We examined associations between concurrent florbetapir, FDG, and ADAS-cog measurements for the whole population and for each diagnostic group separately (normal, EMCI, LMCI, AD). Spearman rank correlation coefficients were used for continuous variables to account for the non-normally distributed nature of florbetapir and ADAS-cog, and chi-square tests were used for dichotomous variables.
For participants with longitudinal data, we examined associations between our independent variables of interest (florbetapir, FDG) and longitudinal ADAS-cog change using linear mixed effects models. For each diagnostic group (normal and LMCI), separate models were fit with each dichotomous independent variable of interest (florbetapir±, FDG±). The interaction between each independent variable and time (florbetapir × time, FDG × time) was the primary effect of interest in each model, because it represented the relationship between that variable and ADAS-cog change over time. This is distinct from the main effect of each variable, which represented the relationship between that variable and ADAS-cog measurements collapsed across all time points. Initial models also included terms to model interactions between the primary variables of interest (eg, florbetapir × FDG), but interactions that were not significant did not remain in the model. Age was centered at 75 years, education was centered at 16 years, and females were the reference group, so that resulting parameter estimates can be interpreted as representing an example 75-year-old female with 16 years of education. All models included age, sex, and education as covariates, as well as a random intercept to account for individual variability in initial ADAS-cog scores, and an autoregressive covariance structure to account for correlations between consecutive ADAS-cog scores over time.
All statistical tests were carried out at p < 0.05, 2-tailed.
Results
FDG and Florbetapir Status across All Diagnostic Groups
Table 1 shows the demographic information for all subjects, grouped based on diagnosis at the time of the florbetapir scan.
TABLE 1.
Demographic Information for All Participants at the Time of the Florbetapir Scan
| Characteristic | Normal | EMCI | LMCI | AD |
|---|---|---|---|---|
| No.a | 126 | 162 | 85 | 53 |
| Age, yr (SD) | 78.4 (5.8) | 71.2 (7.6) | 76.3 (8.8) | 76.0 (7.9) |
| Female, No. [%] | 62 [50] | 70 [43] | 31 [37] | 20 [39] |
| Education, yr (SD) | 16.4 (2.8) | 15.9 (2.6) | 15.9 (3.2) | 16.5 (2.8) |
| MMSE (SD) | 29.1 (1.3) | 28.3 (1.5) | 27.6 (1.9) | 21.4 (4.6) |
| ADAS-cog (SD) | 6.2 (3.5) | 8.0 (3.6) | 10.5 (5.3) | 21.8 (10.0) |
| APOE4 carriers, No. [%] | 30 [24] | 64 [40] | 39 [46] | 33 [62] |
| Florbetapir, cortical mean (SD) | 1.09 (0.18) | 1.16 (0.20) | 1.24 (0.24) | 1.33 (0.25) |
| Florbetapir+, No. [%] | 36 [29] | 70 [43] | 53 [62] | 41 [77] |
| FDG, meta-ROI mean (SD) | 1.29 (0.11) | 1.29 (0.12) | 1.23 (0.13) | 1.03 (0.16) |
| FDG+, No. [%] | 30 [25] | 43 [27] | 41 [49] | 47 [92] |
Missing data: ADAS-cog, 3 normal, 2 EMCI, 1 LMCI; FDG, 1 normal, 1 EMCI, 1 LMCI, 2 AD; MMSE, 1 normal, 2 LMCI; APOE, 2 EMCI.
AD = Alzheimer disease; ADAS-cog = cognitive subscale of the Alzheimer’s Disease Assessment Scale; EMCI = early mild cognitive impairment; FDG = 18F-fluorodeoxyglucose; LMCI = late mild cognitive impairment; MMSE = Mini-Mental State Examination; ROI = region of interest; SD = standard deviation.
The percentage of florbetapir+ subjects increased across groups as cognitive symptoms became more severe (29% normal, 43% EMCI, 62% LMCI, 77% AD; Fig 1A). Similarly, the percentage of FDG+ subjects also increased with cognitive symptoms (25% normal, 27% EMCI, 49% LMCI, 92% AD; see Fig 1B). As shown in Figure 1, the distributions of florbetapir and FDG for subjects who converted from LMCI to AD between enrollment and the time of their PET scans (recent ADs) were similar to subjects diagnosed with AD at enrollment.
FIGURE 1.

Frequency histograms show the distributions within each diagnostic group of (A) florbetapir cortical mean (relative to the cerebellum mean) with all subjects falling to the right of the cutoff line (1.11) categorized as florbetapir1 and (B) concurrent 18F-fluorodeoxyglucose (FDG) meta-regions of interest (ROIs), with all subjects falling to the left of the cutoff line (1.22) categorized as FDG1 (see text and Table 1 for 6 percentages). Subject diagnosis was determined based on the time of the florbetapir and FDG scans. For visual comparison, subjects who originally enrolled in the Alzheimer’s Disease Neuroimaging Initiative as late mild cognitive impairment (LMCI) but converted to Alzheimer disease (AD) by the end of follow-up are shown here as an AD (recently converted) group that is separate from the AD patients who were enrolled with an AD diagnosis. EMCI = early mild cognitive impairment.
Cross-Sectional Associations between Florbetapir, FDG, and Cognition
Age was positively associated with florbetapir in EMCI (Spearman rho = 0.26, p = 0.001), and marginally in AD (p = 0.06), but not in normal and LMCI subjects, or across the entire study population.
Across the study population, florbetapir was associated with ADAS-cog (p < 0.001) and florbetapir± status was associated with APOE4 carrier status (p < 0.001). Florbetapir was negatively associated with FDG (p < 0.001).
Relationships between variables were highly dependent on diagnostic group (Table 2, Fig 2), such that florbetapir and FDG were associated in the EMCI and LMCI groups but not normal subjects or AD patients. Florbetapir and ADAS-cog performance were negatively associated only in the EMCI and LMCI groups, with a trend for association in the normal subjects. Glucose metabolism was associated with ADAS-cog in all groups except for normal subjects.
TABLE 2.
Spearman rho Values and Corresponding p Values for Significant and Marginally Significant Cross-Sectional Associations Are Shown for Each Diagnostic Group
| Group | Florbetapir |
FDG |
||||||
|---|---|---|---|---|---|---|---|---|
| Normal | EMCI | LMCI | AD | Normal | EMCI | LMCI | AD | |
| Florbetapir, rho, p |
||||||||
|
| ||||||||
| FDG, rho, p |
ns | −0.19, 0.01 |
−0.40, <0.001 |
ns | ||||
|
| ||||||||
| ADAS-cog, rho, p |
0.17, 0.06 |
0.24, 0.002 |
0.29, 0.007 |
ns | ns | −0.25, 0.001 |
−0.32, 0.003 |
−0.48, 0.001 |
Florbetapir cortical means, FDG meta-regions of interest, and ADAS-cog scores are all continuous.
AD = Alzheimer disease; ADAS-cog = cognitive subscale of the Alzheimer’s Disease Assessment Scale; EMCI = early mild cognitive impairment; FDG = 8F-fluorodeoxyglucose; LMCI = late mild cognitive impairment; ns = nonsignificant.
FIGURE 2.
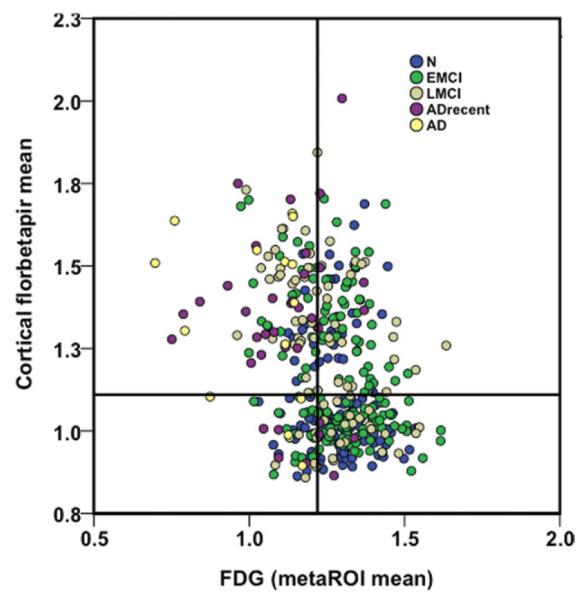
18F-Fluorodeoxyglucose (FDG) meta-region of interest (ROI) means are plotted against cortical florbetapir means for each diagnostic group. Cutoffs for each marker are described in Subjects and Methods and are labeled on the plot. The upper left and lower right quadrants represent areas of agreement between markers, whereas the upper right and lower left quadrants are areas of marker disagreement. AD = Alzheimer disease; ADrecent = Alzheimer disease recently converted; EMCI = early mild cognitive impairment; LMCI = late mild cognitive impairment; N = normal.
Florbetapir and FDG Associations with Retrospective Longitudinal Cognitive Decline
Of the 76 normal and 81 LMCI subjects with longitudinal data (for demographic information see Supplementary Table), 10 normal subjects converted to LMCI, 37 LMCI subjects converted to AD, and 3 LMCI subjects reverted to a normal diagnosis between their enrollment in ADNI and the time of their florbetapir scan.
In normal subjects (Fig 3A), mixed effects regression models revealed that florbetapir status was associated with ADAS-cog change such that florbetapir+ individuals had higher (worse) ADAS-cog scores across all time points (main effect; p = 0.03) and declined at a rate of 0.43 points/yr greater than florbetapir− individuals (interaction effect, p < 0.001). Furthermore, when the 10 subjects who converted from normal to LMCI during follow-up were removed from the analysis, this interaction was still significant (p = 0.005). FDG status, however, was not associated with ADAS-cog change.
FIGURE 3.

Plot of estimated cognitive subscale of the Alzheimer’s Disease Assessment Scale (ADAS-cog) scores (resulting from mixed effects model) relative to time in the subset of (A) normal subjects and (B) late mild cognitive impairment subjects with available follow-up data. Estimated ADAS-cog scores are plotted separately for 18F-fluorodeoxyglucose (FDG) and florbetapir+ and florbetapir− groups. Models included terms for age, sex, and education. Separate shades represent different participants. Time (x-axis) is in years, with zero representing the time of the florbetapir or FDG scan, and the ADAS-cog measurements occurring at approximately regular intervals prior to and concurrent with the scans.
In LMCI participants (see Fig 3B), florbetapir status was also associated with ADAS-cog such that florbetapir+ individuals had higher ADAS-cog scores overall (main effect, p = 0.004) and declined at a rate of 0.83 points/yr greater than florbetapir− individuals (interaction, p = 0.05). FDG+ participants had higher ADAS-cog scores overall (main effect, p < 0.001) and had a 1.48 points/yr greater decline than FDG− individuals (interaction, p < 0.001).
Addition of APOE4 carrier status (±) as a covariate in the mixed effects models did not change the pattern of results for either group.
Secondary mixed effects regression models using continuous (rather than dichotomous) forms of FDG and florbetapir resulted in generally consistent but smaller effects, indicating that incremental variability in these summary measures was not more useful than dichotomous measures in the context of associations with cognitive decline. Although collapsing the dynamic range of florbetapir and FDG values into 2 categories reduces variability in these measures, the use of cutoffs may facilitate the clinical utility and interpretability of our analyses.
Conversion
We examined conversion (normal to LMCI; LMCI to AD) as a secondary longitudinal outcome variable. Ten of 76 (13%) subjects diagnosed as normal at enrollment converted to LMCI during the follow-up period. Five of 10 (50%) the converters were FDG+, whereas 7 of 10 (70%) converters were florbetapir+. Thirty-seven of 81 (46%) subjects initially diagnosed as LMCI converted to AD during follow-up. Of the 3 LMCI subjects who reverted to a normal diagnosis, 3 of 3 were florbetapir−, whereas 2 of 3 were FDG−. Twenty-nine of 37 (78%) of the converters were florbetapir+, whereas 24 of 44 (54%) nonconverters were florbetapir+ (odds ratio, 3.0). Thirty-three of 37 converters (89%) were FDG+, whereas 19 of 44 (43%) nonconverters were FDG+ (odds ratio, 10.9).
Discussion
In this study, we examined associations of 2 PET markers (florbetapir and FDG) with concurrent cognitive function and retrospective cognitive decline. First, amyloid deposition, hypometabolism, and cognition were associated cross-sectionally in early and late MCI. In normal subjects, amyloid deposition was only marginally associated with cognition, whereas in AD (which included 27 of 53 patients who had recently converted from LMCI), FDG (but not amyloid) was related to cognition. In our longitudinal analysis, amyloid deposition (but not hypometabolism) was associated with ongoing cognitive decline in normal subjects, whereas in LMCI, both amyloid and hypometabolism were related to decline, but the association was stronger for hypometabolism. These findings suggest that in normal older individuals, amyloid is closely linked to the earliest indications of clinical decline. Once individuals have sufficient clinical dysfunction to be diagnosed with MCI, however, hypometabolism (which represents synaptic and neuronal dysfunction) and cognitive loss progress together. These data are consistent with a model in which amyloid deposition is associated with cognitive dysfunction in the early and middle stages of decline, but at moderate and later stages of disease (LMCI/AD), synaptic dysfunction becomes more pronounced and more closely linked to ongoing cognitive decline.8
Almost a third of cognitively normal individuals in this study were florbetapir+, a rate that is consistent with other reports of amyloid deposition in healthy older populations based on amyloid-PET imaging using Pittsburgh compound B (PiB),21–23 and rates of amyloid positivity increased with cognitive symptoms such that 43% of EMCI and 65% of LMCI participants were florbetapir+. Seventy-seven percent of AD patients were florbetapir+, which is similar to the percentages of AD amyloid positivity reported recently in different populations with florbetapir24 and PiB,25 although AD amyloid positivity around 90% or above has also been observed.22,26,27 This variability could be due to different sample sizes, application of diagnostic criteria, the sensitivity of the imaging technique, or incorrect clinical diagnoses, which are difficult to estimate due to low sample sizes in autopsy studies but range from about 10%28,29 to 23%.30,31
Although some studies have reported a correlation between age and amyloid deposition across diagnostic groups with florbetapir24 and with PiB in some diagnostic groups but not others,5,22 florbetapir uptake and age were related only in the EMCI group. However, the majority of individuals in the LMCI and normal groups were enrolled in ADNI >4 years prior to their florbetapir scans. The normal and LMCI subjects are therefore older and have a slightly reduced age range compared to the EMCI subjects, which may have biased associations between amyloid and age.
Evidence for cross-sectional associations between cognitive dysfunction and amyloid deposition is mixed and may depend on stage of disease,32 which is in agreement with our findings, because only the LMCI groups showed this relationship (the association in normal subjects was a nonsignificant trend). Some studies have reported significant cross-sectional associations,33,34 whereas others have reported no association22,23,35 between amyloid-PET measurements and cognitive function. Our findings are also consistent with recent longitudinal studies reporting that PiB+ normal subjects have greater retrospective,36 concurrent,4,10 and prospective5 cognitive decline than PiB− normal subjects. In addition, we previously observed similar low agreement between FDG and PiB measures in a subset of the same population,18 suggesting that there is only moderate shared variance between hypometabolism and amyloid measurements, particularly in the normal and AD groups.
An important limitation of this study is that the associations with longitudinal cognitive decline are retrospective rather than predictive, because the florbetapir and FDG measurements were collected at the end of the follow-up period. Amyloid deposition is likely to have fluctuated throughout the follow-up period, and change in amyloid deposition over time may differ between normal and LMCI subjects.5 Furthermore, there is evidence that metabolism changes over a longer time period than amyloid deposition does,9,11 both before and after the onset of cognitive symptoms. Hypometabolism has also been observed in young adult APOE4 carriers,37 several decades before the likely onset of amyloid deposition, suggesting that hypometabolism may reflect long-term patterns of brain and cognitive function that are independent of amyloid deposition. Prospective follow-up of these participants is ongoing and will be important for determining the predictive utility of PET imaging, particularly in the EMCI group, which may represent the earliest clinical stage of disease but did not have available longitudinal data at the time of this study. Repeated PET scans in this population will also be critical for determining the rate of amyloid and metabolic change (as well as measurement error) at different stages of disease. An additional limitation is that the distributions of FDG-PET and florbetapir differ. Florbetapir is more bimodal than FDG-PET, so the use of dichotomous predictor variables may more accurately reflect the underlying characteristics of the florbetapir distribution.
Our primary finding was that the relationship between amyloid deposition and cognitive decline differed between diagnostic groups. Positive amyloid status in both the normal and LMCI groups was associated with ongoing decline. However, in normal subjects, decline was more closely linked to amyloid status, whereas in LMCI, decline was more closely linked to hypometabolism. These data suggest that amyloid deposition precedes detectable metabolic dysfunction and that the consequences of high amyloid deposition can be observed at a stage prior to the onset of clinically recognized symptoms. After the onset of clinical symptoms, amyloid and cognitive dysfunction appear to become decoupled, so variability in cognitive decline is mediated by other factors such as synaptic dysfunction and atrophy, comorbidities, and factors related to cognitive reserve such as education or lifestyle.
Supplementary Material
Acknowledgment
Data collection and sharing for this project was funded by the Alzheimer’s Disease Neuroimaging Initiative (ADNI; National Institutes of Health Grant U01 AG024904). ADNI is funded by the National Institute on Aging and the National Institute of Biomedical Imaging and Bioengineering, and through generous contributions from the following: Abbott; Alzheimer’s Association; Alzheimer’s Drug Discovery Foundation; Amorfix Life Sciences Ltd.; AstraZeneca; Bayer HealthCare; BioClinica, Inc.; Biogen Idec Inc.; Bristol-Myers Squibb Company; Eisai Inc.; Elan Pharmaceuticals Inc.; Eli Lilly and Company; F. Hoffmann-La Roche Ltd. and its affiliated company Genentech, Inc.; GE Healthcare; Innogenetics, N.V.; Janssen Alzheimer Immunotherapy Research & Development, LLC.; Johnson & Johnson Pharmaceutical Research & Development LLC.; Medpace, Inc.; Merck & Co., Inc.; Meso Scale Diagnostics, LLC.; Novartis Pharmaceuticals Corporation; Pfizer Inc.; Servier; Synarc, Inc.; and Takeda Pharmaceutical Company. The Canadian Institutes of Health Research is providing funds to support ADNI clinical sites in Canada. Private sector contributions are facilitated by the Foundation for the National Institutes of Health (www.fnih.org). The grantee organization is the Northern California Institute for Research and Education, and the study is coordinated by the Alzheimer’s Disease Cooperative Study at the University of California, San Diego. ADNI data are disseminated by the Laboratory for Neuro Imaging at the University of California, Los Angeles. This research was also supported by NIH grants P30AG010129, K01 AG030514, U01 AG024904, and the Dana Foundation.
We thank D. Harvey for statistical assistance and C. Breault for assistance with data analysis.
Footnotes
Data used in the preparation of this article were obtained from the Alzheimer’s Disease Neuroimaging Initiative (ADNI) database (adni.loni.ucla.edu). As such, the investigators within the ADNI contributed to the design and implementation of ADNI and/or provided data but did not participate in the analysis or writing of this report. A complete listing of ADNI investigators can be found at: http://adni.loni.ucla.edu/wpcontent/uploads/how_to_apply/ADNI_Acknowledgement_List.pdf
Additional supporting information can be found in the online version of this article.
Potential Conflicts of Interest S.M.L.: consultancy, Avid Radiopharmaceuticals, Janssen AI. M.A.M.: employment, Avid Radiopharmaceuticals. R.A.K.: employment, University of Michigan. R.C.P.: board membership, Pfizer, Janssen Alzheimer Immunotherapy; consultancy, Elan Pharmaceuticals, GE Healthcare; speaking fees, Novartis Incorporated. P.S.A.: consultancy, Elan Corporation, Wyeth, Eisai, Bristol-Myers Squibb, Eli Lilly, NeuroPhage, Merck, Roche, Amgen, Abbott, Pfizer, Novartis, Bayer, Astellas, Dainippon, Biomarin, Solvay, Otsuka, Daiichi, AstraZeneca, Janssen, Medivation, Theravance, Cardeus, Anavex; grants/grants pending, Baxter, Pfizer, Lilly, NIH. M.W.W.: stock/stock options, Elan, Synarc. W.J.J.: consultancy, Genentech, GE Healthcare, Bayer Healthcare, Elan/Janssen Alzheimer Immunotherapy, Synarc, Tau Rx; grants/grants pending, NIH; royalties, Oxford University Press.
References
- 1.Mosconi L, Mistur R, Switalski R, et al. FDG-PET changes in brain glucose metabolism from normal cognition to pathologically verified Alzheimer’s disease. Eur J Nucl Med Mol Imaging. 2009;36:811–822. doi: 10.1007/s00259-008-1039-z. [DOI] [PMC free article] [PubMed] [Google Scholar]
- 2.Drzezga A, Lautenschlager N, Siebner H, et al. Cerebral metabolic changes accompanying conversion of mild cognitive impairment into Alzheimer’s disease: a PET follow-up study. Eur J Nucl Med Mol Imaging. 2003;30:1104–1113. doi: 10.1007/s00259-003-1194-1. [DOI] [PubMed] [Google Scholar]
- 3.Landau SM, Harvey D, Madison CM, et al. Comparing predictors of conversion and decline in mild cognitive impairment. Neurology. 2010;75:230–238. doi: 10.1212/WNL.0b013e3181e8e8b8. [DOI] [PMC free article] [PubMed] [Google Scholar]
- 4.Storandt M, Mintun MA, Head D, Morris JC. Cognitive decline and brain volume loss as signatures of cerebral amyloid-beta peptide deposition identified with Pittsburgh compound B: cognitive decline associated with Abeta deposition. Arch Neurol. 2009;66:1476–1481. doi: 10.1001/archneurol.2009.272. [DOI] [PMC free article] [PubMed] [Google Scholar]
- 5.Villemagne VL, Pike KE, Chetelat G, et al. Longitudinal assessment of Abeta and cognition in aging and Alzheimer disease. Ann Neurol. 2011;69:181–192. doi: 10.1002/ana.22248. [DOI] [PMC free article] [PubMed] [Google Scholar]
- 6.Jack CR, Jr, Wiste HJ, Vemuri P, et al. Brain beta-amyloid measures and magnetic resonance imaging atrophy both predict time-to-progression from mild cognitive impairment to Alzheimer’s disease. Brain. 2010;133:3336–3348. doi: 10.1093/brain/awq277. [DOI] [PMC free article] [PubMed] [Google Scholar]
- 7.Okello A, Koivunen J, Edison P, et al. Conversion of amyloid positive and negative MCI to AD over 3 years: an 11C-PIB PET study. Neurology. 2009;73:754–760. doi: 10.1212/WNL.0b013e3181b23564. [DOI] [PMC free article] [PubMed] [Google Scholar]
- 8.Jack CR, Jr, Knopman DS, Jagust WJ, et al. Hypothetical model of dynamic biomarkers of the Alzheimer’s pathological cascade. Lancet Neurol. 2010;9:119–128. doi: 10.1016/S1474-4422(09)70299-6. [DOI] [PMC free article] [PubMed] [Google Scholar]
- 9.Forster S, Grimmer T, Miederer I, et al. Regional expansion of hypometabolism in Alzheimer’s disease follows amyloid deposition with temporal delay. Biol Psychiatry. 2012;71:792–797. doi: 10.1016/j.biopsych.2011.04.023. [DOI] [PubMed] [Google Scholar]
- 10.Ewers M, Insel P, Jagust WJ, et al. CSF biomarker and PIB-PET-derived beta-amyloid signature predicts metabolic, gray matter, and cognitive changes in nondemented subjects. Cereb Cortex. doi: 10.1093/cercor/bhr271. first published online October 29, 2011 doi:10.1093/cercor/bhr271. [DOI] [PMC free article] [PubMed] [Google Scholar]
- 11.Kadir A, Almkvist O, Forsberg A, et al. Dynamic changes in PET amyloid and FDG imaging at different stages of Alzheimer’s disease. Neurobiol Aging. 2012;33:198.e1–198.e14. doi: 10.1016/j.neurobiolaging.2010.06.015. [DOI] [PubMed] [Google Scholar]
- 12.Ossenkoppele R, Tolboom N, Foster-Dingley JC, et al. Longitudinal imaging of Alzheimer pathology using [(11)C]PIB, [(18)F]FDDNP and [(18)F]FDG PET. Eur J Nucl Med Mol Imaging. 2012;39:990–1000. doi: 10.1007/s00259-012-2102-3. [DOI] [PubMed] [Google Scholar]
- 13.Clark CM, Schneider JA, Bedell BJ, et al. Use of florbetapir-PET for imaging beta-amyloid pathology. JAMA. 2011;305:275–283. doi: 10.1001/jama.2010.2008. [DOI] [PMC free article] [PubMed] [Google Scholar]
- 14.Petersen RC. Conceptual overview. In: Petersen RC, editor. Mild cognitive impairment: aging to alzheimer’s disease. Oxford University Press; New York, NY: 2003. pp. 1–14. [Google Scholar]
- 15.McKhann G, Drachman D, Folstein M, et al. Clinical diagnosis of Alzheimer’s disease: report of the NINCDS-ADRDA Work Group under the auspices of Department of Health and Human Services Task Force on Alzheimer’s Disease. Neurology. 1984;34:939–944. doi: 10.1212/wnl.34.7.939. [DOI] [PubMed] [Google Scholar]
- 16.Rosen WG, Mohs RC, Davis KL. A new rating scale for Alzheimer’s disease. Am J Psychiatry. 1984;141:1356–1364. doi: 10.1176/ajp.141.11.1356. [DOI] [PubMed] [Google Scholar]
- 17.Ashburner J, Friston KJ. Unified segmentation. Neuroimage. 2005;26:839–851. doi: 10.1016/j.neuroimage.2005.02.018. [DOI] [PubMed] [Google Scholar]
- 18.Jagust WJ, Landau SM, Shaw LM, et al. Relationships between biomarkers in aging and dementia. Neurology. 2009;73:1193–1199. doi: 10.1212/WNL.0b013e3181bc010c. [DOI] [PMC free article] [PubMed] [Google Scholar]
- 19.Landau SM, Harvey D, Madison CM, et al. Associations between cognitive, functional, and FDG-PET measures of decline in AD and MCI. Neurobiol Aging. 2011;32:1207–1218. doi: 10.1016/j.neurobiolaging.2009.07.002. [DOI] [PMC free article] [PubMed] [Google Scholar]
- 20.Joshi AD, Pontecorvo MJ, Clark CM, et al. Performance Characteristics of Amyloid PET with Florbetapir F 18 in Patients with Alzheimer’s Disease and Cognitively Normal Subjects. J Nucl Med. 2012;53:378–384. doi: 10.2967/jnumed.111.090340. [DOI] [PubMed] [Google Scholar]
- 21.Mormino EC, Kluth JT, Madison CM, et al. Episodic memory loss is related to hippocampal-mediated beta-amyloid deposition in elderly subjects. Brain. 2009;132:1310–1323. doi: 10.1093/brain/awn320. [DOI] [PMC free article] [PubMed] [Google Scholar]
- 22.Rowe CC, Ellis KA, Rimajova M, et al. Amyloid imaging results from the Australian Imaging, Biomarkers and Lifestyle (AIBL) study of aging. Neurobiol Aging. 2010;31:1275–1283. doi: 10.1016/j.neurobiolaging.2010.04.007. [DOI] [PubMed] [Google Scholar]
- 23.Mintun MA, Larossa GN, Sheline YI, et al. [11C]PIB in a nondemented population: potential antecedent marker of Alzheimer disease. Neurology. 2006;67:446–452. doi: 10.1212/01.wnl.0000228230.26044.a4. [DOI] [PubMed] [Google Scholar]
- 24.Fleisher AS, Chen K, Liu X, et al. Using positron emission tomography and florbetapir F18 to image cortical amyloid in patients with mild cognitive impairment or dementia due to Alzheimer disease. Arch Neurol. 2011;68:1404–1411. doi: 10.1001/archneurol.2011.150. [DOI] [PubMed] [Google Scholar]
- 25.Shimada H, Ataka S, Takeuchi J, et al. Pittsburgh compound B-negative dementia: a possibility of misdiagnosis of patients with non-Alzheimer disease-type dementia as having AD. J Geriatr Psychiatry Neurol. 2011;24:123–126. doi: 10.1177/0891988711409410. [DOI] [PubMed] [Google Scholar]
- 26.Edison P, Archer HA, Hinz R, et al. Amyloid, hypometabolism, and cognition in Alzheimer disease: an [11C]PIB and [18F]FDG PET study. Neurology. 2007;68:501–508. doi: 10.1212/01.wnl.0000244749.20056.d4. [DOI] [PubMed] [Google Scholar]
- 27.Rabinovici GD, Rosen HJ, Alkalay A, et al. Amyloid vs FDG-PET in the differential diagnosis of AD and FTLD. Neurology. 2011;77:2034–2042. doi: 10.1212/WNL.0b013e31823b9c5e. [DOI] [PMC free article] [PubMed] [Google Scholar]
- 28.Massoud F, Devi G, Stern Y, et al. A clinicopathological comparison of community-based and clinic-based cohorts of patients with dementia. Arch Neurol. 1999;56:1368–1373. doi: 10.1001/archneur.56.11.1368. [DOI] [PubMed] [Google Scholar]
- 29.Ranginwala NA, Hynan LS, Weiner MF, White CL., III Clinical criteria for the diagnosis of Alzheimer disease: still good after all these years. Am J Geriatr Psychiatry. 2008;16:384–388. doi: 10.1097/JGP.0b013e3181629971. [DOI] [PubMed] [Google Scholar]
- 30.Lim A, Tsuang D, Kukull W, et al. Clinico-neuropathological correlation of Alzheimer’s disease in a community-based case series. J Am Geriatr Soc. 1999;47:564–569. doi: 10.1111/j.1532-5415.1999.tb02571.x. [DOI] [PubMed] [Google Scholar]
- 31.Pearl GS. Diagnosis of Alzheimer’s disease in a community hospital-based brain bank program. South Med J. 1997;90:720–722. doi: 10.1097/00007611-199707000-00013. [DOI] [PubMed] [Google Scholar]
- 32.Chetelat G, Villemagne VL, Pike KE, et al. Relationship between Memory Performance and beta-Amyloid Deposition at Different Stages of Alzheimer’s Disease. Neurodegener Dis. 2012;10:141–144. doi: 10.1159/000334295. [DOI] [PubMed] [Google Scholar]
- 33.Pike KE, Ellis KA, Villemagne VL, et al. Cognition and beta-amyloid in preclinical Alzheimer’s disease: data from the AIBL study. Neuropsychologia. 2011;49:2384–2390. doi: 10.1016/j.neuropsychologia.2011.04.012. [DOI] [PubMed] [Google Scholar]
- 34.Rodrigue KM, Kennedy KM, Devous MD, Sr, et al. β-Amyloid burden in healthy aging: regional distribution and cognitive consequences. Neurology. 2012;78:387–395. doi: 10.1212/WNL.0b013e318245d295. [DOI] [PMC free article] [PubMed] [Google Scholar]
- 35.Jack CR, Jr, Lowe VJ, Weigand SD, et al. Serial PIB and MRI in normal, mild cognitive impairment and Alzheimer’s disease: implications for sequence of pathological events in Alzheimer’s disease. Brain. 2009;132(pt 5):1355–1365. doi: 10.1093/brain/awp062. [DOI] [PMC free article] [PubMed] [Google Scholar]
- 36.Resnick SM, Sojkova J, Zhou Y, et al. Longitudinal cognitive decline is associated with fibrillar amyloid-beta measured by [11C]PiB. Neurology. 2010;74:807–815. doi: 10.1212/WNL.0b013e3181d3e3e9. [DOI] [PMC free article] [PubMed] [Google Scholar]
- 37.Reiman EM, Chen K, Alexander GE, et al. Functional brain abnormalities in young adults at genetic risk for late-onset Alzheimer’s dementia. Proc Natl Acad Sci U S A. 2004;101:284–289. doi: 10.1073/pnas.2635903100. [DOI] [PMC free article] [PubMed] [Google Scholar]
Associated Data
This section collects any data citations, data availability statements, or supplementary materials included in this article.