

Abstract
Oscillations in brain activities with periods of minutes to hours may be critical for normal mood behaviors. Ultradian (faster than circadian) rhythms of mood behaviors and associated central nervous system activities are altered in depression. Recent data suggest that ultradian rhythms in serotonin (5HT) function also change in depression. In two separate studies, 5HT metabolites in cerebrospinal fluid (CSF) were measured every 10 m for 24 h before and after chronic antidepressant treatment. Antidepressant treatments were associated with enhanced ultradian amplitudes of CSF metabolite levels. Another study used resting-state functional magnetic resonance imaging (fMRI)to measure amplitudes of dorsal raphé activation cycles following sham or active dietary depletions of the 5HT precursor (tryptophan). During depletion, amplitudes of dorsal raphé activation cycles increased with rapid 6 s periods (about 0.18 Hz)while functional connectivity weakened between dorsal raphé and thalamus at slower periods of 20 s (0.05 Hz). A third approach studied MDMA (ecstasy) users because of their chronically diminished 5HT function compared to non-MDMA polysubstance users (Karageorgiou et al., 2009). Compared to a non-MDMA using cohort, MDMA users showed diminished fMRI intra-regional coherence in motor regions along with altered functional connectivity, again suggesting effects of altered 5HT oscillatory function.
These data support a hypothesis that qualities of ultradian oscillations in 5HT function may critically influence moods and behaviors. Dysfunctional 5HT rhythms in depression may be a common endpoint and biomarker for depression, linking dysfunction of slow brain network oscillators to 5HT mechanisms affected by commonly available treatments. 5HT oscillatory dysfunction may define illness subtypes and predict responses to serotonergic agents. Further studies of 5HT oscillations in depression are indicated.
Keywords: Chronobiology, Depression, Serotonin, Dopamine, Tryptophan Depletion, Raphé Nuclei, MDMA, fMRI
Introduction
Overview
Dysfunction in neuronal oscillatory mechanisms may contribute to specific functional network deficits in psychiatric illnesses, including depression (Llinás,1988). Rhythms associated with mood behavioral disturbances (Kramlinger and Post, 1996) and brain network activities (Aschoff, 1981; Bullock et al., 1995; Buzsaki, 2006) both cycle over a very wide range of frequencies. In depression, disrupted circadian rhythms are well-documented, and are frequently associated with serotonin (5HT) function (Healy, 1987; Souêtre et al. 1989; Bunney and Bunney, 2000;Lewy, 2002; Mendlewicz, 2009; Albrecht, 2010; Ciarleglio et al. 2011). Behavioral changes also occur across a range of ultradian rhythms.
Ultradian rhythms are faster than circadian rhythms and can be defined as those rhythms with a cycle completed in less than 20 h (Stupfel and Pavely, 1990). The importance of ultradian rhythms became evident with the discovery of rapid eye movement (REM) phases during sleep (Aserinsky and Kleitman, 1953). The finding was later reinforced by the recognition of hormone surges that coincide with REM cycles (Kimura and Kawakami, 1981). Depression is associated with changes in many ultradian somatic rhythms that are under central control, perhaps most notably the phases of sleep (Buysse et al., 1990; Goldenberg, 1993). Depression affects ultradian cycles in motor activity (Benoit et al., 1985), appetite (Waterhouse et al. 1997), cognition and attention (Gordon et al., 1995; Conte et al., 1995), and heart rate variability (Carney et al., 2001).
Most of these depression-associated ultradian changes are linked to 5HT function (see below), yet examinations of their associations with ultradian 5HT rhythms are few. This review will focus on brain 5HT-related correlates of oscillatory network activity in depression. We will review findings supporting the argument that associations between depressive syndromes and 5HT dysfunction may be modeled on and accounted for in part by deficits in ultradian oscillations. A need for better neurobiological definitions and treatments for depression, as evidenced by the inadequacies of monotherapy for up to two-thirds of depressed patients (Trivedi et al 2006), suggests that an understanding of ultradian deficits in depression may be important.
An extension of this introduction summarizes reasons for studying ultradian 5HT rhythms. A background section then discusses known effects of oscillators on brain networks, evidence for oscillations in 5HT function, 5HT neuron anatomy(relevant to oscillatory functions), and cellular and molecular aspects of 5HT chronobiology. The latter examines rhythms of 5HT synthesis and degradation, their effects on behaviors and brain regions, and nutritional effects on 5HT chronobiology. Evidence supporting a 5HT (and other monoamine) oscillation model for depression completes the background section. Recent measurements reflecting central 5HT rhythms in depression follow. Terminology and concepts regarding rhythms from time series data sets are discussed in an Appendix.
Why Pursue 5HT Ultradian Rhythms in Depression?
In depression, 5HT function (Maes and Meltzer, 1995) and mood behaviors change in tandem. Given the important role of 5HT mechanisms in antidepressant treatments, an exploration of relationships between rhythms of 5HT function and rhythms of depression-related behaviors is overdue. Measuring ultradian rhythms in central 5HT function is difficult. The range of ultradian frequencies available for exploration, from about 0.1Hz to 0.000015 Hz (10 s to 18 h cycle periods), is extremely broad even without counting frequencies vulnerable to cardiac and respiratory artifacts (about 1 Hz to 0.3 Hz). In terms of octaves (frequency doublings), this leaves about twice the seven octave frequency range of a piano. For additional perspective, wavelengths in the visible light spectrum double only once.
Several lines of evidence suggest an association between 5HT rhythms and cerebral activity rhythms. The effects of depression on specific EEG bands may be due, in part, to altered 5HT function. Electroencephalographic data (EEG) in preclinical studies show 5HT influences on cortical neural activity (Roth et al., 1970; Vanderwolf and Baker, 1986; Vanderwolf, 1992). Human depression is associated with ultradian changes in EEG and magnetoencephalography for cortical and cortico-thalamic oscillatory theta frequencies (4-8 Hz), using measures of cordance (a measure of synchronous activities) or dynamical complexity (see Appendix; also Pezard et al., 1996; Cook and Leuchter, 1998; Llinas et al., 1999; Cook et al., 2009; Leuchter et al., 2009). The EEG offers a predictor of antidepressant response (Cook et al., 2009; Leuchter et al., 2009;Baskaran et al., 2012). As previously noted, 5HT function in depression is linked to disruptions in REM sleep phases (Maes and Meltzer, 1995; Buysse et al., 1990). Normally, 5HT cycles ‘off’ approximately every 90 m with the onset ofREM phases of sleep (van Esseveldt et al., 2000; Datta et al., 2007). Sleep phases shift earlier in the night and show shorter total duration in depression (Goldenberg, 1993), still linked to 5HT cycles. The sleep EEG in depression shows diminished slow (80 – 120 m) oscillations in inter-hemispheric beta coherence and in intrahemispheric coherence between beta and delta rhythms during sleep (Armitage et al., 1999). Altered 5HTfunction and depression are also associated with altered appetite and feeding behavior, which show rhythms that are slowed by hypothalamic administration of 5HT agonists (Leibowitz and Shor-Posner, 1986; Liebowitz and Alexander, 1998; Stanley et al., 1989). It is possible that REM phases, EEG band coherence, and feeding are influenced by a single ultradian clock mechanism governing 5HT activity, and may involve 5HT oscillations that organize and synchronize brain and behavior rhythms related to depression.
Rodent models of depression show altered 5HT neuron low-frequency firing rates that are normalized by antidepressant administration for two weeks (Blier et al., 1987; Piñeyro and Blier 1999; Blier 2001). This is about the time delay typically needed for a clinical response. Restoring disturbed somatic rhythms (such as in jet lag, see below) also requires days to weeks, again a time frame consistent with the time period for adjusting 5HT rhythms. While the available evidence does not clarify whether ultradian rhythm changes result from or precede depression, others have suggested that depression may be an illness due to, rather than merely associated with, chronobiologic dysfunction (Souêtre, 1989; Kálmán and Kálmán, 2009).
Ultradian behaviors in depression are not altered in one single direction but, instead, become locked in either hyper- or hypoactive states (e.g. hypersomnia or insomnia). This may suggest that static measures would suffice. To the contrary, dynamic measures may be critical to represent disruptions of healthy rhythms. Normal central chronobiological rhythms are expressed in behaviors (e.g. sleep), central hormone release (e.g. melatonin, growth hormone, or adrenocorticotropin), or network activities (e.g. intrinsic interactions among neurotransmitter systems). None of these normal cycles can be adequately characterized by momentary states of network components (Mandell and Selz, 1997; Chialvo 2010). Rather than representing a general shift toward slower or faster oscillations, impaired ultradian oscillators in depression may show diminished variability and flexibility, no longer responsive to normal homeostatic cycling and environmental influences. Measuring the difference between health and depression, then, would require dynamic (time series) data to capture normal, balanced oscillations and, in depression, their disturbances. Consequently, complex mood behaviors linked to5HT suggest that measures of 5HT at a single point will not be sufficient to capture gradual shifts in ultradian rhythmicity. Time series measures are needed to capture variations in waveforms, such as phase shifts, variance in frequencies, and aperiodic (‘flat’) epochs (see Stupfel and Pavely, 1990). Determining the optimal methods for assessing central neurobiological ultradian cycles, their relationships to illness, and the effects of medications needs further study. Ultradian 5HT oscillatory rhythm measurements may aid explorations of cortical, subcortical, and brainstem dysfunction in depression.
Background
Oscillators Influence Brain Network Function
Evidence from EEG (see above) and functional magnetic resonance imaging (fMRI)show highly replicable oscillatory relationships among networked brain regional nodes within relatively narrowly defined frequency bands (Biswal et al., 1995; Gusnard and Raichle, 2001;Fox et al., 2005; Salvador et al., 2008; Cabral et al., 2011). Paired regions, or network nodes, show both positive and negative correlations. Each displays net oscillatory effects of multiple inputs. While useful in revealing large scale network oscillations, EEG and fMRI studies have been limited to cortical and diencephalic regions. The roles of oscillations in raphé (5HT) and other brainstem nuclei have received relatively little attention.
Serotonin Oscillations in Depression
Dorsal raphé 5HT neurons appear to function as pacemakers (Burlhis and Aghajanian, 1987). Although changes in 5HT function are associated with depression and its treatments (Bel and Artigas, 1993; Engström et al., 1999; Delgado et al., 1990; 1999; Meyer, 2007; Caspi et al., 2003), little is known about 5HT oscillations in depression. Static measures of 5HT function (see examples in Appendix) do provide important information about global 5HT tone. Some times serially collected measurements are reduced to a single outcome (e.g., neuroendocrine challenge studies), reducing the value of time series information. Without examining variability over time, studies measure effects of reuptake inhibitors, synthesis inhibitors, post-synaptic agonists, oxidative enzyme inhibitors, and acute tryptophan depletion. Characterizations of oscillations in 5HT function are needed.
Raphé anatomy
Regardless of terminal target location, all central 5HT axons arise from brainstem raphé nuclei. Each of these, in particular the midline pontomesencephalic dorsal raphé nucleus (Figure 1), is surrounded by brainstem anatomical landmarks (Azmitia and Whitaker-Azmitia 1991; Baker et al., 1991; Paxinos and Watson, 2005; Waselus et al., 2011, Son et al., 2012), allowing region selection in imaging studies. The proximity of the raphé nuclei with each other may enhance their ability to function to some degree synchronously (see below).
Figure 1.

Manually drawn region inclusive of dorsal raphe. CC=corpus callosum, DR=dorsal raphé, Th=thalamus, IV=4th ventricle.
Fine axons from the dorsal raphé and larger axons from the median raphé project to mood-regulating basal ganglia and limbic pathways. Rich 5HT innervations of thalamic and limbic structures (Marek et al., 2001; Chapin and Andrade, 2001; Varnäs et al., 2004; Selvaraj et al., 2009; Price et al., 2010) modulate thalamo-cortical activities (Andersen et al., 1983; reviews: McCormick 1992; Steriade 1999) and lend plausibility to a role for oscillatory 5HT dysfunction in depression.
Central 5HT Chronobiology
Synthetic and degradation rhythms
Intrinsic clocklike events have long been described in pontine nuclei (Jouvet, 1965, 1999). Mechanisms underlying rhythms in a range of seconds to minutes may arise from intrinsic cell metabolic cycles, generating low frequency fluctuations (Novák and Tyson, 2008). Central 5HT synthesis from the obligatory precursor, tryptophan, is a periodic function affected by cycles in molecular activity, nutrition, and other extrinsic influences.
Tryptophan plasma levels, blood brain barrier passage, and distribution to synthetic pathways are subject to very diverse somatic cycles. For example, cytokines show ultradian rhythms and influence activity cycles of indoleamine 2,3-dioxygenase, an enzyme that diverts tryptophan away from 5HT synthesis (Antonioli et al. 2012; Christmas et al. 2011). Activities of tryptophan hydroxylase, the rate limiting enzyme in 5HT synthesis, cycle differentially with age and brain region (Nagayama 1999). 5HT is stored in vesicles of neuron terminals until release into the synapse, where firing rates show ultradian variability (see below). Ultradian variability is also seen in the presynaptic retrieval of 5HT by the reuptake transporter, and repackaging into storage vesicles may also show periodicity. Free extravesicular, synaptic, and peri-synaptic 5HT degradation to 5HIAA is affected by a variety of rhythms, including monoamine oxidase activity cycles (e.g. Hampp and Albrecht, 2008). Ultradian cycles of this metabolite can be reliably measured in serial lumbar CSF samples (Salomon et al., 2005), where the majority of 5HIAA is from cortical and subcortical sources (Blennow et al., 1993).
Preclinical evidence
Preclinical studies show influences of 5HT on slow behavioral rhythms and cortical oscillatory activities. For example, chronic (3 days) administration of zimelidine, a 5HT reuptake inhibitor (SRI), diminishes oscillations in rat pup motor activity. Normal activity bursts occur 14 to 15 times per day on average, in approximately 100 min cycles (Barber et al., 1989). Molecular markers of life-cycle rhythms in both 5HT and dopaminergic function are important in development and later, as well, in homeostasis (McCobb et al., 1988; Whitaker-Azmitia and Azmitia, 1989).
Low 5HT function diminishes synchrony in rostral cortical and limbic mood-related regions. Ultradian behavioral changes are linked to 5HTrhythms in the cat, where robust fluctuations in central 5HT function govern ultradian sleep cycles. Single cell spiking in the raphé during wakefulness (2-3 Hz) slows (1 Hz) during slow-wave or synchronized sleep, virtually ceasing (0.05 Hz) during desynchronized sleep (Lydic et al., 1984). Inhibition of 5HT synthesis by p-chlorophenylalanine (PCPA)causes insomnia in cats, and affects firing patterns in the hippocampus, a component of the limbic circuit. Hippocampal firing patterns after PCPA are similar to those seen during paradoxical (desynchronized) sleep. Slow-wave sleep patterns are restored with 5HT agonist administration (Mushiake et al., 1988), possibly by restoring 5HT oscillatory activity. Similarly, electrical stimulation of raphé-hypothalamic pathways and applications of 5HT agonists to tissue slices shift circadian phases of slow oscillations in hypothalamic activity (Meyer-Bernstein and Morin 1999; Biello, 2009). Additionally, systemic PCPA produces a phase shift in corticopontine theta synchrony(Kalauzi et al., 2009), again suggesting a clocklike 5HT signal-coordinating effect.
Administration of the 5HT2 agonist and hallucinogen, DOI, diminishes low-frequency (0.3– 4 Hz) amplitudes in medial prefrontal pyramidal neurons as measured by single-unit extracellular recordings in anesthetized rats. Slow oscillations in cortical firing rates are restored by administration of clozapine, an antipsychotic drug with potent 5HT2 antagonism (Celada et al., 2008). This may be heuristically explained by modeling the strong agonist effects of DOI as a ceiling effect, overwhelming oscillatory inputs to cortical 5HT receptors, and effectively overriding the oscillatory regulation. Paradoxically, this ceiling effect may mimic its floor effect counterpart (tryptophan depletion, see below, Salomon et al., 2003a). Extremes in 5HT release may diminish amplitudes of 5HT oscillations and result in dysregulated cortical rhythms.
External inputs to the raphé appear to influence oscillations in metabolism and cell firing considerably at low neurophysiologic frequencies (∼0.5–12Hz). During slow wave sleep, increased firing bursts from a subset of about half of raphé 5HT neurons are associated with diminished cortical oscillations, while another subset (again about half) of the 5HT neurons fire in a clocklike fashion without evidence of cortical entrainment. Conversely, diminished 5HT neuron firing is associated with active cortical phases and increased non-5HT neuron activity in the raphé (Schweimer et al., 2011). Reciprocal connections (Adell et al., 2010) between raphé and frontal cortex regions may be critical to the control of raphé oscillators.
Other oscillators, such as circadian oscillators that are endogenously controlled, are innervated and influenced heavily by 5HT afferents. In the hamster, 5HT neurons project from median raphé to the circadian suprachiasmatic nucleus and from dorsal raphé to the sleep/wake-critical pineal (Leander et al. 1998). In the pineal, N-acetylserotonin, produced by5HT acetylation, activates TrkB receptors with a circadian rhythm (Jang et al. 2010). Additionally, computational models of raphé and other modulatory neurons suggest that their oscillations alter network behavior dramatically at low frequencies (Quilichini and Bernard, 2012). These models present multiple co-existing stable frequencies and spike synchrony that may spread from within a local neural subgroup to the global network (Wong-Lin et al., 2012).
Clinical findings
Clinical studies of5HT, dopamine, melatonin and other central neurotransmitters show clock-like rhythms displaying annual, seasonal, monthly, weekly (infradian), daily (circadian)and near-hourly (ultradian) periods (Table I). For example, at the slower end of the cycling spectrum, seasonal variations in 5HT levels and reuptake transporter binding in the brain are observed throughout the year (Praschak-Rieder et al. 2008). These switches are triggered in part by environmental events. Within the ultradian spectrum, a human in vivo microdialysis study showed a dramatic ultradian synchrony between lateral ventricle 5HT levels and rapid eye movement sleep phases (Zeitzer et al., 2002).
Table I. Clinical detection of CNS slow monoamine oscillations a.
| Measures | Examples | Time unit | Sampling method | Strengths | Major Weaknesses |
|---|---|---|---|---|---|
| Behavior | Sleep study; Motor activity | > Hours | Observation | Non-invasive | Multifactorial, specificity |
| Self-report | Low cost | Reliability, specificity | |||
| Polysomnography | Quantifiable | Specificity | |||
| Neurochemistry | Monoamine metabolites | > Minutes | Peripheral sampling | Indirect reflection | Invasive |
| CSF sampling | |||||
| Electroencephalogram | EEG BEAM | > Milliseconds to seconds | Surface EEG | Quantifiable | Specificity, poor deep structure sensitivity |
| Field Mapping | |||||
| Intraoperative | |||||
| Radioactive labels | PET | > Hours | 015 water | Regional specificity for raphé | Cost; limit of two scansdue to radiation exposure |
| SPECT | > Hours | Specific | Lower cost vs. PET | Limited resolution | |
| Functional Imaging | fMRI | > Seconds | BOLD | Regional hemodynamic change | Cost, Hemodynamic response intermediate, Movement artifacts |
Examples of time series acquisition methods, not exhaustive. Abbreviations: EEG – electroencephalogram; BEAM – Brain Electrical Activity Mapping; PET – Positron Emission Tomography; SPECT – Single Photon Emission Tomography; CSF – cerebrospinal fluid; BOLD – Blood Oxygenation Level Determined
Nutritional effects on 5HT rhythms
As introduced briefly above, tryptophan availability influences5HT synthesis and depressed mood (Delgado et al., 1991, 1999; for review: Salomon et al., 1993). Tryptophan is an essential amino acid, available only through dietary intake, and is the obligatory precursor of 5HT. Circadian fluctuations in total plasma tryptophan (Dam et al. 1984; Candito et al. 1990, 1992) may be affected by timing of meals. However, during prolonged (21 h) fasting, circadian (Kennedy et al., 2002) and ultradian (Salomon et al., 2005) fluctuations in CSF tryptophan and 5HIAA persist. The latter study showed a weak correlation between CSF and plasma tryptophan levels during 24-h balanced diet administration.
CSF and plasma tryptophan levels plummet in close parallel following an acute tryptophan depletion (ATD) diet. The ATD diet delivers large quantities of fifteen other (not tryptophan) amino acids, promoting hepatic protein synthesis that incorporates any existing tryptophan reserves into storage proteins. Then, at the blood brain barrier, surplus tyrosine, phenylalanine, valine, methionine, leucine, isoleucine and histidine and low levels of tryptophan force a competition for the large neutral amino acid transporter (Moreno et al. 2010). ATD alters tryptophan processing and management at every step of 5HT synthesis: hepatic tryptophan storage, blood brain barrier transport, neuronal uptake, indoleamine 2,3-dioxygenase and other metabolic pathway activity, tryptophan hydroxylase activation, and vesicle packaging (see above for discussions of their rhythms.) As such, ATD models a single, low functioning phase of the 5HT oscillatory cycle.
Tryptophan metabolism within the brain appears to be influenced by individually specific traits since ATD tryptophan nadirs and slopes (vs. time) during depletion and repletion (restoration) are strongly correlated in within-subjects comparisons of pre- and post-treatment samples. This suggests considerable stability in tryptophan metabolism features despite changing mood states and SRI presence (Salomon, unpublished data). Mechanisms through which ATD may predict depression risk after treatment discontinuation (Moreno et al., 2009; Allen et al., 2009) may be related to resilience of oscillations as 5HT availability declines. Rhythmic characteristics of tryptophan availability and metabolism may guide pharmacotherapy development and prescription practices in the future, since chronobiology has a powerful influence on psychotropic effects (review, Nagayama, 1999).
Modeling 5HT Oscillations in Depression
Oscillators, like raphé 5HT activities, are frequently in part self-regulated by intrinsic feedback. SRI antidepressants initially increase 5HT availability. This slows raphé 5HT neuron firing rates (e.g. with clomipramine administration, Yavari et al.,1993) via stimulation of presynaptic 5HT-1 autoreceptors. This reduced firing persists until the autoreceptors adapt (Blier, 2001). After chronic treatment, reduced autoreceptor feedback leads to normalized 5HT neuron firing rates. Conversely, diminished 5HTthroughput (e.g. from diminished 5HT release, as hypothesized in depression) may increase raphé firing rates and cycles of neuronal metabolism. Suicidal states are associated with increased neuronal metabolism in the form of tryptophan hydroxylase gene transcription and enzyme synthesis (Bach-Mizrachi, 2006,2008). Consistent with this, the diminished 5HT function following ATD diets appears to cause a compensatory increase in raphé blood flow, as observed by H215O positron emission tomography (PET). Raphé blood flow is correlated inversely with both plasma tryptophan levels and mood ratings (Morris et al. 1999). Further, raphé metabolism signatures from fMRI are also altered following ATD in remitted patients, again suggestive of increased metabolic activity (Salomon et al., 2011a, see below).
Afferents from the ventral medial prefrontal cortex to dorsal raphé 5HT and gamma-amino butyric acid (GABA) neurons modify behavior in rodent studies. Loss of ventromedial prefrontal input to dorsal raphé is associated with decreased motivation and increased inertia (Warden et al., 2012), which may be evidence of diminished slow oscillatory activity and may be primarily serotonergic, since 5HT neurons fire at about 2 Hz while raphé GABA neurons fire rapidly at about 10 Hz (Allers et al., 2003). Locally, other raphé transmitters create slow rhythms in positive and negative feedback loops (Pigolotti et al. 2007, Hu et al 2007, Hu et al 2008; Tsai et al 2008). Diminished 5HTinhibition of GABA interneurons (Liu et al 2000) may increase GABA release, which may further inhibit 5HT release. Alternatively, 5HT also inhibits prefrontal glutamatergic excitatory inputs (Celada et al., 2001; Ciranna, 2006), so that diminished 5HT activity could allow greater excitatory activity. In sum, an increase in raphé firing activity is observed with diminished 5HT synthesis and release, predominantly due to reduced signaling at inhibitory 5HT1autoreceptors (Gallager and Aghajanian, 1976; Tao and Auerbach, 2000;Sprouse and Aghajanian, 1987; Stamford et al., 2000; Gartside et al., 2007; Evans et al., 2008; Papp et al., 2008). Diminished5HT release and self-regulation alters the frequencies, in addition to amplitudes, of raphé firing patterns (Figure 2). Models of diminished oscillatory cycling of 5HT, as a core and defining feature of depression, may account for multiple deficits in a wide range of systems. The average amount of transmitter activity over time may not change; the seeming stability of the mean may obscure important time-variance in signaling. A multiple cyclical model of network (including 5HT) dysfunction posits rhythmic flexibility of modulated network interactions in normal healthy functioning states. In depression, oscillatory support of network flexibility may deteriorate to static or weakly cyclic functions with diminished variance (amplitude) over time. Rhythmic modulatory inputs promote pliability in responses: a minimally cycling, rigid system becomes brittle and vulnerable to functional losses with abrupt stress and demands for change.
Figure 2.

Metabolic changes during ATD may relate to: (1)afferent synapses with decreased stimulatory inputs to inhibitory interneurons, (2) autoreceptor with decreased autoregulation, and (3) diminished input from other raphé 5HT neurons.
The model heuristically explains seemingly paradoxical depressive clinical phenotypes, where both extremes of dysfunction (as a sign or symptom) may be expressed. For example, either excess or reduced appetitive or sleep behaviors are readily modeled in a hypo-oscillatory, rigid and minimally pliable system. Cognitive dysfunction (loss of interest, decreased concentration) contrasts with hyper-focused ruminative, preoccupied states. Psychomotor retardation contrasts with psychomotor agitation. Each of these seemingly opposing states may be consequences of a hypo-oscillatory system, where the normal range of activity is lost and the behavior persists in one extreme, often outside the normal range. Interactions between5HT firing rhythms and rhythms found in other brainstem regions (cholinergic, dopaminergic, and adrenergic) may provide an important coordinating drive for cortical activities, e.g. slow theta rhythms, influencing rostral pathways by enhancing synchronized activities. Measures of central oscillatory function are critical to an evaluation of this model.
Rhythmic Monoamine Interactions
Interactions among monoaminergic transmitter systems significantly affect neuronal activity levels (Guiard et al., 2008), yielding unexpected effects of theoretically transmitter-specific psychotropic treatments (Potter et al., 1985). In preclinical studies, 5HT inputs to the dopaminergic ventral tegmental area (VTA) markedly diminish characteristic inhibition-excitation response patterns in dopaminergic neuron firing, an effect that was abolished by PCPA (Gervais and Rouillard 2000). This suggests an interaction between 5HT and dopaminergic oscillations, whether directly or indirectly. Oscillations in 5HT output may alternately suppress (with strong 5HT output) and permit (with weak 5HT output) VTA oscillations, yielding a biphasic response system. Peak 5HT output would be expected to inversely correlate with the VTA dopamine output, while nadir 5HT outputs could allow greater prominence of oscillations intrinsic to the VTA.
Mechanisms supporting this conceptualization may be several. An anxiogenic substancewith 5HT2 agonist properties, m-chlorophenylpiperazine, activates non-dopaminergic VTA (probably GABA) interneurons (Di Giovanni et al., 2001). Additionally, the 5HT1a partial agonist, pindolol, activates dopaminergic cells in the VTA while inhibiting 5HT neurons in the dorsal raphé (Lejeune and Millan 2000, Nguyen et al., 2009). Lesioned raphé effects on subthalamic nucleus firing rates are diminished by lesions of substantia nigra (Liu et al., 2007). Showing another interaction, norepinephrine stimulates, and prazosin (a selective alpha1 antagonist that inhibits norepinephrine release from the locus coeruleus) reduces firing in presumed raphé serotonergic neurons (Vandermaelen and Aghajanian 1983).
It may be possible to observe global activity changes within these monoamine nuclei using fMRI since BOLD signal changes are thought to be closely related to activities of local interneurons (Gsell et al., 2006). Changes in rhythmicity of activity patterns are likely to be detectable, since any of these mechanisms would be expected to alter feedback rhythms within the local inter-cellular network. Further study is needed to define how such neuronal interactions may be a source of intra-tissue oscillatory activities.
Human Central 5HT Time Series Findings
Evidence of central oscillators in clinical studies
Oscillatory behaviors in central neurotransmitter and neurotransmitter-like systems are not easily shown in clinical populations, where electrodes and microdialysis probes are not practical. Recent studies show evidence of oscillatory 5HT functions based on:1) CSF monoamine metabolites; 2) fMRI functional connectivity with the raphé; and 3) MDMA-associated fMRI changes.
CSF monoamine metabolites
Oscillations in monoamine metabolites in depression were studied in two independent collections of cerebrospinal fluid (CSF) using indwelling lumbar catheters. Patients kept strict bed rest and received balanced nutritional diets with meals only at 6:30 a.m. and 9:30 a.m.; 24 h collections began at 8 a.m. after fasting overnight. Rhythmic time courses, consistent with intrinsic oscillators, were observed in levels of 5HT and dopamine metabolites. Pretreatment (depressed) baseline collections were repeated after 5 weeks of either sertraline or bupropion treatment.
CSF collections every 10 m in thirteen untreated depressed patients were analyzed for means and variances in 5HIAA levels from HPLC assays. Patients' 24-h 5HIAA means showed a narrow spread, but within-subject (144 samples) variances differed widely (Salomon et al., 2005). Rapid fluctuations (100% increases within an hour were common throughout the day) may explain difficulties in replicating findings from single-time-point CSF sampling studies. In view of the large variances and appearances of rhythmic patterns, we conducted analyses for within-subject oscillatory components using Fourier transforms (Salomon et al., 2005) and wavelet transforms (Salomon et al., 2006). Statistical testing of large sets of Fourier coefficients used multivariate permutation testing, as validated for Fourier coefficient sets (Blackford et al., 2009).
Compared to variances observed at baseline, both sertraline and bupropion treatments were associated with decreased variance in 5HIAA, increased variance in HVA, and a markedly increased variance in the HVA:5HIAA ratio (highly significant). Correlations between5HIAA and HVA time series (within a single collection session) tended to be weaker following treatment, suggesting diminished inter-dependence, or enhanced independence, of the dopamine and 5HT systems after treatment. Treatments with either antidepressant were also associated with significantly decreased 1.75 h and 3.7 h 5HIAA rhythms. Significantly enhanced amplitudes of slower, 24-h rhythms for HVA and the HVA:5HIAA ratio were observed after treatment. An increase in ultradian variability, measured across the entire 24-h, was also observed for the HVA:5HIAA ratio. The non-responders (in small number) failed to show enhancements of the metabolite ratio rhythms (Figure 3).
Figure 3.
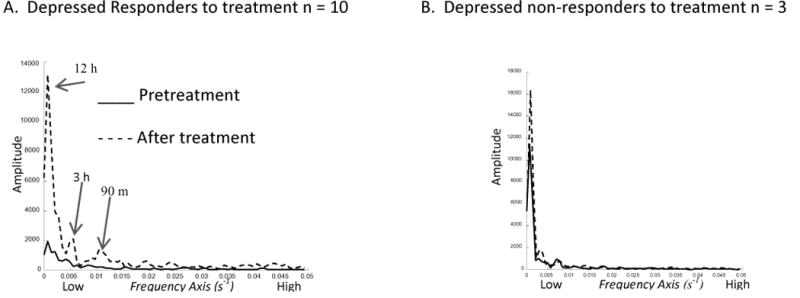
Periodogram – HVA:5HIAA Ratio (first study set). A: Responders show dramatic enhancement of 24-h, 3-h, and 90-m coefficients (labeled peak frequencies). B: This was not observed among the small number of non-responders to the antidepressants. (See Appendix for further explanation.)
To investigate peaks and diurnal variability in the strength of the ultradian rhythms, spectrogram windows of 520 m with 20 m advances (500 m overlap) were analyzed. Averages of differences between pre- and post-treatment were examined over the entire group, and showed enhanced HVA:5HIAA ratio variability, most prominent and statistically significant in the early evening from 7:10 pm to 9: 50 pm. A strong peak of oscillatory power centering around 84 m appeared at 7 p.m.(cycle periods ranged 1.2 to 1.7 h) (Figure 4). Oscillations in the ratio again suggest that antidepressants enhance cyclic interdependent features in the relationship between 5HT and DA turnover rates. The periodic features appear to coincide with circadian and also ultradian rhythms of basic rest-activity and REM cycles (e.g., see Lange, 1982).
Figure 4.

Spectrogram (first CSF depression study): antidepressant effects, as post- minus pre-treatment changes, in rhythms of the HVA/5HIAA ratio in serially sampled CSF. A statistically significant enhancement of 90-m rhythms (labeled peak) was seen through the evening. Clock time axis starts shortly after noon, ending at 3 a.m. Frequency axis is labeled by period length. T statistic reflects pre- to post-treatment difference. (See Appendix for further explanation.) Used by permission.
A second (previously unpublished) study sampled 9 medication-free depressed patients for forty-eight h per collection with a balanced diet (288 samples per visit). A complete data set includes two sampling sessions, before and after 8 weeks of sertraline or bupropion treatment. Baseline depression scores were moderate to severe. After 8 weeks of either treatment, five responders included 3 in remission. Variance in the HVA/5HIAA ratio increased, similar to the first set of 13 patients. Again, treatment was associated with enhanced ultradian amplitudes of the metabolite (HVA:5HIAA) ratio, peaking again in the evening (just 40 m later than in the first set), with a slightly longer average cycle length of 4 h. Nighttime hours displayed a second, longer duration major peak (also statistically significant) of 90 m periods in the HVA:5HIAA ratio (Figure 5).
Figure 5.

Spectrogram (second CSF depression study) of antidepressant effects on rhythms of the HVA/5HIAA ratio in serially sampled CSF. A significant enhancement of 4-h and 90-m rhythms was seen through the nighttime hours. See Figure 4 for axis labels. Used by permission.
This second study included healthy controls, allowing additional comparisons. Pretreatment depressed 5HIAA was about 25% of the level in control subjects. Following either treatment, 5HIAA levels in the depressed patients dropped significantly, by an additional 20% (which was seen also in the first study, and has been reported preclinically, e.g. Caccia et al., 1993). Variances for 5HIAA in depression were 71% of the post-treatment value. Control patients showed stability in the 5HIAA variance between their two sampling sessions 8 weeks apart compared to considerable within-subject changes in the depressed patients.
Characteristics of the interactions between the monoamines appear to be important in depression. Variance in the HVA:5HIA Aratio (48 h) more than tripled after treatment (Table II), again suggesting that treatment is associated with increased independence of the two systems. Depressed patients before treatment showed marked synchrony in the two monoamine metabolites' oscillations. It is possible that a third driver of the two systems produced these synchronous oscillations, or it may be that their interaction sets up these rhythms. Further study is needed, but these findings do support a role for non-linear aspects of 5HT function in depression.
Table II. HVA:5HIAA ratio variance with antidepressant treatment a.
| Variancea | Pretreatment | Post-treatmentb | ||||
|---|---|---|---|---|---|---|
| First 24 h | Second 24 h | 48 h total | First 24 h | Second 24 h | 48 h total | |
| HVA:5HIAA | 0.08±0.05 | 0.06±0.04 | 0.08±0.05 | 0.17±0.20 | 0.28±0.45 | 0.27±0.36 |
| F(8,8) | 3.73 | 11.9 | 6.6 | |||
| Significancec | p < 0.05 | p < 0.01 | p < 0.01 | |||
Variance in 144 samples (24 h) or 288 samples (48 h) per subject. Mean ± S.D., n=9 subjects.
Treatment 8 weeks sertraline 100 mg or bupropion 300 mg daily.
Two-tailed Student t, paired within-subject, between pre- and post-treatment conditions.
fMRI of dorsal raphé
Before the recent surge in interest for resting state studies, fMRI analytic methods generally examined effects of tasks on activation levels with analyses limited to cortical, subcortical, and sometimes basal ganglia regions. Brainstem studies were (and still remain) limited by cautions regarding target localization, movement artifact, and local susceptibility to signal degradation due to geographic neighbors. However, magnetic resonance imaging (MRI) reports using frequency-specific strategies show reliable localizations of brainstem serotonergic raphé regions based on routine neuroanatomical landmarks (Andersen et al., 1994; Supprian et al., 2004). Imaging localizations are guided by tissue-based ligand labeling, marking raphé nuclei in health and in pathology (Baker et al., 1990; Arango et al., 2001; Drevets et al., 1999; Bach-Mitzrachi et al., 2006, 2008). The sensitivity of raphé fMRI has been sufficient to show changes associated with acupuncture (Napadow et al., 2005, 2009).
Characteristics of oscillatory network activities influence functional connectivity directly (Quilichini and Bernard, 2012). Oscillations in BOLD activation were studied in a region inclusive of pontine dorsal raphé by using ATD or sham diets, one week a part, in SRI-responders to provoke 5HT function changes (Salomon et al., 2011a). fMRI signals from selected anatomically-drawn (Paus et al., 1996; Mayberg et al., 1997), mood-relevant regions (raphé, anterior cingulate, anterior thalamus)were band pass filtered and optimized with intraregional coherence analyses. Amplitudes within discrete frequency bands, as spectral power, estimated changes due to ATD in overall metabolism characteristics within individual regions. Functional connectivity, as the Pearson correlation in wavelet-transformed space (i.e., using the frequency-delimited, filtered signals), was analyzed between the dorsal raphé and selected mood-related brain regions. Functional connectivity is sensitive to local noise, and would deteriorate markedly if non-specific signal fluctuations in the brainstem due to movement, respiratory, cardiac and other artifacts (field shifts and other scanner artifacts) were a significant issue. The threshold for exclusion due to head motion was held very low. Large distances between the raphé and other regions reduced the likelihood that artifacts in one region would be common to both.
ATD highly significantly increased raphé high frequency (4 to 8 s periods, i.e. 0.25 to 0.125 Hz) spectral power (Table III) and simultaneously diminished low frequency (16 to 32 s periods, i.e. 0.06 to 0.03 Hz) raphé functional connectivity (Figure 6), especially for the raphé – anterior thalamus pair. The significant inverse correlation between raphé high-frequency power and low-frequency raphé-thalamic connectivity suggests interference with connectivity in the presence of high-frequency activity (Salomon et al., 2011a).A sham minus depletion correlation matrix is shown for a single patient (Figure 7), showing the marked association between ATD and changes in raphé connectivity.
Table III. Pontine raphé BOLD power (n=11)1.
| Period | Sham | ATD | P2 | ES | |
|---|---|---|---|---|---|
| UltraLow | >32 s | 2.0e5±9.9e4 | 2.1e5± 6.4e4 | 0.53 | .14 |
| Low | 16-32 s | 6.2e3±3.1e3 | 9.0e3±5.8e3 | 0.13 | .49 |
| Medium | 8-16 s | 9.0e3±1.0e4 | 1.2e4±5.9e3 | 0.21 | .53 |
| High | 4-8 s | 7.9e3±5.5e3 | 2.0e4±1.5e4 | 0.004 | .79 |
Mean ± SD power at specific frequency bands after wavelet filtering, n=11.
Wilcoxon signed ranks probability between diet conditions.
Abbreviations. e = exponent, 10n; ATD = acute tryptophan depletion diet; P = probability (see footnote above); ES = effect size; s = seconds.
Figure 6.

Low frequency (.03 - .06 Hz) specific changes in raphé functional connectivity, as mean of difference between scans one week apart preceded by ATD or sham diets (as sham minus ATD, n=11). Connectivity (r value) shown between brainstem raphé and anterior cingulate (AC), caudate head (CH), anterior thalamus (AT), and habenula (Hb). Colors of the connecting bars relate to flame scale at right. Used by permission.
Figure 7.

Pontine raphé functional connectivity differences (ATD minus sham) for a single patient. Color legends are difference values, ranging from r = .17 to .37. Other than the raphé connectivity values, the right caudate head vs. left habenula pair showed the next largest change (r = .15).
A second raphé study with ATD imaging before and after treatment for depression (Salomon et al., 2012a) has yielded midpoint analyses (n=6) with diminished raphé connectivity to the left caudate head (P<0.05) and left habenula (p<0.05) following ATD. In a comparison of sham diet scans before and after treatment with sertraline, raphé functional connectivity increased with the left habenula following sertraline for 12 weeks (p<0.05). Further analyses of the full data set are ongoing.
Imaging caveats
Several caveats to raphé fMRI interpretations were considered. First, this study included < .25 Hz frequencies, fairly close to artifact-producing physiologic frequencies such as 1 Hz cardiac cycles and .3 Hz respiratory rhythms (Frank et al., 2001; Mason et al., 2007; Pattinson et al., 2009). However, respiratory rhythms do not appear to interfere with brainstem bold consistently. Respiratory rate is proportional to end-tidal CO2 partial pressure, and appears to account for a small proportion of brainstem fMRI blood oxygenation level dependent (BOLD) signal fluctuations (correlation mean = .11; Wise et al 2004). This suggests that observations at these frequencies cannot be entirely dismissed as artifact. Also, since respiration and cardiac rates are governed by brainstem nuclei, true (not artifact) local neural activities contribute to both cardiac and respiratory rhythms. Furthermore, slow BOLD oscillations in the brainstem, much slower than cardiac (1 Hz) or respiratory (.3 Hz) periods, show changes during physiologically-relevant behaviors (Napadow et al 2005, 2009). Midbrain BOLD activation was consistently altered following acupuncture (Napadow et al 2006) or meditation (Lazar et al 2000).
Another group tested healthy males with ATD and showed changes in low frequency (0.01 – 0.08 Hz) cortical functional connectivity measures that were associated with changes in mood behaviors. No raphé or subcortical changes were described (Kunisato et al. 2011). In the depression ATD study (above), the contrast between raphé activation and diminished raphé-thalamic frequency connectivity was paralleled by a neuron modeling paradigm in which optimal amplitudes of high-frequency components of activity were important for optimal processing of low-frequency signal components (Yu et al. 2011).
These data support a model linking diminished 5HT availability, high-frequency (circa.2Hz) local feedback control of neuronal activity, and low-frequency (circa.04Hz) modulation of rostral mood regions. Oscillating characteristics of 5HT modulatory effects on processing at roughly these frequencies is also seen in studies of hemispheric dominance oscillations in patients with bipolar disorder (0.27 Hz) that were “sticky,” or slowed when measured as binocular rivalry switch rates. Control subjects (0.60 Hz) were used as the comparator (Pettigrew et al., 1998). Serotoninergic modulation of this visual processing feature, and also for cognitive processing, has been shown previously (Carter et al., 2005, 2007).
Effects of Diminished 5HT associated with Chronic MDMA Abuse
The recreational drug MDMA is a demonstrated 5HT neurotoxin in animals, and chronic MDMA use is associated with long-lasting impairments in human 5HTfunction (di Iorio et al. 2011). Functional connectivity among cortical and subcortical regions may be altered in prior recreational heavy MDMA (Ecstasy) users. To show this, fMRI scan data from chronic MDMA and non-MDMA polysubstance users (Karageorgiou et al., 2009) were re-analyzed for changes in functional connectivity. The MDMA users had already shown greater activations in motor pathway regions during finger tapping, possibly due to loss of 5HT-mediated cortical inhibition. In the reanalysis, prior MDMA-use was associated with diminished intra-thalamic coherence, and also with diminished thalamo-cortical functional connectivity (Salomon et al., 2012b). Clinically, this may be important since abnormal thalamo-cortical connectivity in BOLD fMRI has been previously demonstrated in a variety of psychiatric pathologies, including autism (Mizuno et al. 2006, Villalobos et al 2005).
Future Directions
Changes in ultradian oscillatory 5HT function scan be estimated clinically and are likely to be relevant to psychopathology (Miyamoto et al., 2012). Additional explorations of the physiological and genetic origins of ultradian rhythms (Wang et al., 2001) and their stability through development and aging (Blumberg et al. 2005) are needed. Treatment mechanisms may be based in part on rhythms of communication within the network. These rhythms may define depression subtypes and provide guidance for treatment selection in refractory illness. Other studies recently have revealed applications of time series analyses for oscillatory characteristics of monoamine function. Lee (et al. 2011) recently showed that power in the cortical electroencephalogram (EEG) at high gamma frequencies (above 30 Hz) is associated with variants in the serotonin transporter gene region (5HTT-LPR). A study of genetic effects on BOLD activity in the raphé will be undertaken. The standard for measuring monoamine function has shifted – single time point measures lack the capacity to reflect dynamic variability, and while they provide important information about static 5HT tone, they may fail to capture critical ultradian changes associated with depression and other psychiatric illnesses. While the review has focused on 5HT oscillators, we again would caution that we are not suggesting that the serotonin network(s) stand unique among oscillators altered in psychiatric illness. The findings presented, however, may serve to suggest that this may be one very reasonable place to start.
Acknowledgments
Neither author reports any conflict of interest related to this work. This work was supported by the National Institutes of Health with grants K23 MH01828 and R21 MH087803 to Dr Salomon (National Institute of Mental Health); grants R01 DA01537, R21 DA020149 (National Institute on Drug Abuse) and R21 MH073800 (National Institute of Mental Health) to Dr Cowan; and the Vanderbilt Clinical and Translational Science Award UL1TR000445 (National Center for Research Resources); and by the National Alliance for Research on Schizophrenia and Depression to Dr Salomon. Assistance from K. Maureen Shelton in preparation of early versions of this manuscript is appreciated. Comments from Dr. Ariel Deutch were helpful in an earlier version of the manuscript.
Appendix.
Fundamentals of Time Series Analyses
Terminology
Of many mathematical tools available (Glass and Kaplan, 1993) for dynamical (time series-related) data analyses, concepts pertinent to the slower rhythms will be emphasized here. Time series data require highly reliable metrics taken at precisely known time points, usually (but not necessarily) at fixed, invariant time intervals. The frequency (f), or rate of fluctuations in time, is the inverse of the period (= 1/f). The period is the time required to complete one cycle. Note that, both here and in the body of the paper, frequencies measured in cycles per second (s−1) are marked by the clinically familiar eponym, Hertz (Hz).
Biological clock activity is observable in the oscillations of subordinate systems using measures of amplitude (cycle intensity or amount), frequency and phase (time-axis relationships of peaks and valleys). Oscillatory amplitude is usually defined by peak-trough differences, often using one-half the difference between the acrophase (peak of the best-fitted sinusoidal curve) and the nadir (trough of the fitted curve). Phase describes temporal positions in a cycle, as in lunar phases. Jet lag is an example of a problem with shifting phase; the individual's acrophase no longer corresponds with timing of environmental cues and demands.
Chronobiologic rhythms are entrained by and are often named for astronomical events. Menstrual cycles are relatively fixed to the lunar cycle; neither menstrual cycle nor lunar cycle normally shows phase advances or delays. The benefit of 5HT reuptake inhibitor medications for late luteal mood disturbances (Halbreich and Smoller, 1997) suggests that 5HT function modulates these cycles considerably.
Circadian rhythms are endogenous, near 24-h cycles, close to the diurnal cycles that are governed by the earth's light-dark cycle. Circadian period lengths and phase shifts are influenced by internal clocks and may be also affected by environmental factors. The circadian rhythm, alongside other chronobiological rhythms, is important to mood. Sleep is often seen as phase-delayed especially in bipolar forms of depression, while antidepressant medications appear to advance sleep phases (Wirz-Justice 2003; 2008). This is consistent with an enhancement of ultradian rhythms which will improve the basis for the sleep rhythm onset. The circadian awake phase is readily phase-shifted by caffeine or melatonin (Arendt et al. 2009) without altering the overall fundamental cycle period length. Phase can also describe differences relative to a population norm, e.g., cognitive peak performance is phase-advanced in “early-birds” but it is phase-delayed in “night-owls” (e.g., Schmidt et al. 2012).
Prominent among faster, ultradian (< 18 h) rhythms, the basic rest-activity cycles (BRAC) of Kleitman (1967) and rapid eye movement (REM) cycles (Aserinsky and Kleitman 1953) generally have approximately 90 m periods and are again promptly shifted or suspended by caffeine. Depression alters ultradian rhythms of sleep, advancing the onset and diminishing the duration of REM phases of sleep that normally cycle approximately every 90-m (Goldenberg, 1993). Metabolic studies show that ultradian rhythms, measured as respiratory carbon dioxide output, are more robust and stable than circadian rhythms, remaining resistant to external factors (Stupfel et al., 1995).
Slower oscillations in central nervous system activity can be measured clinically. For example, ultradian subdural electroencephalography (EEG) cycles show surprisingly slow 50 s (0.02 Hz) periods (Bullock et al., 1995), but have not been studied in depression. Interestingly, these frequencies may be related to behavioral reinforcements (which are not solely dopaminergic) and also to perceptions of time; both are enhanced by 5HT agonists (Ho et al., 2002). Coordinating defective rhythms with the environmental light and other zeitgebers requires time to make adjustments. For example, ‘jet lag’ disrupts biological clock activity with a phase shift and requires a gradual phase adjustment over at least several days (Arendt, 2009). Adjustments in non-linear, cyclic phenomena in brain networks are relatively slow.
Sampling rates for commonly observable periods: Dynamic fluctuations in brain regional activity and behavior vary in intensity across a 2.5 million-fold range of frequencies from 0.0002 to 500 Hz (Kleitman 1961; 1982; Obrig et al., 2000; Buzsaki and Draguhn, 2004; Auer 2008). Human 5HT time series data have been acquired across millisecond, ultradian (< 18 h) and circadian (approximately 24 h) time scales. Sampling methods determine analytic opportunities and limitations. Sampling at evenly spaced intervals is highly advantageous but is not critical; in either case the intervals must be precisely recorded. The detectable rate of events in a time series is determined by sampling frequency: at a minimum, half the targeted (Nyquist) rate of events is required. For example, a 90 m cycle might be detectable (with luck) by sampling every 45 m. A sampling rate of 15 m would give the 90 m cycle relatively clearly, but would not reliably show whether the 90 m cycle is truly isolated from faster rhythms. Sampling at 10 m intervals provides minimal information on cycles as rapid as 20 m, relatively clear detection of 40 – 45 m cycles, and thorough characterizations of 90 m cycles. This example formed the basis for selecting CSF sampling rates for CSF studies described in this review.
Spectral Power
Information is carried as momentary changes in magnitude, or energy, in a signal. Global power of a time series can be estimated as the sum of the squares of each signal coefficient after the first order trend is removed, normalizing the signal around zero. Signals can carry multiple discrete sets of information in spectrally distributed frequencies. Power at single frequencies or within limited bands of frequencies can be called spectral power, e.g. band-pass filtered fMRI time series data from a resting subject.
Within-subjects comparisons for time series comparisons are useful to avoid effects of anatomical anomalies on laminar flow for CSF sampling, and to avoid inter-individual differences in hemodynamic response functions for regional blood oxygenation level dependent (BOLD) signals when measuring spectral power (see below). Generally, BOLD is not ideal for comparing non-quantitative signals between subjects, or for isolating mixed cellular contributions or co-localized tissue targets (Giardino et al 2007). Spectral power measures from resting scan data do not depend on individual responses or actions associated with a task or event. Both spectral power and functional connectivity give quantitative metrics without machine signal normalization because they depend on spectral features that can be managed in within-subject comparisons.
Spectral analysis
The strengths (amplitudes) of resonances in a signal reflect external and internal influences on an oscillator. When harmonic frequencies are observed, a driving process may be found at an interval determined by a common denominator of the harmonic set. Various spectral analysis methods explore frequency domain features and give information over a range of oscillatory rates.
Curve-fitting methods generally assume prior knowledge or a conjecture that estimates frequency or cycle period length, and allows a recognition of amplitudes, acme and nadir positions. Cosinor analysis, in which a cosine function is fitted to the data series (Lentz, 1990) is commonly used to inspect data sets for circadian rhythms. While the frequency, phase, and amplitude are easily described for simple periodic functions, more advanced analyses are useful for compound oscillators, where more than one rhythm may be superimposed.
Fourier analysis, named after its eighteenth century discoverer, ideally uses the sum of an infinite number of infinitely long sinusoids (or cosines) to represent the full frequency range of cyclic periodic functions present in a complex function. In reality, the “discrete” version of the transform is applied to experimental data, and uses a finite number of sinusoids with finite lengths and sampling intervals. Each is identified by its frequency, phase relative to the others, and magnitude (a reflection of amplitude). The periodogram axes display each magnitude coefficient on the y axis for the frequencies on the x axis, usually with slowest frequencies at the origin. A second y axis may be used to independently represent phase relative to the slowest frequency. For a simple oscillator, the coefficient with the greatest magnitude designates the dominant cycle frequency; while compound oscillators display peaks at a number of frequencies. An inverse transform can reconstruct the original complex curve from the coefficients almost perfectly. Replications of the original series are less perfect with smaller sets of sinusoids, but would theoretically be perfect if the series were truly infinite in length.
A series of periodograms, or spectrogram, can be created by transforming short windows of the time series data set in a sliding series, advancing the window forward in time incrementally. The periodograms are arranged in a 3-dimensional plot, representing time, frequency, and Fourier magnitude. It allows an appreciation of various oscillating components as they wax and wane over time. Phase is generally not presented in the spectrogram.
Periodograms and spectrograms are useful for time-patterned biological data (Yamamoto 1991, Diggle and al Wasel 1997). They have been used, for example, to show 5HT effects on neuronal discharge rates (Celada et al. 2008), on EEG oscillations (Kesic et al. 2011), and on monoamine metabolite level oscillations (Salomon et al. 2005). Fourier analysis has been applied to functional connectivity models (Lange and Zeger, 1997). The large number of coefficients generated by these analyses can be handled statistically using multivariate permutation testing (Blackford et al. 2009).
Frequency filters
Filters select parts of a signal by frequency or group of frequencies, which is often useful for isolations of individual contributions to the full signal. Biological activities often show a characteristic frequency, so that their time series signatures are often separable from sources of signal interference (e.g. from influences or noise external to the brain region). Globally, BOLD signals are weakened by noise from local susceptibility artifacts, motion, vascular, and respiratory effects (Biswal 1997, Obrig et al. 2000, Shmueli et al 2007, Windischberger et al 2002). White and non-white noise managements are critical for analyses using a general linear model (Nowak 1999, Smith et al 2007) but will have a smaller impact on non-linear analyses. Transfer entropy models of near infrared spectroscopy (NIRS) brainstem signal components show that systemic regulation of cardiovascular events (heart rate, blood pressure) accounted for less than half of the variance in low-frequency (<0.1 Hz) blood flow oscillations. This again suggests that most variability is mostly locally regulated and not solely caused by extrinsic (vascular) artifact (Katura et al 2006). Numerous methods for managing physiologic and other artifacts have been proposed, but none are standard (Harvey et al 2008, Glover et al 2000, Jones et al 2008, Deckers et al 2006, Barry et al. 2008, Kelley et al. 2008, Stroman et al 2008, Law et al 2008, Martuzzi et al 2008).
High- or low-pass filters divide components of a curve using chosen frequency cutoff; bandpass filters use both to isolate a narrow range of frequencies. A filter can use the Fourier transform by retaining only select frequency coefficients and then using the inverse transform to reconstruct the signal sequence, which will now omit undesired frequency components. Unfortunately, “quantization noise” artifacts from “side lobe” residuals in the Fourier filtering process may introduce additional noise. Another set of filtering techniques, finite impulse response (FIR) filters, can also achieve relatively sharp cutoff frequency definitions, but may leave slight “ripple” artifacts in the reconstructed signal that can affect correlations between segments used to analyze functional connectivity (see below).
Wavelet filtering
For correlations (e.g. functional connectivity) in imaging, an optimal filter defines frequency bands and isolates activities of interest from noise and artifacts from factors that contaminate the signal of interest, and does not introduce new artifacts. A relatively recently described variant of the Fourier sinusoid system, the discrete wavelet transform (Daubechies 1992) uses a selected single short, cycloid sequence, convolving it with equally short segments of the data series and repeating this along the entire length of the signal. In a greatly oversimplified view, each iteration of the transform emphasizes and extracts frequency components that resemble the periods in the wavelet. The entire procedure is repeated with dilated (stretched) versions of the wavelet to extract a range of frequency components across a series of time scales. Properties differ among many available wavelet sequences and transform procedures. Although the cutoff thresholds are relatively sloppy in comparison to the sharp definitions given by FIR filters, distortions of the signals and artifacts are negligible. Computational efficiency is also an advantage since, for purposes of the spectral power analyses and correlations discussed here, the inverse transform is not required.
Comparisons within- and between- time series signals
Initially, information about rhythms in a number sequence (measures of concentrations, intensities, others) is often obtained from the similarity of one part of a curve to another part of itself, called autocorrelation. Autocorrelation is a simple approach to determining degrees of self-similarity and potential periodic intervals found within a curve. Variance expresses the variability within one curve. Comparisons of the time series in one data set to another can be measured by covariance, i.e. the degree to which two curves vary synchronously. The correlation statistic is related to covariance, but provides only the ratio of variances between the two curves. Correlations may examine synchronous or lagged (e.g., one curve time-delayed relative to the other) comparisons. In cases where the variances of each curve are very dissimilar (their ratio is far from unity), the correlation may differ strongly from covariance.
Correlations between low-pass frequency-filtered (usually below 0.08 Hz, slower than 12.5 s cycles) fMRI signals from two regions assess their functional connectivity (Biswal et al. 1997, Lowe et al 1998, 2000, Rogers et al 2007, 2008, Greicius et al 2009, for review: Stevens 2009). Both event-related, periodically-stimulated data sets and resting state data can be analyzed as regional spectral densities with reliable, self-calibrating features (Marchini and Ripley 2000, Müller et al 2003, Duff et al 2008). Interregional correlation maps are highly conserved across individuals (Greicius et al 2009) but are sensitive to behavioral and sleep states within individuals (Marx et al 2004, McAvoy et al 2008, Bianciardi et al 2009).
In EEG analyses, spectral power metrics are used to isolate the strength of components within a specific frequency band, from signals representing multiple activities near the electrode site. Cordance in a specific frequency band is a somewhat complicated construct (Cook et al., 2009) that may be summarized as the degree of synchrony at a given frequency within a region: it is an index combining power as a normalized absolute measure with power that is normalized relative to other frequency bands. Dynamical complexity, in the instance cited in this review, refers to one particular aspect of time series analysis expressing entropy, a quantifiable reflection of information loss in a system.
Time series analysis methods can also detect feedback loops (Pigolotti et al. 2007). In biochemical processes, these analyses may further suggest multistability and bifurcations in addition to simpler oscillatory features (Leite and Wang 2010). Such methods have not yet, to our knowledge, been applied to analyses of data from serotonin measures.
Footnotes
Footnotes. None.
References
- Adell A, Bortolozzi A, Diaz-Mataix L, Santana N, Celada P, Artigas F. Serotonin interaction with other transmitter systems. In: Müller CP, Jacobs BL, editors. Handbook of Behavioral Neurobiology of Serotonin. London: Academic Press, Elsevier; 2010. [Google Scholar]
- Albrecht U. Circadian clocks in mood-related behaviors. Ann Med. 2010;42:241–251. doi: 10.3109/07853891003677432. [DOI] [PubMed] [Google Scholar]
- Allen JJ, McKnight KM, Moreno FA, Demaree HA, Delgado PL. Alteration of frontal EEG asymmetry during tryptophan depletion predicts future depression. J Affect Disord. 2009;115:189–195. doi: 10.1016/j.jad.2008.08.003. [DOI] [PMC free article] [PubMed] [Google Scholar]
- Allers KA, Sharp T. Neurochemical and anatomical identification of fast- and slow-firing neurones in the rat dorsal raphe nucleus using juxtacellular labelling methods in vivo. Neuroscience. 2003;122:193–204. doi: 10.1016/s0306-4522(03)00518-9. [DOI] [PubMed] [Google Scholar]
- Andersen E, Rigor B, Dafny N. Electrophysiological evidence of concurrent dorsal raphe input to caudate, septum, habenula, thalamus hippocampus, cerebellum and olfactory bulb. Int J Neurosci. 1983;18:107–115. doi: 10.3109/00207458308985884. [DOI] [PubMed] [Google Scholar]
- Andersen G, Ingeman-Nielsen M, Vestergaard K, Riis JO. Pathoanatomic correlation between poststroke pathological crying and damage to brain areas involved in serotonergic neurotransmission. Stroke. 1994;25:1050–1052. doi: 10.1161/01.str.25.5.1050. [DOI] [PubMed] [Google Scholar]
- Antonioli M, Rybka J, Carvalho LA. Neuroimmune endocrine effects of antidepressants. Neuropsychiatr Dis Treat. 2012;8:65–83. doi: 10.2147/NDT.S16409. [DOI] [PMC free article] [PubMed] [Google Scholar]
- Arango V, Underwood MD, Boldrini M, Tamir H, Kassir SA, Hsiung S, Chen JJ, Mann JJ. Serotonin 1A receptors, serotonin transporter binding and serotonin transporter mRNA expression in the brainstem of depressed suicide victims. Neuropsychopharmacology. 2001;25:892–903. doi: 10.1016/S0893-133X(01)00310-4. [DOI] [PubMed] [Google Scholar]
- Arendt J. Managing jet lag: Some of the problems and possible new solutions. Sleep Med Rev. 2009;13:249–256. doi: 10.1016/j.smrv.2008.07.011. [DOI] [PubMed] [Google Scholar]
- Armitage R, Hoffmann RF, Rush AJ. Biological rhythm disturbance in depression: temporal coherence of ultradian sleep EEG rhythms. Psychol Med. 1999;29:1435–48. doi: 10.1017/s0033291799001300. [DOI] [PubMed] [Google Scholar]
- Aserinsky E, Kleitman N. Regularly occurring periods of eye motility, and concomitant phenomena, during sleep. Science. 1953;118:273–274. doi: 10.1126/science.118.3062.273. [DOI] [PubMed] [Google Scholar]
- Aschoff J. Handbook of Behavioral Neurobiology. Vol. 4. Plenum; NY: 1981. A survey on biological rhythms; pp. 81–93. [Google Scholar]
- Aserinsky E, Kleitman N. Regularly occurring periods of eye motility, and concomitant phenomena, during sleep. Science. 1953;118(3062):273–4. doi: 10.1126/science.118.3062.273. [DOI] [PubMed] [Google Scholar]
- Auer DP. Spontaneous low-frequency blood oxygenation level-dependent fluctuations and functional connectivity analysis of the ‘resting’ brain. Mag Resonance Imaging. 2008;26:1055–1064. doi: 10.1016/j.mri.2008.05.008. [DOI] [PubMed] [Google Scholar]
- Azmitia EC, Whitaker-Azmitia PM. Awakening the sleeping giant: anatomy and plasticity of the brain serotonergic system. J Clin Psychiatry. 1991;52(4):16. [PubMed] [Google Scholar]
- Bach-Mizrachi H, Underwood MD, Kassir SA, Bakalian MJ, Sibille E, Tamir H, Mann JJ, Arango V. Neuronal tryptophan hydroxylase mRNA expression in the human dorsal and median raphe nuclei: major depression and suicide. Neuropsychopharmacology. 2006;31:814–824. doi: 10.1038/sj.npp.1300897. [DOI] [PubMed] [Google Scholar]
- Bach-Mizrachi H, Underwood MD, Tin A, Ellis SP, Mann JJ, Arango V. Elevated expression of tryptophan hydroxylase-2 mRNA at the neuronal level in the dorsal and median raphe nuclei of depressed suicides. Mol Psychiatry. 2008;13:507–513. doi: 10.1038/sj.mp.4002143. [DOI] [PMC free article] [PubMed] [Google Scholar]
- Baker KG, Halliday GM, Halasz P, Hornung JP, Geffen LB, Cotton RG, Törk I. Cytoarchitecture of serotonin-synthesizing neurons in the pontine tegmentum of the human brain. Synapse. 1991;7:301–320. doi: 10.1002/syn.890070407. [DOI] [PubMed] [Google Scholar]
- Baker KG, Halliday GM, Törk I. Cytoarchitecture of the human dorsal raphé nucleus. J Comp Neurol. 1990;301:147–161. doi: 10.1002/cne.903010202. [DOI] [PubMed] [Google Scholar]
- Baker KG, Halliday GM, Hornung JP, Geffen LB, Cotton RG, Törk I. Distribution, morphology and number of monoamine-synthesizing and substance P-containing neurons in the human dorsal raphe nucleus. Neuroscience. 1991;42:757–775. doi: 10.1016/0306-4522(91)90043-n. [DOI] [PubMed] [Google Scholar]
- Barber NI, Teicher MH, Baldessarini RJ. Effects of selective monoaminergic reuptake blockade on activity rhythms in developing rats. Psychopharmacology (Berl) 1989;97:343–348. doi: 10.1007/BF00439448. [DOI] [PubMed] [Google Scholar]
- Barry RL, Klassen LM, Williams JM, Menon RS. Hybrid two-dimensional navigator correction: a new technique to suppress respiratory-induced physiological noise in multi-shot echo-planar functional MRI. Neuroimage. 2008;39:1142–1150. doi: 10.1016/j.neuroimage.2007.09.060. [DOI] [PMC free article] [PubMed] [Google Scholar]
- Baskaran A, Milev R, McIntyre RS. The neurobiology of the EEG biomarker as a predictor of treatment response in depression. Neuropharmacology. 2012;63:507–513. doi: 10.1016/j.neuropharm.2012.04.021. [DOI] [PubMed] [Google Scholar]
- Bel N, Artigas F. Chronic treatment with fluvoxamine increases extracellular serotonin in frontal cortex but not in raphé nuclei. Synapse. 1993;15:243–245. doi: 10.1002/syn.890150310. [DOI] [PubMed] [Google Scholar]
- Benoit O, Royant-Parola S, Borbely AA, Tobler I, Widlöcher D. Circadian aspects of motor activity in depressed patients. Acta Psychiatr Belg. 1985;85:582–592. [PubMed] [Google Scholar]
- Bianciardi M, Fukunaga M, van Gelderen P, Horovitz SG, de Zwart JA, Duyn JH. Modulation of spontaneous fMRI activity in human visual cortex by behavioral state. Neuroimage. 2009;45:160–168. doi: 10.1016/j.neuroimage.2008.10.034. [DOI] [PMC free article] [PubMed] [Google Scholar]
- Biello SM. Circadian clock resetting in the mouse changes with age. Age (Dordr) 2009;31:293–303. doi: 10.1007/s11357-009-9102-7. [DOI] [PMC free article] [PubMed] [Google Scholar]
- Biswal BB, Yetkin FZ, Haughton VM, Hyde JS. Functional connectivity in the motor cortex of resting human brain using echo-planar MRI. Magn Res Med. 1995;34:537–541. doi: 10.1002/mrm.1910340409. [DOI] [PubMed] [Google Scholar]
- Biswal BB, Van Kylen J, Hyde JS. Simultaneous assessment of flow and BOLD signals in resting-state functional connectivity maps. NMR Biomed. 1997;10:165–170. doi: 10.1002/(sici)1099-1492(199706/08)10:4/5<165::aid-nbm454>3.0.co;2-7. [DOI] [PubMed] [Google Scholar]
- Blackford JU, Salomon RM, Waller NG. Detecting change in biological rhythms: a multivariate permutation test approach to Fourier-transformed data. Chronobiol Int. 2009;26:258–281. doi: 10.1080/07420520902772221. [DOI] [PMC free article] [PubMed] [Google Scholar]
- Blennow K, Wallin A, Gottfries CG, Månsson JE, Svennerholm L. Concentration gradients for monoamine metabolites in lumbar cerebrospinal fluid. J Neural Transm Park Dis Dement Sect. 1993;5:5–15. doi: 10.1007/BF02260910. [DOI] [PubMed] [Google Scholar]
- Blier P. Pharmacology of rapid-onset antidepressant treatment strategies. JClin Psychiatry. 2001;62(15):12–17. [PubMed] [Google Scholar]
- Blier P, de Montigny C, Chaput Y. Modifications of the serotonin system by antidepressant treatments: implications for the therapeutic response in major depression. J Clin Psychopharmacology. 1987;7(6 Suppl):24S–35S. [PubMed] [Google Scholar]
- Blumberg MS, Seelke AM, Lowen SB, Karlsson KA. Dynamics of sleep-wake cyclicity in developing rats. Proc Natl Acad Sci USA. 2005;102:14860–14864. doi: 10.1073/pnas.0506340102. [DOI] [PMC free article] [PubMed] [Google Scholar]
- Bullock TH, McClune MC, Achimowicz JZ, Iragui-Madoz VJ, Duckrow RB, Spencer SS. Temporal fluctuations in coherence of brain waves. Proc Natl Acad Sci USA. 1995;92:11568–11572. doi: 10.1073/pnas.92.25.11568. [DOI] [PMC free article] [PubMed] [Google Scholar]
- Bunney WE, Bunney BG. Molecular clock genes in man and lower animals: possible implications for circadian abnormalities in depression. Neuropsychopharmacology. 2000;22:335–345. doi: 10.1016/S0893-133X(99)00145-1. [DOI] [PubMed] [Google Scholar]
- Burlhis TM, Aghajanian GK. Pacemaker potentials of serotonergic dorsal raphé neurons: contribution of a low-threshold Ca2+ conductance. Synapse. 1987;1:582–8. doi: 10.1002/syn.890010611. [DOI] [PubMed] [Google Scholar]
- Buysse DJ, Jarrett DB, Miewald JM, Kupfer DJ, Greenhouse JB. Minute-by-minute analysis of REM sleep timing in major depression. Biol Psychiatry. 1990;28:911–925. doi: 10.1016/0006-3223(90)90571-i. [DOI] [PubMed] [Google Scholar]
- Buzsaki G. Rhythms of the Brain. Oxford: Oxford University Press; 2006. [Google Scholar]
- Buzsáki G, Draguhn A. Neuronal oscillations in cortical networks. Science. 2004;304:1926–1929. doi: 10.1126/science.1099745. [DOI] [PubMed] [Google Scholar]
- Cabral J, Hugues E, Sporns O, Deco G. Role of local network oscillations in resting-state functional connectivity. Neuroimage. 2011;57:130–139. doi: 10.1016/j.neuroimage.2011.04.010. [DOI] [PubMed] [Google Scholar]
- Caccia S, Anelli M, Codegoni AM, Fracasso C, Garattini S. The effects of single and repeated anorectic doses of 5-hydroxytryptamine uptake inhibitors on indole levels in rat brain. Br J Pharmacol. 1993;110:355–359. doi: 10.1111/j.1476-5381.1993.tb13817.x. [DOI] [PMC free article] [PubMed] [Google Scholar]
- Candito M, Pringuey D, Iordache A, Souêtre E, Chambon P, Darcourt G. Circadian variation in total plasma tryptophan. Antidepressant treatment: drugs and phase advance. Life Sci. 1992;50:PL71–74. doi: 10.1016/0024-3205(92)90178-r. [DOI] [PubMed] [Google Scholar]
- Candito M, Souêtre E, Iordache A, Pringuey D, Ardisson JL, Chambon P, Darcourt G. Diurnal variation in total plasma tryptophan in controls and in depression. J Psychiatr Res. 1990;24:227–230. doi: 10.1016/0022-3956(90)90012-f. [DOI] [PubMed] [Google Scholar]
- Carney RM, Blumenthal JA, Stein PK, Watkins L, Catellier D, Berkman LF, Czajkowski SM, O'Connor C, Stone PH, Freedland KE. Depression, heart rate variability, and acute myocardial infarction. Circulation. 2001;104:2024–8. doi: 10.1161/hc4201.097834. [DOI] [PubMed] [Google Scholar]
- Carter OL, Pettigrew JD, Hasler F, Wallis GM, Liu GB, Hell D, Vollenweider FX. Modulating the rate and rhythmicity of perceptual rivalry alternations with the mixed 5-HT2A and 5-HT1A agonist psilocybin. Neuropsychopharmacology. 2005;30:1154–1162. doi: 10.1038/sj.npp.1300621. [DOI] [PubMed] [Google Scholar]
- Carter OL, Hasler F, Pettigrew JD, Wallis GM, Liu GB, Vollenweider FX. Psilocybin links binocular rivalry switch rate to attention and subjective arousal levels in humans. Psychopharmacology (Berl) 2007;195:415–24. doi: 10.1007/s00213-007-0930-9. [DOI] [PubMed] [Google Scholar]
- Caspi A, Sugden K, Moffitt TE, Taylor A, Craig IW, Harrington H, McClay J, Mill J, Martin J, Braithwaite A, Poulton R. Influence of life stress on depression: moderation by a polymorphism in the 5-HTT gene. Science. 2003;301:386–389. doi: 10.1126/science.1083968. [DOI] [PubMed] [Google Scholar]
- Celada P, Puig MV, Casanovas JM, Guillazo G, Artigas F. Control of dorsal raphe serotonergic neurons by the medial prefrontal cortex: Involvement of serotonin-1A, GABA(A), and glutamate receptors. J Neurosci. 2001;21:9917–9929. doi: 10.1523/JNEUROSCI.21-24-09917.2001. [DOI] [PMC free article] [PubMed] [Google Scholar]
- Celada P, Puig MV, Díaz-Mataix L, Artigas F. The hallucinogen DOI reduces low-frequency oscillations in rat prefrontal cortex: reversal by antipsychotic drugs. Biol Psychiatry. 2008;64:392–400. doi: 10.1016/j.biopsych.2008.03.013. [DOI] [PubMed] [Google Scholar]
- Chapin EM, Andrade R. A 5-HT(7) receptor-mediated depolarization in the anterodorsal thalamus. I. Pharmacological characterization. J Pharmacol Exp Ther. 2007;297:395–402. [PubMed] [Google Scholar]
- Chialvo DR. Emergent complex neural dynamics. Nature Physics. 2010;6:744–750. [Google Scholar]
- Christmas DM, Potokar J, Davies SJ. A biological pathway linking inflammation and depression: activation of indoleamine 2,3-dioxygenase. Neuropsychiatr Dis Treat. 2011;7:431–439. doi: 10.2147/NDT.S17573. [DOI] [PMC free article] [PubMed] [Google Scholar]
- Ciarleglio CM, Resuehr HE, McMahon DG. Interactions of the serotonin and circadian systems: nature and nurture in rhythms and blues. Neuroscience. 2011;197:8–16. doi: 10.1016/j.neuroscience.2011.09.036. [DOI] [PubMed] [Google Scholar]
- Ciranna L. Serotonin as a modulator of glutamate- and GABA-mediated neurotransmission: Implications in physiological functions and in pathology. Curr Neuropharmacol. 2006;4:101–114. doi: 10.2174/157015906776359540. [DOI] [PMC free article] [PubMed] [Google Scholar]
- Conte S, Ferlazzo F, Renzi P. Ultradian rhythms of reaction times in performance in vigilance tasks. Biol Psychol. 1995;39:159–72. doi: 10.1016/0301-0511(94)00962-W. [DOI] [PubMed] [Google Scholar]
- Cook IA, Leuchter AF, Uijtdehaage SH, Osato S, Holschneider DH, Abrams M, Rosenberg-Thompson S. Altered cerebral energy utilization in late life depression. J Affective Disord. 1998;49:89–99. doi: 10.1016/s0165-0327(97)00192-4. [DOI] [PubMed] [Google Scholar]
- Cook IA, Hunter AM, Abrams M, Siegman B, Leuchter AF. Midline and right frontal brain function as a physiologic biomarker of remission in major depression. Psychiatry Res. 2009;174:152–157. doi: 10.1016/j.pscychresns.2009.04.011. [DOI] [PMC free article] [PubMed] [Google Scholar]
- Dam H, Mellerup ET, Rafaelsen OJ. Diurnal variation of total plasma tryptophan in depressive patients. Acta Psychiatr Scand. 1984;69:190–196. doi: 10.1111/j.1600-0447.1984.tb02486.x. [DOI] [PubMed] [Google Scholar]
- Datta S, Maclean RR. Neurobiological mechanisms for the regulation of mammalian sleep-wake behavior: reinterpretation of historical evidence and inclusion of contemporary cellular and molecular evidence. Neurosci Biobehav Rev. 2007;31:775–824. doi: 10.1016/j.neubiorev.2007.02.004. [DOI] [PMC free article] [PubMed] [Google Scholar]
- Daubechies I. Ten Lectures on Wavelets. SIAM; Philadelphia, PA: 1992. [Google Scholar]
- Deckers RH, van Gelderen P, Ries M, Barret O, Duyn JH, Ikonomidou VN, Fukunaga M, Glover GH, de Zwart JA. An adaptive filter for suppression of cardiac and respiratory noise in MRI time series data. Neuroimage. 2006;33:1072–1081. doi: 10.1016/j.neuroimage.2006.08.006. [DOI] [PMC free article] [PubMed] [Google Scholar]
- Delgado PL, Charney DS, Price LH, Aghajanian GK, Landis H, Heninger GR. Serotonin function and the mechanism of antidepressant action. Reversal of antidepressant-induced remission by rapid depletion of plasma tryptophan. Arch Gen Psychiatry. 1990;47:411–418. doi: 10.1001/archpsyc.1990.01810170011002. [DOI] [PubMed] [Google Scholar]
- Delgado PL, Miller HL, Salomon RM, Licinio J, Krystal JH, Moreno FA, Heninger GR, Charney DS. Tryptophan-depletion challenge in depressed patients treated with desipramine or fluoxetine: implications for the role of serotonin in the mechanism of antidepressant action. Biol Psychiatry. 1999;46:212–220. doi: 10.1016/s0006-3223(99)00014-1. [DOI] [PubMed] [Google Scholar]
- Delgado PL, Price LH, Miller HL, Salomon RM, Licinio J, Krystal JH, Heninger GR, Charney DS. Rapid serotonin depletion as a provocative challenge test for patients with major depression: relevance to antidepressant action and the neurobiology of depression. Psychopharmacol Bull. 1991;27:321–330. [PubMed] [Google Scholar]
- Di Giovanni G, Di Matteo V, La Grutta V, Esposito E. m-Chlorophenylpiperazine excites non-dopaminergic neurons in the rat substantia nigra and ventral tegmental area by activating serotonin-2C receptors. Neuroscience. 2001;103:111–116. doi: 10.1016/s0306-4522(00)00561-3. [DOI] [PubMed] [Google Scholar]
- Di Iorio CR, Watkins TJ, Dietrich MS, Cao A, Blackford JU, Rogers B, Ansari MS, Baldwin RM, Li R, Kessler RM, Salomon RM, Benningfield M, Cowan RL. Evidence for chronically altered serotonin function in the cerebral cortex of female 3,4-methylenedioxymethamphetamine polydrug users. Arch Gen Psychiatry. 2012;69:399–409. doi: 10.1001/archgenpsychiatry.2011.156. [DOI] [PMC free article] [PubMed] [Google Scholar]
- Diggle PJ, al Wasel I. Spectral analysis of replicated biomedical time series. Appl Statist. 1997;46:31–71. [Google Scholar]
- Drevets WC, Frank E, Price JC, Kupfer DJ, Holt D, Greer PJ, Huang Y, Gautier C, Mathis C. PET imaging of serotonin 1A receptor binding in depression. Biol Psychiatry. 1999;46:1375–1387. doi: 10.1016/s0006-3223(99)00189-4. [DOI] [PubMed] [Google Scholar]
- Duff EP, Johnston LA, Xiong J, Fox PT, Mareels I, Egan GF. The power of spectral density analysis for mapping endogenous BOLD signal fluctuations. Hum Brain Mapp. 2008;29:778–790. doi: 10.1002/hbm.20601. [DOI] [PMC free article] [PubMed] [Google Scholar]
- Engström G, Alling C, Blennow K, Regnéll G, Träskman-Bendz L. Reduced cerebrospinal HVA concentrations and HVA/5-HIAA ratios in suicide attempters. Monoamine metabolites in 120 suicide attempters and 47 controls. Eur Neuropsychopharmacol. 1999;9:399–405. doi: 10.1016/s0924-977x(99)00016-4. [DOI] [PubMed] [Google Scholar]
- Evans AK, Reinders N, Ashford KA, Christie IN, Wakerley JB, Lowry CA. Evidence for serotonin synthesis-dependent regulation of in vitro neuronal firing rates in the midbrain raphé complex. Eur J Pharm. 2008;590:136–149. doi: 10.1016/j.ejphar.2008.06.014. [DOI] [PubMed] [Google Scholar]
- Fox MD, Snyder A, Vincent J, Corbetta M, Van Essen D, Raichle M. The human brain is intrinsically organized into dynamic, anticorrelated functional networks. Proc Natl Acad Sci USA. 2005;102:9673–9678. doi: 10.1073/pnas.0504136102. [DOI] [PMC free article] [PubMed] [Google Scholar]
- Frank LR, Buxton RB, Wong EC. Estimation of respiration-induced noise fluctuations from undersampled multislice fMRI data. Magn Reson Med. 2001;45:635–644. doi: 10.1002/mrm.1086. [DOI] [PubMed] [Google Scholar]
- Gallager DW, Aghajanian GK. Effect of antipsychotic drugs on the firing of dorsal raphe cells. II. Reversal by picrotoxin. Eur J Pharmacol. 1976;39:357–364. doi: 10.1016/0014-2999(76)90145-x. [DOI] [PubMed] [Google Scholar]
- Gartside SE, Cole AJ, Williams AP, McQuade R, Judge SJ. AMPA and NMDA receptor regulation of firing activity in 5-HT neurons of the dorsal and median raphé nuclei. Eur J Neurosci. 2007;25:3001–3008. doi: 10.1111/j.1460-9568.2007.05577.x. [DOI] [PubMed] [Google Scholar]
- Gervais J, Rouillard C. Dorsal raphe stimulation differentially modulates dopaminergic neurons in the ventral tegmental area and substantia nigra. Synapse. 2000;35:281–291. doi: 10.1002/(SICI)1098-2396(20000315)35:4<281::AID-SYN6>3.0.CO;2-A. [DOI] [PubMed] [Google Scholar]
- Giardino ND, Friedman SD, Dager SR. Anxiety, respiration, and cerebral blood flow: implications for functional brain imaging. Compr Psychiatry. 2007;48:103–112. doi: 10.1016/j.comppsych.2006.11.001. [DOI] [PMC free article] [PubMed] [Google Scholar]
- Glover GH, Li TQ, Ress D. Image-based method for retrospective correction of physiological motion effects in fMRI: RETROICOR. Magn Reson Med. 2000;44:162–167. doi: 10.1002/1522-2594(200007)44:1<162::aid-mrm23>3.0.co;2-e. [DOI] [PubMed] [Google Scholar]
- Glass L, Kaplan D. Time series analysis of complex dynamics in physiology and medicine. Med Prog Technol. 1993;19:115–128. [PubMed] [Google Scholar]
- Goldenberg F. Le sommeil et les rythmes biologiques dans la dépression. Modifications induites par les antidépresseurs. [Sleep and biological rhythms in depression. Changes caused by antidepressants] Neurophysiol Clin. 1993;23:487–515. doi: 10.1016/s0987-7053(05)80141-8. [DOI] [PubMed] [Google Scholar]
- Gordon HW, Stoffer DS, Lee PA. Ultradian rhythms in performance on tests of specialized cognitive function. Int J Neurosci. 1995;83:199–211. doi: 10.3109/00207459508986339. [DOI] [PubMed] [Google Scholar]
- Greicius MD, Supekar K, Menon V, Dougherty RF. Resting-state functional connectivity reflects structural connectivity in the default mode network. Cereb Cortex. 2009;19:72–78. doi: 10.1093/cercor/bhn059. [DOI] [PMC free article] [PubMed] [Google Scholar]
- Gsell W, Burke M, Wiedermann D, Bonvento G, Silva AC, Dauphin F, Bührle C, Hoehn M, Schwindt W. Differential effects of NMDA and AMPA glutamate receptors on functional magnetic resonance imaging signals and evoked neuronal activity during forepaw stimulation of the rat. J Neurosci. 2006;26:8409–8416. doi: 10.1523/JNEUROSCI.4615-05.2006. [DOI] [PMC free article] [PubMed] [Google Scholar]
- Guiard BP, El Mansari M, Merali Z, Blier P. Functional interactions between dopamine, serotonin and norepinephrine neurons: an in-vivo electrophysiological study in rats with monoaminergic lesions. Int J Neuropsychopharmacol. 2008;11:625–639. doi: 10.1017/S1461145707008383. [DOI] [PubMed] [Google Scholar]
- Gusnard D, Raichle M. Searching for a baseline: functional imaging and the resting human brain. Nature Rev Neurosci. 2001;2:685–694. doi: 10.1038/35094500. [DOI] [PubMed] [Google Scholar]
- Halbreich U, Smoller JW. Intermittent luteal phase sertraline treatment of dysphoric premenstrual syndrome. J Clin Psychiatry. 1997;58:399–402. doi: 10.4088/jcp.v58n0905. [DOI] [PubMed] [Google Scholar]
- Hampp G, Albrecht U. The circadian clock and mood-related behavior. Commun Integr Biol. 2008;1:1–3. doi: 10.4161/cib.1.1.6286. [DOI] [PMC free article] [PubMed] [Google Scholar]
- Harvey AK, Pattinson KT, Brooks JC, Mayhew SD, Jenkinson M, Wise RG. Brainstem functional magnetic resonance imaging: disentangling signal from physiological noise. J Magn Reson Imaging. 2008;28:1337–1344. doi: 10.1002/jmri.21623. [DOI] [PubMed] [Google Scholar]
- Healy D. Rhythm and blues. Neurochemical, neuropharmacological andneuropsychological implications of a hypothesis of circadian rhythm dysfunction in the affective disorders. Psychopharmacology (Berl) 1987;93:271–285. doi: 10.1007/BF00187243. [DOI] [PubMed] [Google Scholar]
- Ho MY, Velázquez-Martínez DN, Bradshaw CM, Szabadi E. 5-Hydroxytryptamine and interval timing behaviour. Pharmacol Biochem Behav. 2002;71:773–785. doi: 10.1016/s0091-3057(01)00672-4. [DOI] [PubMed] [Google Scholar]
- Jang SW, Liu X, Pradoldej S, Tosini G, Chang Q, Iuvone PM, Ye K. N-acetylserotonin activates TrkB receptor in a circadian rhythm. Proc Natl Acad Sci USA. 2010;107:3876–3881. doi: 10.1073/pnas.0912531107. [DOI] [PMC free article] [PubMed] [Google Scholar]
- Jones TB, Bandettini PA, Birn RM. Integration of motion correction and physiological noise regression in fMRI. Neuroimage. 2008;42:582–590. doi: 10.1016/j.neuroimage.2008.05.019. [DOI] [PMC free article] [PubMed] [Google Scholar]
- Jouvet M. Behavioural and EEG effects of paradoxical sleep deprivation in the cat; Proceedings of The XXIIIrd International Congress of Physiological Sciences, Excerpta Medica International Congress Series No.87; Tokyo. 1965. [Google Scholar]
- Jouvet M. Sleep and serotonin: an unfinished story. Neuropsychopharmacology. 1999;21(2 Suppl):24S–27S. doi: 10.1016/S0893-133X(99)00009-3. [DOI] [PubMed] [Google Scholar]
- Kálmán J, Kálmán S. Depression as chronobiological illness. Neuropsychopharmacol Hung. 2009;11:69–81. [PubMed] [Google Scholar]
- Kang EH, Lee IS, Park JE, Kim KJ, Yu BH. Platelet serotonin transporter function and heart rate variability in patients with panic disorder. J Korean Med Sci. 2010;25:613–618. doi: 10.3346/jkms.2010.25.4.613. [DOI] [PMC free article] [PubMed] [Google Scholar]
- Karageorgiou J, Dietrich MS, Charboneau EJ, Woodward ND, Blackford JU, Salomon RM, Cowan RL. Prior MDMA (Ecstasy) use is associated with increased basal ganglia-thalamocortical circuit activation during motor task performance in humans: an fMRI study. Neuroimage. 2009;46:817–826. doi: 10.1016/j.neuroimage.2009.02.029. [DOI] [PMC free article] [PubMed] [Google Scholar]
- Katura T, Tanaka N, Obata A, Sato H, Maki A. Quantitative evaluation of interrelations between spontaneous low-frequency oscillations in cerebral hemodynamics and systemic cardiovascular dynamics. Neuroimage. 2006;31:1592–1600. doi: 10.1016/j.neuroimage.2006.02.010. [DOI] [PubMed] [Google Scholar]
- Kimura F, Kawakami M. Serum hormone levels during sleep and wakefulness in the immature female rat. Neuroendocrinology. 1981;33:276–283. doi: 10.1159/000123245. [DOI] [PubMed] [Google Scholar]
- Kelley DJ, Oakes TR, Greischar LL, Chung MK, Ollinger JM, Alexander AL, Shelton SE, Kalin NH, Davidson RJ. Automatic physiological waveform processing for FMRI noise correction and analysis. PLoS ONE. 2008;3:e1751. doi: 10.1371/journal.pone.0001751. [DOI] [PMC free article] [PubMed] [Google Scholar]
- Kennedy JS, Gwirtsman HE, Schmidt DE, Johnson BW, Fielstein E, Salomon RM, Shiavi RG, Ebert MH, Parris WC, Loosen PT. Serial cerebrospinal fluid tryptophan and 5-hydroxy indoleacetic acid concentrations in healthy human subjects. Life Sci. 2002;71:1703–1715. doi: 10.1016/s0024-3205(02)01899-4. [DOI] [PubMed] [Google Scholar]
- Kesic S, Kalauzi A, Radulovacki M, Carley DW, Saponjic J. Coupling changes in cortical and pontine sigma and theta frequency oscillations following monoaminergic lesions in rat. Sleep Breath. 2011;15:35–47. doi: 10.1007/s11325-010-0327-6. [DOI] [PubMed] [Google Scholar]
- Kleitman N. The nature of dreaming. In: Wolstenholme GEW, O'Connor M, editors. The Nature of Sleep. London: M. Churchill; 1961. pp. 349–364. [Google Scholar]
- Kleitman N. The basic rest--activity cycle and physiological correlates of dreaming. Exp Neurol Suppl. 1967;4:2–4. doi: 10.1016/0014-4886(67)90151-3. [DOI] [PubMed] [Google Scholar]
- Kleitman N. Basic rest–activity cycle – 22 years later. Sleep. 1982;5:311–317. doi: 10.1093/sleep/5.4.311. [DOI] [PubMed] [Google Scholar]
- Kramlinger KG, Post RM. Ultra-rapid and ultradian cycling in bipolar affective illness. Br J Psychiatry. 1996;168:314–23. doi: 10.1192/bjp.168.3.314. [DOI] [PubMed] [Google Scholar]
- Kunisato Y, Okamoto Y, Okada G, Aoyama S, Demoto Y, Munakata A, Nomura M, Onoda K, Yamawaki S. Modulation of default-mode network activity by acute tryptophan depletion is associated with mood change: a resting state functional magnetic resonance imaging study. Neurosci Res. 2011;69:129–134. doi: 10.1016/j.neures.2010.11.005. [DOI] [PubMed] [Google Scholar]
- Lange H. EEG spectral analysis in vital depression: ultradian cycles. Biol Psychiatry. 1982;17:3–21. [PubMed] [Google Scholar]
- Lange N, Zeger SL. Non-linear Fourier Time Series Analysis for Human Brain Mapping by Functional Magnetic Resonance Imaging. J Royal Statistical Society: Series C (Applied Statistics) 1997;46:1–29. [Google Scholar]
- Law CS, Liu C, Glover GH. Sliding-window sensitivity encoding (SENSE) calibration for reducing noise in functional MRI (fMRI) Magn Reson Med. 2008;60:1090–1103. doi: 10.1002/mrm.21701. [DOI] [PMC free article] [PubMed] [Google Scholar]
- Lazar SW, Bush G, Gollub RL, Fricchione GL, Khalsa G, Benson H. Functional brain mapping of the relaxation response and meditation. Neuroreport. 2000;11:1581–1585. [PubMed] [Google Scholar]
- Leander P, Vrang N, Møller M. Neuronal projections from the mesencephalic raphe nuclear complex to the suprachiasmatic nucleus and the deep pineal gland of the golden hamster (Mesocricetus auratus) J Comp Neurol. 1998;399:73–93. [PubMed] [Google Scholar]
- Lee TW, Yu YW, Hong CJ, Tsai SJ, Wu HC, Chen TJ. The influence of serotonin transporter polymorphisms on cortical activity: a resting EEG study. BMC Neurosci. 2011;12:33. doi: 10.1186/1471-2202-12-33. [DOI] [PMC free article] [PubMed] [Google Scholar]
- Leibowitz SF, Alexander JT. Hypothalamic serotonin in control of eating behavior, meal size, and body weight. Biol Psychiatry. 1998;44:851–64. doi: 10.1016/s0006-3223(98)00186-3. [DOI] [PubMed] [Google Scholar]
- Leibowitz SF, Shor-Posner G. Brain serotonin and eating behavior. Appetite. 1986;7 Suppl:1–14. doi: 10.1016/s0195-6663(86)80049-6. [DOI] [PubMed] [Google Scholar]
- Leite MC, Wang Y. Multistability, oscillations and bifurcations in feedback loops. Math Biosci Eng. 2010;7:83–97. doi: 10.3934/mbe.2010.7.83. [DOI] [PubMed] [Google Scholar]
- Lejeune F, Millan MJ. Pindolol excites dopaminergic and adrenergic neurons, and inhibits serotonergic neurons, by activation of 5-HT1A receptors. Eur J Neurosci. 2000;12:3265–3275. doi: 10.1046/j.1460-9568.2000.00222.x. [DOI] [PubMed] [Google Scholar]
- Lentz MJ. Time-series analysis--cosinor analysis: a special case. West J Nurs Res. 1990;12:408–412. doi: 10.1177/019394599001200313. [DOI] [PubMed] [Google Scholar]
- Leuchter AF, Cook IA, Marangell LB, Gilmer WS, Burgoyne KS, Howland RH, Trivedi MH, Zisook S, Jain R, McCracken JT, Fava M, Iosifescu D, Greenwald S. Comparative effectiveness of biomarkers and clinical indicators for predicting outcomes of SSRI treatment in Major Depressive Disorder: results of the BRITE-MD study. Psychiatry Research. 2009;169:124–131. doi: 10.1016/j.psychres.2009.06.004. [DOI] [PubMed] [Google Scholar]
- Lewy AJ. Circadian phase sleep and mood disorders. In: Davis KL, Charney D, Coyle JT, Nemeroff C, editors. Neuropsychopharmacology: The Fifth Generation of Progress. American College of Neuropsychopharmacology, Lipincott, Williams, & Wilkins; Philadelphia, Pennsylvania: 2002. Accessed online http://www.acnp.org/asset.axd?id=bf3b8435-d70a-47e2-8b10-cd3eaec2188d January 2013. [Google Scholar]
- Liu J, Chu YX, Zhang QJ, Wang S, Feng J, Li Q. 5,7-dihydroxytryptamine lesion of the dorsal raphe nucleus alters neuronal activity of the subthalamic nucleus in normal and 6-hydroxydopamine-lesioned rats. Brain Res. 2007;1149:216–222. doi: 10.1016/j.brainres.2007.02.052. [DOI] [PubMed] [Google Scholar]
- Liu R, Jolas T, Aghajanian G. Serotonin 5-HT(2) receptors activate local GABA inhibitory inputs to serotonergic neurons of the dorsal raphe nucleus. Brain Res. 2000;873:34–45. doi: 10.1016/s0006-8993(00)02468-9. [DOI] [PubMed] [Google Scholar]
- Llinás RR. The intrinsic electrophysiological properties of mammalian neurons: insights into central nervous system function. Science. 1988;242(4886):1654–64. doi: 10.1126/science.3059497. [DOI] [PubMed] [Google Scholar]
- Llinás RR, Ribary U, Jeanmonod D, Kronberg E, Mitra PP. Thalamocortical dysrhythmia: A neurological and neuropsychiatric syndrome characterized by magnetoencephalography. Proc Natl Acad Sci USA. 1999;96:15222–15227. doi: 10.1073/pnas.96.26.15222. [DOI] [PMC free article] [PubMed] [Google Scholar]
- Lowe MJ, Mock BJ, Sorenson JA. Functional connectivity in single and multislice echoplanar imaging using resting-state fluctuations. Neuroimage. 1998;7:119–132. doi: 10.1006/nimg.1997.0315. [DOI] [PubMed] [Google Scholar]
- Lowe MJ, Dzemidzic M, Lurito JT, Mathews VP, Phillips MD. Correlations in low-frequency BOLD fluctuations reflect cortico-cortical connections. Neuroimage. 2000;12:582–587. doi: 10.1006/nimg.2000.0654. [DOI] [PubMed] [Google Scholar]
- Lydic R, McCarley RW, Hobson JA. Forced activity alters sleep cycle periodicity and dorsal raphe discharge rhythm. Am J Physiol Regulatory Integrative Comp Physiol R. 1984;247(1 Pt 2):R135–145. doi: 10.1152/ajpregu.1984.247.1.R135. [DOI] [PubMed] [Google Scholar]
- Maes M, Meltzer HY. The serotonin hypothesis of major depression. In: Bloom FE, Kupfer DJ, editors. Psychopharmacology: The Fourth Generation of Progress. New York: Raven Press; 1995. pp. 933–944. [Google Scholar]
- Mandell AJ, Selz KA. Entropy conservation as hTμ ≈ λμ+dμ in neurobiological dynamical systems. Chaos. 1997;7:67–81. doi: 10.1063/1.166241. [DOI] [PubMed] [Google Scholar]
- Marchini JL, Ripley BD. A new statistical approach to detecting significant activation in functional MRI. Neuroimage. 2000;12:366–380. doi: 10.1006/nimg.2000.0628. [DOI] [PubMed] [Google Scholar]
- Marek GJ, Wright RA, Gewirtz JC, Schoepp DD. A major role for thalamocortical afferents in serotonergic hallucinogen receptor function in the rat neocortex. Neuroscience. 2001;105:379–392. doi: 10.1016/s0306-4522(01)00199-3. [DOI] [PubMed] [Google Scholar]
- Martuzzi R, Murray MM, Meuli RA, Thiran JP, Maeder PP, Michel CM, Grave de Peralta Menendez R, Gonzalez Andino S. Methods for determining frequency- and region- dependant relationships between estimated LFPs and BOLD responses in humans. J Neurophysiol. 2008;101:491–502. doi: 10.1152/jn.90335.2008. [DOI] [PubMed] [Google Scholar]
- Marx E, Deutschländer A, Stephan T, Dieterich M, Wiesmann M, Brandt T. Eyes open and eyes closed as rest conditions: impact on brain activation patterns. Neuroimage. 2004;21:1818–1824. doi: 10.1016/j.neuroimage.2003.12.026. [DOI] [PubMed] [Google Scholar]
- Mason P, Gao K, Genzen JR. Serotonergic raphe magnus cell discharge reflects ongoing autonomic and respiratory activities. J Neurophysiol. 2007;98:1919–1927. doi: 10.1152/jn.00813.2007. [DOI] [PMC free article] [PubMed] [Google Scholar]
- Mayberg HS, Brannan SK, Mahurin RK, Jerabek PA, Brickman JS, Tekell JL, Silva JA, McGinnis S, Glass TG, Martin CC, Fox PT. Cingulate function in depression: a potential predictor of treatment response. Neuroreport. 1997;8:1057–1061. doi: 10.1097/00001756-199703030-00048. [DOI] [PubMed] [Google Scholar]
- McAvoy M, Larson-Prior L, Nolan TS, Vaishnavi SN, Raichle ME, d'Avossa G. Resting states affect spontaneous BOLD oscillations in sensory and paralimbic cortex. J Neurophysiol. 2008;100:922–931. doi: 10.1152/jn.90426.2008. [DOI] [PMC free article] [PubMed] [Google Scholar]
- McCobb DP, Haydon PG, Kater SB. Dopamine and serotonin inhibition of neurite elongation of different identified neurons. J Neurosci Res. 1988;19:19–26. doi: 10.1002/jnr.490190104. [DOI] [PubMed] [Google Scholar]
- McCormick DA. Neurotransmitter actions in the thalamus and cerebral cortex and their role in neuromodulation of thalamocortical activity. Prog Neurobiol. 1992;39:337–388. doi: 10.1016/0301-0082(92)90012-4. [DOI] [PubMed] [Google Scholar]
- Mendlewicz J. Disruption of the circadian timing systems: molecular mechanisms in mood disorders. CNS Drugs. 2009;23(2):15–26. doi: 10.2165/11318630-000000000-00000. [DOI] [PubMed] [Google Scholar]
- Meyer JH. Imaging the serotonin transporter during major depressive disorder and antidepressant treatment. J Psychiatry Neurosci. 2007;32:86–102. [PMC free article] [PubMed] [Google Scholar]
- Meyer-Bernstein EL, Morin LP. Electrical stimulation of the median or dorsal raphe nuclei reduces light-induced FOS protein in the suprachiasmatic nucleus and causes circadian activity rhythm phase shifts. Neurosci. 1999;92:267–279. doi: 10.1016/s0306-4522(98)00733-7. [DOI] [PubMed] [Google Scholar]
- Miller HL, Delgado PL, Salomon RM, Licinio J, Barr LC, Charney DS. Acute tryptophan depletion: a method of studying antidepressant action. J Clin Psychiatry. 1992;53 Suppl:28–35. [PubMed] [Google Scholar]
- Miyamoto H, Nakamaru-Ogiso E, Hamada K, Hensch TK. Serotonergic integration of circadian clock and ultradian sleep-wake cycles. J Neurosci. 2012;32:14794–14803. doi: 10.1523/JNEUROSCI.0793-12.2012. [DOI] [PMC free article] [PubMed] [Google Scholar]
- Mizuno A, Villalobos ME, Davies MM, Dahl BC, Müller RA. Partially enhanced thalamocortical functional connectivity in autism. Brain Res. 2006;1104:160–174. doi: 10.1016/j.brainres.2006.05.064. [DOI] [PubMed] [Google Scholar]
- Moreno FA, Gelenberg AJ, Heninger GR, Potter RL, McKnight KM, Allen J, Phillips AP, Delgado PL. Tryptophan depletion and depressive vulnerability. Biol Psychiatry. 1999;46:498–505. doi: 10.1016/s0006-3223(99)00095-5. [DOI] [PubMed] [Google Scholar]
- Moreno FA, Parkinson D, Palmer C, Castro WL, Misiaszek J, El Khoury A, Mathé AA, Wright R, Delgado PL. CSF neurochemicals during tryptophan depletion in individuals with remitted depression and healthy controls. Eur Neuropsychopharmacol. 2010;20:18–24. doi: 10.1016/j.euroneuro.2009.10.003. [DOI] [PMC free article] [PubMed] [Google Scholar]
- Morris JS, Smith KA, Cowen PJ, Friston KJ, Dolan RJ. Covariation of activity in habenula and dorsal raphé nuclei following tryptophan depletion. Neuroimage. 1999;10:163–172. doi: 10.1006/nimg.1999.0455. [DOI] [PubMed] [Google Scholar]
- Müller K, Mildner T, Lohmann G, von Cramon DY. Investigating the stimulus-dependent temporal dynamics of the BOLD signal using spectral methods. J Magn Reson Imaging. 2003;17:375–382. doi: 10.1002/jmri.10268. [DOI] [PubMed] [Google Scholar]
- Mushiake H, Kodama T, Shima K, Yamamoto M, Nakahama H. Fluctuations in spontaneous discharge of hippocampal theta cells during sleep-waking states and PCPA-induced insomnia. J Neurophysiol. 1988;60:925–939. doi: 10.1152/jn.1988.60.3.925. [DOI] [PubMed] [Google Scholar]
- Nagayama H. Influences of biological rhythms on the effects of psychotropic drugs. Psychosom Med. 1999;61(5):618–29. doi: 10.1097/00006842-199909000-00006. [DOI] [PubMed] [Google Scholar]
- Napadow V, Dhond RP, Purdon P, Kettner N, Makris N, Kwong KK, Hui KK. Correlating acupuncture FMRI in the human brainstem with heart rate variability. Conf Proc IEEE Eng Med Biol Soc. 2005;5:4496–4499. doi: 10.1109/IEMBS.2005.1615466. [DOI] [PubMed] [Google Scholar]
- Napadow V, Dhond R, Park K, Kim J, Makris N, Kwong KK, Harris RE, Purdon PL, Kettner N, Hui KK. Time-variant fMRI activity in the brainstem and higher structures in response to acupuncture. Neuroimage. 2009;47:289–301. doi: 10.1016/j.neuroimage.2009.03.060. [DOI] [PMC free article] [PubMed] [Google Scholar]
- Nguyen KQ, Tohyama Y, Watanabe A, Hasegawa S, Skelin I, Diksic M. Acute effects of combining citalopram and pindolol on regional brain serotonin synthesis in sham operated and olfactory bulbectomized rats. Neurochem Int. 2009;54:161–171. doi: 10.1016/j.neuint.2008.08.012. [DOI] [PMC free article] [PubMed] [Google Scholar]
- Novák B, Tyson JJ. Design principles of biochemical oscillators. Nat Rev Mol Cell Biol. 2008;9:981–991. doi: 10.1038/nrm2530. [DOI] [PMC free article] [PubMed] [Google Scholar]
- Nowak RD. Wavelet-based Rician noise removal for magnetic resonance imaging. IEEE Trans Image Process. 1999;8:1408–1419. doi: 10.1109/83.791966. [DOI] [PubMed] [Google Scholar]
- Obrig H, Neufang M, Wenzel R, Kohl M, Steinbrink J, Einhäupl K, Villringer A. Spontaneous low frequency oscillations of cerebral hemodynamics and metabolism in human adults. Neuroimage. 2000;12:623–639. doi: 10.1006/nimg.2000.0657. [DOI] [PubMed] [Google Scholar]
- Papp A, Juranyi Z, Nagymajtenyi L, Matyus P, Harsing LG., Jr The synaptic and nonsynaptic glycine transporter type-1 inhibitors Org-24461 and NFPS alter single neuron firing rate in the rat dorsal raphe nucleus. Further evidence for a glutamatergic-serotonergic interaction and its role in antipsychotic action. Neurochem Int. 2008;52:130–134. doi: 10.1016/j.neuint.2007.06.030. [DOI] [PubMed] [Google Scholar]
- Pattinson KT, Mitsis GD, Harvey AK, Jbabdi S, Dirckx S, Mayhew SD, Rogers R, Tracey I, Wise RG. Determination of the human brainstem respiratory control network and its cortical connections in vivo using functional and structural imaging. Neuroimage. 2009;44:295–305. doi: 10.1016/j.neuroimage.2008.09.007. [DOI] [PubMed] [Google Scholar]
- Paus T, Tomaiuolo F, Otaky N, MacDonald D, Petrides M, Atlas J, Morris R, Evans AC. Human cingulate and paracingulate sulci: pattern, variability, asymmetry, and probabilistic map. Cereb Cortex. 1996;6:207–214. doi: 10.1093/cercor/6.2.207. [DOI] [PubMed] [Google Scholar]
- Paxinos G, Watson C. The Rat Brain in Stereotaxic Coordinates. New York: Elsevier Academic Press; 2005. [Google Scholar]
- Pettigrew JD, Miller SM. A ‘sticky’ interhemispheric switch in bipolar disorder? Proc Biol Sci. 1998;265:2141–2148. doi: 10.1098/rspb.1998.0551. [DOI] [PMC free article] [PubMed] [Google Scholar]
- Pezard L, Nandrino JL, Renault B, el Massioui F, Allilaire JF, Müller J, Varela F, Martinerie J. Depression as a dynamical disease. Biol Psychiatry. 1996;39:991–9. doi: 10.1016/0006-3223(95)00307-x. [DOI] [PubMed] [Google Scholar]
- Pigolotti S, Krishna S, Jensen MH. Oscillation patterns in negative feedback. PNAS (USA) 2007;104:8533–8537. doi: 10.1073/pnas.0610759104. [DOI] [PMC free article] [PubMed] [Google Scholar]
- Piñeyro G, Blier P. Autoregulation of serotonin neurons: role in antidepressant drug action. Pharmacol Rev. 1999;51:533–591. [PubMed] [Google Scholar]
- Potter WZ, Scheinin M, Golden RN, Rudorfer MV, Cowdry RW, Calil HM, Ross RJ, Linnoila M. Selective antidepressants and cerebrospinal fluid. Lack of specificity on norepinephrine and serotonin metabolites. Arch Gen Psychiatry. 1985;42:1171–1177. doi: 10.1001/archpsyc.1985.01790350045009. [DOI] [PubMed] [Google Scholar]
- Praschak-Rieder N, Willeit M, Wilson AA, Houle S, Meyer JH. Seasonal variation in human brain serotonin transporter binding. Arch Gen Psychiatry. 2008;65:1072–1078. doi: 10.1001/archpsyc.65.9.1072. [DOI] [PubMed] [Google Scholar]
- Price JL, Drevets WC. Neurocircuitry of mood disorders. Neuropsychopharmacology. 2010;35:192–216. doi: 10.1038/npp.2009.104. [DOI] [PMC free article] [PubMed] [Google Scholar]
- Quilichini PP, Bernard C. Brain state-dependent neuronal computation. Frontiers in Computational Neuroscience. 2012;6:77. doi: 10.3389/fncom.2012.00077. [DOI] [PMC free article] [PubMed] [Google Scholar]
- Rogers BP, Morgan VL, Newton AT, Gore JC. Assessing functional connectivity in the human brain by fMRI. Magn Reson Imaging. 2007;25:1347–1357. doi: 10.1016/j.mri.2007.03.007. [DOI] [PMC free article] [PubMed] [Google Scholar]
- Rogers BP, Gore JC. Empirical comparison of sources of variation for FMRI connectivity analysis. PLoS ONE. 2008;3:e3708. doi: 10.1371/journal.pone.0003708. [DOI] [PMC free article] [PubMed] [Google Scholar]
- Roth GI, Walton PL, Yamamoto WS. Area Postrema: Abrupt EEG synchronization following close intra-arterial perfusion with serotonin. Brain Res. 1970;23:223–233. doi: 10.1016/0006-8993(70)90041-7. [DOI] [PubMed] [Google Scholar]
- Salomon RM, Cowan RL, Rogers BP, Dietrich MS, Bauernfeind AL, Kessler RM, Gore JC. Time series fMRI measures detect changes in pontine raphé following acute tryptophan depletion. Psychiatry Res. 2011a;191:112–121. doi: 10.1016/j.pscychresns.2010.10.007. [DOI] [PMC free article] [PubMed] [Google Scholar]
- Salomon RM, Karageorgiou J, Dietrich MS, McLellan JY, Charboneau EJ, Blackford JU, Cowan RL. MDMA (Ecstasy) association with impaired fMRI BOLD thalamic coherence and functional connectivity. Drug Alcohol Depend. 2012b;120:41–47. doi: 10.1016/j.drugalcdep.2011.06.022. [DOI] [PMC free article] [PubMed] [Google Scholar]
- Salomon RM, Kennedy JS, Johnson BW, Schmidt DE, Kwentus J, Gwirtsman HE, Ebert MH. Association of a critical CSF tryptophan threshold level with depressive relapse. Neuropsychopharmacology. 2003a;28:956–960. doi: 10.1038/sj.npp.1300098. [DOI] [PubMed] [Google Scholar]
- Salomon RM, Kennedy JS, Johnson BW, Urbano Blackford J, Schmidt DE, Kwentus J, Gwirtsman HE, Gouda JF, Shiavi RG. Treatment enhances ultradian rhythms of CSF monoamine metabolites in patients with major depressive episodes. Neuropsychopharmacology. 2005;30:2082–2091. doi: 10.1038/sj.npp.1300746. [DOI] [PubMed] [Google Scholar]
- Salomon RM, Johnson BW, Schmidt DE. Central neurochemical ultradian variability in depression. Dis Markers. 2006;22:65–72. doi: 10.1155/2006/240980. [DOI] [PMC free article] [PubMed] [Google Scholar]
- Salomon RM, McLellan JY, Shelton KM, Dietrich MS, Rogers B, Cowan RL. Raphé Functional Connectivity in Depression (meeting abstract) Biol Psychiatry. 2012a;71:211S–212S. [Google Scholar]
- Salomon RM, Miller HL, Delgado PL, Charney D. The use of tryptophan depletion to evaluate central serotonin function in depression and other neuropsychiatric disorders. Int Clin Psychopharmacol. 1993;8(2):41–46. doi: 10.1097/00004850-199311002-00006. [DOI] [PubMed] [Google Scholar]
- Salvador R, Martínez A, Pomarol-Clotet E, Gomar J, Vila F, Sarró S, Capdevila A, Bullmore E. A simple view of the brain through a frequency-specific functional connectivity measure. Neuroimage. 2008;39:279–289. doi: 10.1016/j.neuroimage.2007.08.018. [DOI] [PubMed] [Google Scholar]
- Schmidt C, Peigneux P, Leclercq Y, Sterpenich V, Vandewalle G, Phillips C, Berthomier P, Berthomier C, Tinguely G, Gais S, Schabus M, Desseilles M, Dang-Vu T, Salmon E, Degueldre C, Balteau E, Luxen A, Cajochen C, Maquet P, Collette F. Circadian preference modulates the neural substrate of conflict processing across the day. PLoS One. 2012;7:e29658. doi: 10.1371/journal.pone.0029658. [DOI] [PMC free article] [PubMed] [Google Scholar]
- Schweimer JV, Mallet N, Sharp T, Ungless MA. Spike-timing relationship of neurochemically-identified dorsal raphe neurons during cortical slow oscillations. Neuroscience. 2011;196:115–123. doi: 10.1016/j.neuroscience.2011.08.072. [DOI] [PMC free article] [PubMed] [Google Scholar]
- Selvaraj S, Venkatesha Murthy N, Bhagwagar Z, Bose SK, Hinz R, Grasby PM, Cowen PJ. Diminished brain 5-HT transporter binding in major depression: a positron emission tomography study with [(11)C]DASB. Psychopharmacology (Berl) 2009;213:555–562. doi: 10.1007/s00213-009-1660-y. [DOI] [PubMed] [Google Scholar]
- Shmueli K, van Gelderen P, de Zwart JA, Horovitz SG, Fukunaga M, Jansma JM, Duyn JH. Low-frequency fluctuations in the cardiac rate as a source of variance in the resting-state fMRI BOLD signal. Neuroimage. 2007;38:306–320. doi: 10.1016/j.neuroimage.2007.07.037. [DOI] [PMC free article] [PubMed] [Google Scholar]
- Smith AT, Singh KD, Balsters JH. A comment on the severity of the effects of non-white noise in fMRI time-series. Neuroimage. 2007;36:282–288. doi: 10.1016/j.neuroimage.2006.09.044. [DOI] [PubMed] [Google Scholar]
- Sprouse JS, Aghajanian GK. Electrophysiological responses of serotoninergic dorsal raphe neurons to 5-HT1A and 5-HT1B agonists. Synapse. 1987;1:582–588. doi: 10.1002/syn.890010103. [DOI] [PubMed] [Google Scholar]
- Son YD, Cho ZH, Kim HK, Choi EJ, Lee SY, Chi JG, Park CW, Kim YB. Glucose metabolism of the midline nuclei raphe in the brainstem observed by PET-MRI fusion imaging. Neuroimage. 2012;59:1094–1097. doi: 10.1016/j.neuroimage.2011.09.036. [DOI] [PubMed] [Google Scholar]
- Souêtre E, Salvati E, Belugou JL, Pringuey D, Candito M, Krebs B, Ardisson JL, Darcourt G. Circadian rhythms in depression and recovery: evidence for blunted amplitude as the main chronobiological abnormality. Psychiatry Res. 1989;28:263–278. doi: 10.1016/0165-1781(89)90207-2. [DOI] [PubMed] [Google Scholar]
- Stamford JA, Davidson C, McLaughlin DP, Hopwood SE. Control of dorsal raphé 5-HT function by multiple 5-HT(1) autoreceptors: parallel purposes or pointless plurality? Trends Neurosci. 2000;23:459–465. doi: 10.1016/s0166-2236(00)01631-3. [DOI] [PubMed] [Google Scholar]
- Stanley BG, Schwartz DH, Hernandez L, Leibowitz SF, Hoebel BG. Patterns of extracellular 5-hydroxyindoleacetic acid (5-HIAA) in the paraventricular hypothalamus (PVN): relation to circadian rhythm and deprivation-induced eating behavior. Pharmacol Biochem Behav. 1989;33:257–60. doi: 10.1016/0091-3057(89)90459-0. [DOI] [PubMed] [Google Scholar]
- Steriade M. Brainstem activation of thalamocortical systems. Brain Res Bull. 1999;50:391–392. doi: 10.1016/s0361-9230(99)00119-7. [DOI] [PubMed] [Google Scholar]
- Stevens MC. The developmental cognitive neuroscience of functional connectivity. Brain Cogn. 2009;70:1–12. doi: 10.1016/j.bandc.2008.12.009. [DOI] [PubMed] [Google Scholar]
- Stroman PW, Figley CR, Cahill CM. Spatial normalization, bulk motion correction and coregistration for functional magnetic resonance imaging of the human cervical spinal cord and brainstem. Magn Reson Imaging. 2008;26:809–814. doi: 10.1016/j.mri.2008.01.038. [DOI] [PubMed] [Google Scholar]
- Stupfel M, Pavely A. Ultradian, circahoral and circadian structures in endothermic vertebrates and humans. Comp Biochem Physiol A Comp Physiol. 1990;96:1–11. doi: 10.1016/0300-9629(90)90034-p. [DOI] [PubMed] [Google Scholar]
- Stupfel M, Gourlet V, Perramon A, Mérat P, Putet G, Court L. Comparison of ultradian and circadian oscillations of carbon dioxide production by various endotherms. Am J Physiol. 1995;268(1 Pt 2):R253–65. doi: 10.1152/ajpregu.1995.268.1.R253. [DOI] [PubMed] [Google Scholar]
- Supprian T, Reiche W, Schmitz B, Grunwald I, Backens M, Hofmann E, Georg T, Falkai P, Reith W. MRI of the brainstem in patients with major depression, bipolar affective disorder and normal controls. Psychiatry Res. 2004;131:269–276. doi: 10.1016/j.pscychresns.2004.02.005. [DOI] [PubMed] [Google Scholar]
- Tao R, Auerbach SB. Regulation of serotonin release by GABA and excitatory amino acids. J Psychopharmacol. 2000;14:100–113. doi: 10.1177/026988110001400201. [DOI] [PubMed] [Google Scholar]
- Trivedi MH, Rush AJ, Wisniewski SR, Nierenberg AA, Warden D, Ritz L, Norquist G, Howland RH, Lebowitz B, McGrath PJ, Shores-Wilson K, Biggs MM, Balasubramani GK, Fava M. STAR*D Study Team. Evaluation of outcomes with citalopram for depression using measurement-based care in STAR*D: implications for clinical practice. Am J Psychiatry. 2006;163:28–40. doi: 10.1176/appi.ajp.163.1.28. [DOI] [PubMed] [Google Scholar]
- Tsai TY, Choi YS, Ma W, Pomerening JR, Tang C, Ferrell JE., Jr Robust, tunable biological oscillations from interlinked positive and negative feedback loops. Science. 2008;321:126–129. doi: 10.1126/science.1156951. [DOI] [PMC free article] [PubMed] [Google Scholar]
- Villalobos ME, Mizuno A, Dahl BC, Kemmotsu N, Müller RA. Reduced functional connectivity between V1 and inferior frontal cortex associated with visuomotor performance in autism. Neuroimage. 2005;25:916–925. doi: 10.1016/j.neuroimage.2004.12.022. [DOI] [PMC free article] [PubMed] [Google Scholar]
- van Esseveldt KE, Lehman MN, Boer GJ. The suprachiasmatic nucleus and the circadian time-keeping system revisited. Brain Res Brain Res Rev. 2000;33:34–77. doi: 10.1016/s0165-0173(00)00025-4. [DOI] [PubMed] [Google Scholar]
- Vandermaelen CP, Aghajanian GK. Electrophysiological and pharmacological characterization of serotonergic dorsal raphe neurons recorded extracellularly and intracellularly in rat brain slices. Brain Res. 1983;289:109–119. doi: 10.1016/0006-8993(83)90011-2. [DOI] [PubMed] [Google Scholar]
- Vanderwolf CH, Baker GB. Evidence that Serotonin Mediates Non-Cholinergic Neocortical Low Voltage Fast Activity, Non-Cholinergic Hippocampal Rhythmical Slow Activity and Contributes to Intelligent Behavior. Brain Res. 1986;374:342–356. doi: 10.1016/0006-8993(86)90428-2. [DOI] [PubMed] [Google Scholar]
- Vanderwolf CH. The electrocorticogram in relation to physiology and behavior: a new analysis. Electroencephalogr Clin Neurophysiol. 1992;82:165–75. doi: 10.1016/0013-4694(92)90164-d. [DOI] [PubMed] [Google Scholar]
- Varnäs K, Halldin C, Hall H. Autoradiographic distribution of serotonin transporters and receptor subtypes in human brain. Hum Brain Mapp. 2004;22:246–260. doi: 10.1002/hbm.20035. [DOI] [PMC free article] [PubMed] [Google Scholar]
- Wang S, Pogue R, Morré DM, Morré DJ. NADH oxidase activity (NOX) and enlargement of HeLa cells oscillate with two different temperature-compensated period lengths of 22 and 24 minutes corresponding to different NOX forms. Biochim Biophys Acta. 2001;1539:192–204. doi: 10.1016/s0167-4889(01)00107-0. [DOI] [PubMed] [Google Scholar]
- Warden MR, Selimbeyoglu A, Mirzabekov JJ, Lo M, Thompson KR, Kim SY, Adhikari A, Tye KM, Frank LM, Deisseroth K. A prefrontal cortex-brainstem neuronal projection that controls response to behavioural challenge. Nature. 2012 doi: 10.1038/nature11617. online 2012 Nov 18. [DOI] [PMC free article] [PubMed] [Google Scholar]
- Waselus M, Valentino RJ, Van Bockstaele EJ. Collateralized dorsal raphé nucleus projections: a mechanism for the integration of diverse functions during stress. J Chem Neuroanat. 2011;41:266–280. doi: 10.1016/j.jchemneu.2011.05.011. [DOI] [PMC free article] [PubMed] [Google Scholar]
- Waterhouse J, Minors D, Atkinson G, Benton D. Chronobiology and meal times: internal and external factors. Br J Nutr. 1997;77(1):S29–38. doi: 10.1079/bjn19970102. [DOI] [PubMed] [Google Scholar]
- Whitaker-Azmitia PM, Azmitia EC. Stimulation of astroglial serotonin receptors produces culture media which regulates growth of serotonergic neurons. Brain Res. 1989;497:80–85. doi: 10.1016/0006-8993(89)90972-4. [DOI] [PubMed] [Google Scholar]
- Windischberger C, Langenberger H, Sycha T, Tschernko EM, Fuchsjäger-Mayerl G, Schmetterer L, Moser E. On the origin of respiratory artifacts in BOLD-EPI of the human brain. Magn Reson Imaging. 2002;20:575–582. doi: 10.1016/s0730-725x(02)00563-5. [DOI] [PubMed] [Google Scholar]
- Wirz-Justice A. Chronobiology and mood disorders. Dialogues Clin Neurosci. 2003;5:315–325. doi: 10.31887/DCNS.2003.5.4/awirzjustice. [DOI] [PMC free article] [PubMed] [Google Scholar]
- Wirz-Justice A. Diurnal variation of depressive symptoms. Dialogues Clin Neurosci. 2008;10:337–343. doi: 10.31887/DCNS.2008.10.3/awjustice. [DOI] [PMC free article] [PubMed] [Google Scholar]
- Wise RG, Ide K, Poulin MJ, Tracey I. Resting fluctuations in arterial carbon dioxide induce significant low frequency variations in BOLD signal. Neuroimage. 2004;21:1652–1664. doi: 10.1016/j.neuroimage.2003.11.025. [DOI] [PubMed] [Google Scholar]
- Wong-Lin K, Joshi A, Prasad G, McGinnity TM. Network properties of a computational model of the dorsal raphe nucleus. Neural Netw. 2012;32:15–25. doi: 10.1016/j.neunet.2012.02.009. [DOI] [PubMed] [Google Scholar]
- Yamamoto M. Fluctuations observed in biological time series signals and their functional significance. Front Med Biol Eng. 1991;3:135–137. [PubMed] [Google Scholar]
- Yavari P, Vogel GW, Neill DB. Decreased raphe unit activity in a rat model of endogenous depression. Brain Res. 1993;611:31–36. doi: 10.1016/0006-8993(93)91773-l. [DOI] [PubMed] [Google Scholar]
- Yu H, Wang J, Liu C, Deng B, Wei X. Vibrational resonance in excitable neuronal systems. Chaos. 2011;21:043101. doi: 10.1063/1.3644390. [DOI] [PubMed] [Google Scholar]
- Zeitzer JM, Maidment NT, Behnke EJ, Ackerson LC, Fried I, Engel J, Jr, Wilson CL. Ultradian sleep-cycle variation of serotonin in the human lateral ventricle. Neurol. 2002;59:1272–1274. doi: 10.1212/wnl.59.8.1272. [DOI] [PubMed] [Google Scholar]