

Abstract
The motor cortex plays a critical role in accurate visually guided movements such as reaching and target stepping. However, the manner in which vision influences the movement-related activity of neurons in the motor cortex is not well understood. In this study we have investigated how the locomotion-related activity of neurons in the motor cortex is modified when subjects switch between walking in the darkness and in light.
Three adult cats were trained to walk through corridors of an experimental chamber for a food reward. On randomly selected trials, lights were extinguished for approximately four seconds when the cat was in a straight portion of the chamber's corridor. Discharges of 146 neurons from layer V of the motor cortex, including 51 pyramidal tract cells (PTNs), were recorded and compared between light and dark conditions. It was found that while cats’ movements during locomotion in light and darkness were similar (as judged from the analysis of three-dimensional limb kinematics and the activity of limb muscles), the firing behavior of 49% (71/146) of neurons was different between the two walking conditions. This included differences in the mean discharge rate (19%, 28/146 of neurons), depth of stride-related frequency modulation (24%, 32/131), duration of the period of elevated firing ([PEF], 19%, 25/131), and number of PEFs among stride-related neurons (26%, 34/131). 20% of responding neurons exhibited more than one type of change.
We conclude that visual input plays a very significant role in determining neuronal activity in the motor cortex during locomotion by altering one, or occasionally multiple, parameters of locomotion-related discharges of its neurons.
Keywords: cat, pyramidal tract neuron, walking
1. INTRODUCTION
The role of the motor cortex in accurate visually guided movements such as reaching and target stepping is known to be important. It was shown that neuronal discharges in the motor cortex are timed to phases of reaching and target stepping [1-9], and that lesions or inactivation of the motor cortex impair these movements [6, 10-15]. The focus of nearly all of previous studies, however, has been on determining the motor parameter(s) of reaching and target stepping that are controlled by the motor cortex. The inflow of visual information about the location of the target and the manner by which this information influences the movement-related activity of neurons in the motor cortex has received much less attention.
Anatomical studies show that the motor cortex receives input from several higher order visual areas. In the cortex, parietal area 5 intensely projects to the motor cortex [16-18]. Area 5 receives inputs from a host of cortical and subcortical visual centers, including the pulvinar and a number of visual cortical areas such as 18, 19, 20, 21, lateral suprasylvian and splenial visual areas [e.g., 19-23]. Rostral subdivisions of cortical parietal area 7 also project to the motor cortex [16-18]. Area 7 receives inputs from visual cortical areas 19, 20, 21, 22, lateral suprasylvian areas as well as from the pulvinar and rostral intralaminar complex [e.g., 20, 24-27]. The main thalamic input to the motor cortex arrives from the ventrolateral thalamus. Although the ventrolateral thalamus contains very few visually responsive neurons, it receives intensive afferentation from the lateral cerebellum, which is known to have a substantial visual input [rev. in 28, 29]. In our recent publication, we argued that the stream of visual information that travels via the cerebellum and ventrolateral thalamus significantly contributes to the transmission of vision-based signals to the motor cortex during motor behavior [30].
In agreement with anatomical data, physiological experiments show that, in both anesthetized and awake animals, neurons in the motor cortex respond to visual stimuli [31-33]. In the study by Weyand and colleagues [32], when receptive fields in paralyzed cats were tested using stationary or moving spots or bars of light, 40% of sites within the motor cortex area 4γ gave moderately reliable visual responses, with most other sites showing some responsiveness, albeit weaker. Receptive fields were found to be large, occasionally encompassing most of the contralateral hemifield, and always included the area centralis. Sites with good responses were intermingled with nearly non-responsive areas. In chronically implanted behaving cats, Martin & Ghez [33] found that in many motor cortical neurons the onset of the forearm flexion/extension-related activity, although well-timed to the movement, was even better time-locked to the visual stimulus. For 56% of these cells, however, the specificity of the visual stimulus was unimportant as they were well tuned to any stimulus signaling a certain movement (e.g., elbow flexion), and their visual responses were contingent upon the movement.
In our previous studies we found that when visual information is required for accurate target stepping, the activity of the cat motor cortex differs dramatically from the activity observed during simple locomotion [6, 7]. Taking into account that inactivation of the motor cortex impairs visually guided stepping, we interpreted this altered activity as a control signal for accurate feet placement. However, the manner by which visual information contributes to the formation of a control signal in the motor cortex remained unclear. In this study we have investigated the effect of light on locomotion-related activity of neurons in the motor cortex. We trained cats to walk along a straight path with a flat surface under normal laboratory illumination, and when the lights were turned off for approximately 3-4 seconds. The analysis of three-dimensional kinematics and EMGs of limb muscles showed that cats walked very similarly in the light and darkness. The locomotion-related discharges of 49% (71/146) of neurons, however, were different between the two conditions. We conclude that the motor cortex responds to visual stimulation during locomotion, and describe how the light, and thus the ability to see, shapes its locomotion-related activity.
A brief account of this study was published in abstract form [34].
2. METHODS
Recordings were obtained from three adult cats prepared for chronic experiments, of which two were female and one was male. Methods of surgical preparation and recording techniques have been previously described in detail and will be briefly reported here [6, 35]. All experiments were conducted in accordance with NIH guidelines and with the approval of the Barrow Neurological Institute Animal Care and Use Committee.
2.1. Locomotion tasks
Positive reinforcement (food) was used to habituate cats to the experimental situation and engage them in locomotion behavior [36, 37]. Cats walked in a rectangular chamber that had two corridors, each 2.5 m long and 0.3 m wide (Fig. 1 A). The cat's passage through the beginning and the end of each corridor was monitored using infrared photodiodes (emission wavelengths of 850-900 nm, which is outside of the visible spectral range of the cat [38]).
Figure 1.
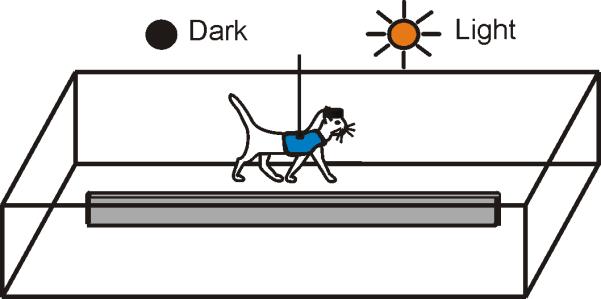
Locomotion tasks. The cat walked continuously in a rectangular chamber with two paths. On randomly chosen rounds, lights were turned off upon the cat entering a straight portion of the walkway; they were kept off for approximately four seconds, and were turned back on shortly before the cat reached the turn.
Cats walked in two experimental conditions: under normal laboratory illumination of approximately 500 lux (the spectral sensitivity of cats is very similar to that of humans [38]) and in full darkness. The experimental room had no windows, its door was light-proofed, and all lights from electronics were masked. Computer monitors were located in a neighboring room. The darkness condition was randomly presented in approximately 50% of the rounds. It started upon the cat entering a straight portion of the walkway and ended when it reached a photodiode at the end of the corridor. Typically, it took cats between 2.5 and 4 seconds to walk through a corridor. Cats were trained to walk around the chamber in this experimental setting daily for about 2-3 weeks until they were confident in doing so.
Cats were accustomed to wearing a cotton jacket, a light backpack with connectors, and a sock with a small metal plate on the sole of the foot for recording foot contact with the floor. The floor in the chamber was covered with an electrically conductive rubberized material. During locomotion, the durations of the swing and stance phases of the right forelimb (contralateral to the side of recording in the motor cortex) were monitored by measuring the electrical resistance between the plate and the floor (Steps trace in Fig. 3A,D). On selected trials, cat movements were recorded using the Visualeyez System (3D Real Time Motion Capture and Analysis System, Phoenix Technologies Inc., Canada). This system detects positions of light-emitting photodiodes (LEDs) in three-dimentional space and calculates various kinematical parameters. Wide-angle, six-chip infrared LEDs with wavelengths of 755-785 nm, which are invisible to cats [38], were attached to the skin projections of the base of the fifth metacarpal on the right paw and the vertebral border of the right scapula. The frequency of sampling was 200 Hz. Position, velocity, and acceleration were determined and averaged across all selected strides.
Figure 3.

A typical example of the activity of a neuron (PTN 5055) and selected right fore- and hindlimb muscles during locomotion in the darkness and light. A: Activity of the neuron and muscles during locomotion in the darkness. Tri, m. triceps brahii (elbow extensor); Edc, m. extensor digitorum communis (wrist and phalanges dorsal flexor); ECU, m. extensor carpi ulnaris (wrist dorsal flexor); GL, m. gastrocnemius lateralis (ankle extensor), VL, m. vastus lateralis (knee extensor). The bottom trace shows the stance (St) and swing (Sw) phases of the step cycle of the right forelimb that is contralateral to the recording site in the cortex. B, C: The activity of the same neuron during locomotion in the darkness is presented as a raster of 120 step cycles (B) and as histograms (C). The duration of step cycles is normalized to 100%. In the raster, the end of swing and the beginning of the stance in each cycle is indicated by an open triangle. In the histogram, the horizontal black bar shows the period of elevated firing (PEF) and the circle indicates the preferred phase as defined in the “Methods” section. The value of dM is stated. D-F: Activities of the same neuron and muscles during locomotion in illuminated room. G: Responses of a neuron to movements of an object in front of the cat (PTN 3676, located in the rostral cruciate sulcus). Arrows pointed up indicate movements from cat's right to left, arrows pointed down indicate movements from cat's left to right.
2.2. Surgical procedures
After each cat was trained, surgery was performed under aseptic conditions using isoflurane anesthesia. In two cats, bipolar EMG electrodes (flexible Teflon-insulated stainless-steel wires) were implanted bilaterally into three forelimb muscles: m. triceps brahii (Tri, elbow extensor), m. extensor digitorum communis (EDC, wrist and phalanges dorsal flexor), and m. extensor carpi ulnaris (ECU- wrist dorsal flexor); and into three hindlimb muscles: m. gastrocnemius lateralis (GL, ankle extensor), m. soleus (SO, ankle extensor), m. vastus lateralis (VL, knee extensor). The electrode placements were verified by stimulation through the implanted wires before closure of the incision. The wires were led subcutaneously and connected to sockets on the head base.
For the head implant, the skin and fascia were retracted from the dorsal surface of the skull. At 10 points around the circumference of the head, stainless steel screws were implanted. The heads of the screws were then inserted into a plastic cast to form a circular base. This base later allowed the head to be fixed in a head-restraining device so that neurons could be isolated before recording their activity during locomotion. The base was also used to affix connectors, a miniature microdrive, preamplifiers, and a protective and electrically shielding cap. To access the left motor cortex, a portion of the os frontale, os ethmoidale, and dura above the left motor cortex over an area of approximately 1 cm2 were removed. The motor cortex was visually identified by surface features and photographed (Fig. 2 A). The aperture was then covered by a 1 mm thick acrylic plate, in which approximately 200 holes, 0.36 mm in diameter, had been drilled and filled with a mixture of bone wax and petroleum jelly. Recording microelectrodes were later inserted into the motor cortex of the awake animal through the holes in the plate.
Figure 2.
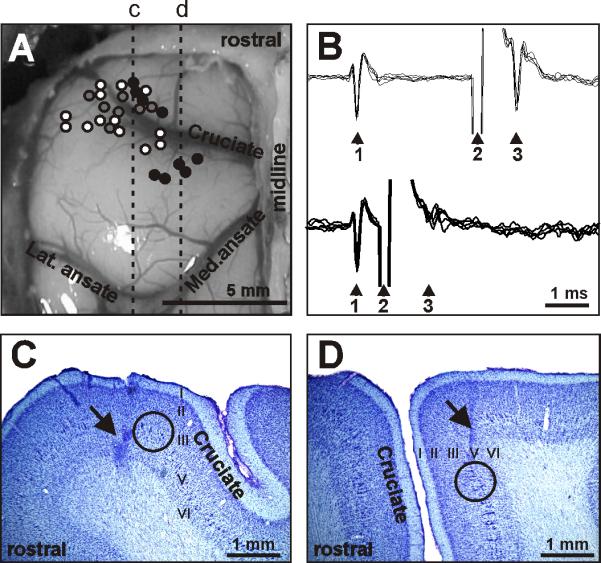
Location and identification of neurons. A: Areas of recording in the left motor cortex. Microelectrode entry points into the cortex were combined from all cats and are shown as circles on the photograph of cat 2 cortex: cat 1, 2, and 3 entry points are depicted by grey, white, and black circles, respectively. Positions of parasagittal sections, whose photomicrographs are shown in C and D are indicated by dotted lines c and d, respectively. B: A collision test determines whether a neuron's response to pyramidal tract stimulation is antidromic. Top: the neuron spontaneously discharges (arrowhead 1) and the pyramidal tract is stimulated approximately 3 ms later (arrowhead 2). The neuron responds with a latency of approximately 1 ms (arrowhead 3). Bottom: the neuron spontaneously discharges (arrowhead 1) and the pyramidal tract is stimulated about 0.5 ms later (arrowhead 2). The neuron does not respond (arrowhead 3) because at 0.5 ms the spontaneous spike was still en route to pyramidal tract, therefore causing the collision, or nullification, of the response. The test confirms that the neurons's response was antidromic, and therefore the neuron proves to be a pyramidal tract projecting neuron (PTN). C: Photomicrograph of a parasagittal section through the lateral pre-cruciate motor cortex (section c). An arrow points to a reference electrolytic lesion in the forelimb representation of the motor cortex. D: Photomicrograph of a parasagittal section through the medial motor cortex (section d). An arrow points to a reference electrolytic lesion in the hindlimb representation of the motor cortex. In C and D: Layers of the cortex are numbered. Groups of giant cells in layer V, which are characteristic for area 4γ and are visible throughout both the pre- and post-cruciate cortex, are encircled. Cresyl violet stain.
Two 26 gauge hypodermic guide tubes were implanted vertically above the medullary pyramids with tips approximately at the Horsley-Clarke coordinates (P7.5, L0.5) and (P7.5, L1.5), and the depth of H0. They were later used for physiologically guided insertion of stimulating electrodes into the pyramidal tract [35]. These electrodes were used to identify pyramidal tract neurons (PTNs) in the awake animal. All exposed surfaces of the skull were covered with a thin layer of orthodontic resin (Densply Caulk). The space between the skull, the retracted skin and the bottom of the base was filled with silicone elastomer (Factor II, Lakeside, AZ) to form a soft barrier between the inside and outside of the base.
2.3. Sampling of neuronal and EMG activity
After recovering from surgery over a period of five or six days, the cat was placed on a table and encouraged to take a “sphinx” position on a comforting pad. After resting in this position for a few minutes, the base attached to the skull during surgery was fastened to an external frame, thereby approximating the natural resting position of the cat's head. After a few sessions of an increased duration, all cats would calmly rest in the sphinx position with their head restrained. The cats did not seem to be in any discomfort and would often fall asleep.
While the animal was at rest on the table, the motor cortex was searched for well-isolated neurons. Neuronal activity was recorded extracellularly using either platinum-tungsten quartz-insulated microelectrodes (40 μm outer diameter) pulled to a fine tip and mechanically sharpened [39], or commercially available tungsten varnish-insulated electrodes (Frederick Haer & Co; Bowdoin, ME). The impedance of both types of electrodes was 2–4 MΩ at 1000 Hz. A custom made light-weight (2.5g) manual single-axis micro-manipulator chronically mounted to animal's skull was used to advance the microelectrode. Signals from the microelectrode were pre-amplified with a custom-made miniature preamplifier positioned on the cat's head, and then further amplified with CyberAmp 380 (Axon Instruments). After amplification, signals were filtered (0.3-10 kHz band pass), digitized with a sampling frequency of 30 kHz, displayed on a screen, fed to an audio monitor, and recorded to the hard disk of a computer by means of a data acquisition hardware and software package (Power-1401/Spike-2 System, Cambridge Electronic Design, Cambridge, UK). An example of a recording is shown in Figure 3 A,D.
Signals from EMG pre-amplifiers were amplified and filtered (30-1,500 Hz) using a CyberAmp 380 amplifier, digitized with a sampling frequency of 3 kHz, displayed on the screen, and recorded to the disc of a computer using the same data-acquisition software as for neurons. After digitization, the EMG signals were rectified and smoothed by filters with a time constant of 50 ms. An example of an untreated data recording is shown in Figure 3 A,D.
2.4. Identification of neurons
A waveform analysis was employed to identify and isolate the spikes of a single neuron using the Power-1401/Spike-2 system waveform-matching algorithm. In addition, all encountered neurons were tested for antidromic activation using pulses of graded intensity (0.2 ms duration, up to 0.5 mA) delivered through the bipolar stimulating electrodes to the medullary pyramidal tract. The identification of antidromic responses was determined by the test for the collision of spikes [40, 41], which is illustrated in Figure 2B. For the purpose of conduction velocity calculation, the distance between electrodes in the medullary pyramidal tract and at recording sites in the peri-cruciate cortex was estimated at 51 mm. Neurons were classified as fast- or slow-conducting PTNs based on the criteria of Takahashi [42]: PTNs with conduction velocity of 21 m/s or higher were considered to be fast-conducting, while those with conduction velocities below this threshold were considered to be slow-conducting. Neurons were tested for antidromic activation before, during, and after locomotion.
Recordings were obtained from the rostral and lateral sigmoid gyrus (forelimb representation area) as well as from the postcruciate cortex within the fold of the cruciate sulcus (forelimb and hindlimb representations) (Fig. 2 A,C, and D). These areas are considered to be the motor cortex based on a considerable body of data obtained by means of inactivation, stimulation, and recording techniques [6, 8, 10, 33, 43-48]. A parasagittal section through the frontal cortex with a reference electrolytic lesion next to giant pyramidal cells in cortical layer V, which are characteristic of motor cortex area 4γ, is shown in Figure 2C (pre-cruciate cortex) and Figure 2D (post-cruciate cortex). To determine the locations of the fore- and hindlimb representations within the motor cortex, somatic receptive fields were mapped while the animals were resting on a pad with their head restrained. Somatosensory stimulation was produced by palpation of muscles and tendons and by passive movements of joints. Neurons responsive to passive movements of joints were further assessed for directional preference.
Responses to visual stimulation were tested by presenting moving stimuli: circles 2.5 cm in diameter, stripes 5 cm wide and 100 cm long, fields 50 × 50 cm, and complex three-dimensional stimuli such as toys, laboratory objects, and hands. Two-dimensional stimuli were black. All stimuli were presented against the natural laboratory background and were moved in different directions in the frontal plane at the distance of approximately 50 cm in front of the animal and also toward the animal and away from it with the speed of 0.5–1.0 m/s.
2.5. Analysis of neural activity
To compare the activity of neurons during locomotion in the light and darkness we used only the strides in which average durations in the two conditions differed by less than 10%. These strides were selected from three strides made in the middle of walkway. Earlier we showed that in the middle of the corridor cats walk with nearly constant speed [7]. For forelimb-related cells, the onset of the swing phase of the right forelimb was taken as the beginning of the step cycle. The duration of each cycle was divided into twenty equal bins. For hindlimb-related neurons, the beginning of the 16th bin of the forelimb cycle, which corresponds to the beginning of the swing phase of the right hind limb, was taken as the onset of the hind limb step cycle. A phase histogram of the discharge rate of each neuron in the step cycle was then generated and averaged over all selected cycles (Fig. 3B, C, E, and F). Phase histograms were smoothed by recalculating the values of the bins according to the equation Fn’=0.25*Fn-1 + 0.5*Fn + 0.25*Fn+1, when Fn is the bin's original value. The first bin was considered to follow the last bin, and the last bin was considered to precede the first bin. The “depth” of modulation, dM, was calculated as dM = (Nmax - Nmin)/N * 100%, where Nmax and Nmin are the number of spikes in the maximal and the minimal histogram bin, and N is the total number of spikes in the histogram. Neurons with dM>4% were judged to be stride-related. This was based on an analysis of fluctuations in the activity of neurons in the resting animal. For this analysis, the activities of 100 neurons recorded while the cat was sitting with its head restrained were processed as if the cat was walking [30]. The timing of steps made by the same cat during the preceding walking test was used to construct the histogram. In stride-related neurons, the period of elevated firing (PEF) was defined as the portion of the cycle in which the activity level exceeds the minimal activity by 25% of the difference between the maximal and minimal frequencies in the neuronal discharge histogram (Fig. 3C,F). PEFs were smoothed by renouncing all one-bin peaks and troughs (a total of 1% of bins were altered throughout the database). The “preferred phase” of discharge of each neuron with a single PEF was assessed using circular statistics [49-51; see also 52, 53].
For comparisons of the discharge rate of individual neurons in different conditions and between groups of neurons, the two-tailed Student's t-test was used to determine statistical significance. When comparing dM, preferred phase, and duration of PEF, differences equal to or greater than 20%, 10%, and 20%, respectively, were considered significant. These criteria were established based on the results of a bootstrapping analysis [54, 55], which compared differences in discharges between various reshufflings of strides of the same locomotion task. It showed that natural PTN activity fluctuations remain within these limits with 95% confidence. Unless noted otherwise, for all mean values, the standard error of the mean (SEM) is given. When data were categorical, a nonparametric Fisher's two-tailed test was used.
2.6. Histological procedures
At the termination of experiments, cats were deeply anaesthetized with pentobarbital sodium. Several reference lesions were made in the regions of the motor cortex from which neurons were sampled. Cats were then perfused with isotonic saline followed by a 3% paraformaldehyde solution. Frozen brain sections of 50 μm thickness were cut in the regions of recording and stimulating electrodes. The tissue was stained for Nissl substance with cresyl violet. Zoning of the cortex was performed according to established criteria [32, 56, 57]. The positions of recording tracks in the motor cortex were estimated in relation to the reference lesions (Fig. 2 C,D). The positions of stimulation electrodes in the medullar pyramids were verified.
3. RESULTS
3.1. Kinematics of walking in the light and darkness are similar
During the recording of each individual neuron, cats walked between 10 and 80 (typically 20-50) times down each of the chamber's corridors. From these runs, 20–200 strides (72±34 in the light and 73±37 in the darkness, mean ± SD) made in the middle of the corridor (with average durations in the light and dark differing by less than 10%) were selected for analysis. One of the cats walked relatively quickly (cat 1) and the other two walked more slowly (cats 2 and 3). The average durations of strides selected were around 600 ms and 740-780 ms, respectively (Fig. 4A). This corresponded to a walking speed of 0.83 m/s and 0.65-0.68 m/s, respectively. Although different cats walked with a slightly different speed overall, each of them had approximately the same speed during walking under the two illumination conditions. Only cat 2 had a statistically significantly different average duration of strides during locomotion under normal illumination and in the dark, and the difference was 20 ms or 2.7% of the stride cycle. The ratio of the stance duration to the cycle duration (the stride duty factor) varied only slightly between cats (Fig. 4B), and was 60-65% on average. There was a slight difference of 1.5% for the average stride duty factor in cat 3.
Figure 4.

Kinematics of locomotion in the darkness and light. A: The average duration of the stride of each cat in the two light conditions. B: The average stride duty factor (the percent of the total cycle in which the right forelimb is in the stance phase). C,D: Vertical position (top panel), and vertical (middle panel) and horizontal (bottom panel) velocity of the right paw (C) and scapula (D). Error bars are SDs. Stars denote significant differences in parameters between the conditions (Student's unpaired t test, p<0.05).
Movements of the right paw and scapula were recorded in cats 2 and 3 while they walked around the chamber under illumination protocol similar to that used during neuronal recordings. Representative examples of vertical paw and scapula positions, and horizontal and vertical velocities during locomotion in the two conditions are shown in Figures 4C,D. For both cats, movements of the paw were similar in all parameters tested (Fig. 4C). Position of the scapula was 2.3±1.3 mm higher throughout most of the step cycle during walking in the illuminated room as compared to walking in the darkness; however, in the middle of the stance phase scapula position was always similar between the conditions (Fig. 4 D, top panel). Vertical velocities of the scapula were also similar (Fig. 4 D, middle panel). In approximately one third of the trials, horizontal velocities were slightly higher (by 7-10%) during walking in the illuminated room as compared to walking in the darkness (Fig. 4 D, lower panel).
3.2. Activities of muscles during walking in the light and darkness
In cats 1 and 2, the activity of three forelimb and three hindlimb muscles was recorded on each side of the body. Muscles showed only very minor differences in the activity during locomotion under different lightening conditions (Fig. 5). Elbow extensor m. triceps brachii was typically active slightly longer during walking in the light (Student's unpaired t test, p<0.05), by 5-10% of the cycle. Wrist and phalanges dorsal flexor m. extensor digitorum communis often began later in the cycle during walking in the light (Student's unpaired t test, p<0.05), by 5-10%, but finished at the same time as during walking in the darkness. Ankle extensor m. soleus occasionally showed differences analogous to those seen in the m. extensor digitorum communis, however in other trials was active uniformly between conditions. Wrist dorsal flexor m. extensor carpi ulnaris during walking in the light was more active at the peak (Student's unpaired t test, p<0.05) generating 3.8±1.5% more output (mean±SD). At the same time, the activity of the ankle extensor and knee flexor m. lateral gastrocnemius and that of the knee extensor m. vastus lateralis were typically indistinguishable during locomotion in the darkness and light.
Figure 5.

Typical examples of EMG activity of selected limb muscles during locomotion in the darkness and light. Each panel shows a representative activity of a muscle, which was averaged over 20-45 strides of each locomotion task, all recorded during one session (see Methods for stride selection). Error bars are SDs. Stars denote significant differences between the conditions (Student's unpaired t test, p<0.05).
3.3. Characteristics of neurons
Neuronal data was collected from a total of 29 tracks through the motor cortex of three cats (7 tracks in cat 1, 13 in cat 2, and 9 in cat 3; Fig. 2A). This data was considered together to analyze the activity of 146 neurons (19 from cat 1, 77 from cat 2, and 50 from cat 3). Based on cytoarchitectural features, it was determined that all neurons were located in layer V of the motor cortex area 4γ. Fifty-one cells responded to stimulation of the pyramidal tract (17 from cat 1, 22 from cat 2, and 12 from cat 3). The latencies of responses ranged from 0.8 to 4.6 ms. Estimated conduction velocities were between 11 and 64 m/s. Among responding neurons 63% (32/51) responded at 2.0 ms or faster, conducting at 25 m/s or faster, and thus were “fast-conducting” PTNs, while 37% (19/51) were “slow-conducting” [42].
Responses of 114 neurons to somatosensory stimulation were tested. A somatosensory receptive field was found in 87% (99/114) of neurons. All receptive fields were located on the contralateral (right) side of the body and all but one were excitatory. Most neurons (77/99) had a receptive field on the forelimb, while 22 neurons responded to stimulation of the hindlimb. From neurons responding to stimulation of the forelimb, 23 were activated by passive movements of the shoulder or palpation of back or neck muscles, 31 responded to movements in the elbow joint or palpation of arm muscles, and 23 were activated by movements of the wrist or palpation of muscles on the forearm or paw. Several neurons responded to movement in two joints or the entire forelimb. Neurons activated by a passive movement in a joint often had a preferred direction. One third (n=8) of shoulder-related cells responded to adduction of the shoulder, while others responded to either abduction (n=4), flexion (n=4), or extension (n=2) of the joint. From elbow-related cells, 7 neurons responded to flexion and 3 were activated by extension. From wrist-related neurons, 7 responded to wrist ventral flexion while 4 responded to dorsal flexion.
One half of neurons activated by stimulation of the hindlimb responded to movement or palpation of the ankle. They often were also directionally specific with 5 neurons responding only to ankle flexion and 3 only to ankle extension. From the other hindlimb-related cells, 4 responded to movements in the knee, 2 to the hip, and 2 to the paw.
From the group of 15 unresponsive somatosensory neurons, nine responded to visual stimuli. Four of these cells were activated by an object moving across the field of view from the periphery to the central field of vision and three were activated by approach of an object. Example responses of a neuron to a movement of an object in front of the cat is shown in Figure 3G. All visually responsive cells were located within the forelimb representation of the area 4γ, and eight of the nine were found in the post-cruciate fold of the sigmoid gyrus.
A typical example of activity of a neuron during walking in the light and dark is shown in Figure 3A-F. The neuron was recorded from the forelimb representation region but it was not responsive to either somatosensory or visual stimulation. During locomotion in the dark, the neuron's activity was modulated in the rhythm of strides: it was high at the end of stance and during most of the swing phases, while low in the beginning and middle of the stance phase. When the lights were turned on, the neuron's activity increased throughout all of the step cycle. The raster plots in Figure 3 B,E show the activity of the neuron across 120 individual strides during locomotion in the dark (B) and light (E). The pattern of activity was very consistent across strides of each locomotion task, but during walking in the light there was more activity during the middle of the stance phase compared to walking in the dark. The activity is summed in Figures 3 C,F showing histograms of neuron firing rates across the step cycle during locomotion in the dark (C) and light (F). The period of elevated firing (PEF, see definition in Methods) is indicated by a black horizontal bar; it was contained within the swing and late stance phase of the step during both locomotion tasks. The preferred phase (indicated by a circle in Figures 3C and 3E) was in the beginning of the swing phase during both locomotion tasks.
3.4. Activity of neurons during locomotion in the darkness
The mean activity of the population during walking in the darkness was 10.7±0.6 spikes/s. The discharge rate of 90% (131/146) of cells was modulated in the rhythm of strides: it was higher in one phase of the stride and lower in another phase. The great majority of neurons (79%, 104/131) exhibited a single PEF, while 21% (27/131) had two PEFs. The average depth of modulation in one- and two-PEF populations was similar: 10.6±0.6 and 9.7±0.7, respectively. In both populations, PEFs and preferred phases were fairly evenly distributed across the step cycle (Figs. 6 A1,B1). The average duration of the PEF was 60±1.5% and 58±2.5% of the cycle in one- and two-PEF groups, respectively. In 70% (19/27) of neurons with two PEFs, the PEFs differed in their duration by 10-35% of the cycle, and in eight of the neurons the longest PEF had also the highest discharge rate, on average by 12±8 spikes/s (mean ± SD). Neurons with two PEFs of a similar duration typically were also more active during one of their PEFs.
Figure 6.

Population characteristics of one- and two-PEF neurons during locomotion in the darkness and light. A1, C1: Phase distribution of PEFs of all one-PEF neurons during locomotion in the dark (A1) and under normal illumination (C1). Each row represents the PEF of one cell. A circular mark on each PEF denotes the cell's preferred phase. Neurons are rank-ordered so that those with a preferred phase earlier in the cycle are plotted on the top of the graph. Vertical interrupted lines indicate the end of swing and beginning of stance phase. A2, C2: Corresponding phase distributions of discharge frequencies. The average discharge frequency in each 1/20th portion of the cycle is color-coded according to the scale shown at the bottom of the figure. A3, C3: Proportion of active one-PEF neurons (neurons in their PEF) in different phases of the step cycle during walking in the darkness (A3) and light (C3). A4, C4: The mean discharge rate of one-PEF neurons during walking in the darkness (A4) and under normal illumination (C4). Thin lines show SEM. B1-4 and D1-4 show characteristics of two-PEF neurons locomotion in the darkness (B1-4) and light (D1-4). Designations are similar to those in A,C.
Because of a largely even distribution of PEFs and their relatively long duration in both one- and two-PEF populations, PEFs of different neurons overlapped and approximately 60% of neurons were simultaneously active at any time of the cycle in either of the groups (Fig. 6 A3, B3). However, in the one-PEF group, there were slightly more neurons with preferred phases during swing (Fig. 6 A1,3) and they were more active than those with preferred phases during stance (Fig. 6 A2); as a result, the whole population of one-PEF cells was slightly, but statistically significantly, more active during the swing phase as compared to stance (Student's unpaired t test, p<0.05; Fig. 6 A4). The activity of two-PEF neurons as a group was steady over the cycle (Fig. 6 B2,4).
Neurons with different receptive fields differed in their step-related activity. Forelimb-related cells as a group had a steady activity over the cycle that measured 11-13 spikes/s. Within the forelimb-related population, wrist-related neurons were most active and modulated (Student's unpaired t test, p<0.05), but as a group they engaged later in the cycle as compared to both elbow and shoulder-related cells, firing right before the foot made contact with the floor (Fig. 7 A2,4 and B2,4 vs. C2,4). In stark contrast, most hindlimb-related neurons discharged during the swing or beginning of the stance phase (Fig. 7 D1, D3). Thus, their population's activity was sharply modulated with a peak during swing that reached approximately 20 spike/s (Fig. 7 D4). Visually responsive neurons (n=9) were as active as the rest of population, however only five displayed activity that was step cycle related. This was a significantly smaller proportion of step-related cells as compared to the entire population (Fisher's two-tailed test, p=0.0001).
Figure 7.

Population characteristics of neurons with different somatosensory receptive fields during locomotion in the darkness and light. A, E: Activity of neurons responsive to movements in the shoulder joint, and/or palpation of back or neck muscles during locomotion in the darkness (A) and under normal illumination (E). A1, E1: Phase distribution of PEFs. A2, E2: Corresponding phase distribution of discharge frequencies. The average discharge frequency in each 1/20th portion of the cycle is color-coded according to the scale shown at the bottom of the figure. A3, E3: Proportion of active neurons (neurons in their PEFs) in different phases of the step cycle. A4, E4: The mean discharge rate. Thin lines show SEM. Vertical interrupted lines denote end of swing and beginning of stance phase. B, F: Activity of neurons responsive to passive movement of the elbow joint or palpation of arm muscles. C, G: Activity of neurons responsive to passive movement in the wrist joint or palpation of muscles on the forearm or paw. D, H: Activity of neurons responsive to stimulation of the hindlimb.
3.5. Effect of light on the activity of neurons during locomotion
The activity of 49% (71/146) of neurons was different during locomotion in the light as compared to the darkness. The mean discharge rate was different in 19% (28/146) of neurons: it was higher in 15 cells by 30±3% and lower in 13 cells by an approximately similar amount (Student's unpaired t test, p<0.05; Fig. 8A). The depth of frequency modulation was different in 24% (32/131) of neurons. In the light, it was higher in 11 cells by 32±4%, and lower in 21 cells by 50±7% (Fig. 8B). The duration of the PEF was different in 19% (25/131) of neurons. In the light, it was shorter in 13 and longer in 12 cells by 20-40% of the cycle (Fig. 8C).
Figure 8.

Comparison of activity characteristics of individual neurons between locomotion in the darkness and light. A: Mean discharge frequency averaged over the stride. B: Depth of frequency modulation, dM. C: Duration of PEF, for two-PEF neurons, the combined duration of two PEFs is given. A-C: The abscissa and ordinate of each point show the values of a characteristic of a neuron during locomotion in the darkness and light, respectively. Neurons whose characteristics were statistically significantly different during the two tasks (see Methods) are shown as filled circles; others are shown as open circles. D: Neurons with a statistically significant difference in at least one of the above parameters of the activity between two conditions. The abscissa, ordinate, and applicate of each point show the difference in a discharge characteristic of a neuron between dark and light conditions. The difference is positive if the value of the parameter was larger during locomotion in the light. The star in the middle of the cube denotes the zero point. E: Negative correlation between the relative change in the depth of modulation, dM, and activity, Act. F: Negative correlation between the change in the depth of modulation and duration (width) of PEF, PEFw. In E and F: The abscissa and ordinate of each point show the difference in a discharge characteristic of a neuron between two illumination conditions. The difference is positive if the value of the parameter was larger during locomotion in the light. Only neurons with statistically significant difference in the dM between two walking conditions are shown. The coefficient of correlation (r) is indicated.
The number of PEFs was different in 26% (34/131) of cells. A fifth of neurons with one-PEF in the dark (21%, 22/104) had two PEFs in the light. This typically occurred via an appearance of a second trough within the PEF (n=7; Fig. 9A,B), an appearance of a new PEF within the trough (n=6; Fig. 9C,D), or an increase of activity within a part of the PEF (n=5; Fig. 9E,F). On the other hand, 31% (8/26) of neurons with two-PEFs in the dark had just one PEF in the light. This typically occurred by an increase of activity within one of the troughs so that two of the PEFs became fused together (n=4), or by reduction in the activity within one of the PEFs (n=3; Fig. 9G,H). As a result of these differences in the number of PEFs in individual neurons, during walking in the light, there were less one-PEF and more two-PEF neurons than during walking in the darkness (Fig. 6A1,2 and B1,2 vs. C1,2 and D1,2). In addition to neurons having a different number of PEFs in different lighting conditions, the activity of two cells was step cycle-modulated only in the light, whereas the activity of two others was only modulated in the darkness. In the population of neurons that had one PEF during both conditions (n=86), the preferred phase was very stable with only three neurons having a different preferred phase in the light.
Figure 9.

Differences in discharge patterns of neurons during locomotion in the darkness and light. A: A schematic presentation of the most frequently observed types of difference in the discharge pattern. In the light, a subtle trough within the one PEF seen during walking in the darkness deepens and divides the PEF into two. The black line shows activity during walking in the darkness, and orange line shows the activity during walking in the light. The vertical dotted line shows end of swing and beginning of stance phase. B: An example activity of a neuron exhibiting this behavior. The dark gray area histogram shows the activity of the neuron during locomotion in the darkness. The orange bar histogram shows the activity during locomotion in the light. To promote visualization of the difference in activities between two tasks, the stride cycle is shown twice. C, D: Same as A, B but showing the second most frequent type of discharge pattern difference. The transition from one- to two-PRF discharge pattern occurred because in the light a new PEF appeared within the former trough. E, F: Same as above but showing the third most frequent type of discharge pattern change in the light from one to two PEFs per cycle: by an increase in activity within a part of the PEF. G, H: same as above but showing the discharge pattern change from two- to one-PEFs per cycle.
The great majority of neurons (80%, 57/71) had only one or two parameters of their activity different between lighting conditions: most often the average discharge rate and the duration of the PEF, or the duration of the PEF and the number of PEFs, or the average discharge rate and the depth of modulation. Some neurons (20%, 14/71), however, differed in three, four, or even all five parameters measured. Figure 8D shows distribution of neurons with a statistically significant difference in at least one parameter of the activity between dark and light conditions across the three-dimensional space of (i) change in the average discharge rate vs. (ii) change in the duration of the PEF vs. (iii) change in the depth of modulation. One can see that the light substantially affected the activity of motor cortical neurons. Moreover, there was a relationship between changes in the average discharge rate, depth of modulation, and width of the PEF: as the discharge rate or the width of the PEF increased, the depth of modulation tended to decrease (Fig. 8E, F). There were some differences, however, in how different neurons responded to the light during locomotion.
NEURONS WITH DIFFERENT NUMBER OF PEFs
Two-PEF neurons responded stronger to light as compared to both unmodulated and one-PEF cells. In the light, a much larger portion of two-PEFs neurons (25%, 6/26) had a lower average discharge rate than in the darkness as compared to one-PEF and unmodulated neurons, of which only 5% and 7% had a lower rate in the light (6/105 and 1/14, respectively; Fisher's two-tailed test, p=0.01). In addition, a larger portion of two-PEF cells (21%, 5/26) had a greater depth of locomotion-related frequency modulation in the light than in the darkness as compared to one-PEF neurons, from which only 6% (6/105) had a greater modulation depth in the light (Fisher's two-tailed test, p=0.042).
NEURONS WITH DIFFERENT RECEPTIVE FIELDS
A larger portion of hindlimb-related cells (36%, 8/22) had different discharge rates during walking in the darkness and light as compared to forelimb-related cells (14%, 11/76; Fisher's two-tailed test, p=0.032). In addition, all but two of the hindlimb-related neurons discharged at a lower frequency in the light than in the dark, unlike forelimb-related cells, which most often were more active in the light (Fisher's two-tailed test, p=0.015).
Of the nine visually responsive cells, two had a higher discharge rate and one had a lower rate in the light than in the darkness. Of five cells with a discharge rate that was step-phase related in the darkness, two had a lower depth of modulation in the light. Differences in the number of PEFs were inconsistent: the number of PEFs was smaller in two and greater in one cell, and there was no difference in two other cells. There was no difference to the duration of the PEF in any of visually responsive cells between light and dark conditions.
FAST- and SLOW-CONDUCTING PTNs
The discharge rate of 45% (23/51) of PTNs was different during locomotion in the light and darkness. Nearly a quarter of fast-conducting PTNs, 22% (7/32), had a lower activity in the light. This was different from the behavior of slow-conducting PTNs, which never had a lower discharge rate in the light (Fisher's two-tailed test, p=0.037). Overall, considering fast and slow-conducting cells together, PTNs had a tendency to discharge at different rates during locomotion in the light and darkness more often than unidentified neurons. In contrast to the unidentified neurons, which often had a shorter PEF in the light than in the darkness, the PEF of PTNs almost never was shorter in the light (Fisher's two-tailed test, p=0.01). PTNs tended to have two or more parameters of the activity different between light and dark conditions, while in unidentified neurons, most often only one parameter was different.
Despite significant differences in the locomotion-related activity between light and dark conditions displayed by nearly half of the neurons considered in this study, the average discharge rate, depth of modulation, and duration of PEF for the entire motor cortex population remained similar (Fig. 6). This was because, between the conditions, a roughly similar number of neurons changed their activities in opposing ways.
3.6. Effect of light wears off gradually
The activity of 46 neurons was analyzed separately for the first, second, and third steps made after the lights were turned off, and for the first step made after the lights were turned on. After the removal of the light, approximately half of neurons (54%, 25/46) changed their average discharge rate and/or depth of locomotion-related frequency modulation not abruptly but in a gradual manner. A representative example is shown in Figure 10A. In the light, PTN 5046 discharged intensely during the second half of the swing phase and was much less active throughout remainder of the step cycle (Fig. 10 Aa,b). The activity of the neuron during the first step made without the light was very similar (Fig. 10 Ac,d). During the second step taken in the dark, however, the activity of the PTN during the end of the swing phase increased by approximately 10 spikes/s, while the activity during the rest of the stride remained unchanged (Fig. 10 Ae,f). During the third step in the darkness, the activity of the neuron during the stance phase decreased, forming a clear gap in the activity immediately after the peak at the end of the swing phase (Fig. 10 Ag,h). The activity of the neuron during the first step taken after lights were turned on was very similar to its activity averaged over all steps in the light (Fig. 10 Ai,j).
Figure 10.

Changes in the activity and modulation over the period of darkness. A: An example of a neuron (PTN 5046) that changed the discharge rate and modulation depth during the period of the darkness. Aa,b: The activity of the neuron during locomotion in the light is presented as a raster of 40 step cycles (a) and as a histogram (b). The duration of step cycles is normalized to 100%. In the raster, the end of swing and the beginning of the stance in each cycle is indicated by an open triangle. Ac,d: The activity of the same neuron during the first step made after lights were turned off (Step 1) is shown as a raster of 40 step cycles (c) and as a histogram (d). Ae,f: The activity of the same neuron during the second step after lights were turned off (Step 2) is shown as a raster of 40 step cycles (e) and as a histogram (f). Ag,h: The activity of the neuron during the third step in the darkness (Step 3) is presented as a raster of 40 step cycles (g) and as a histogram (h). Ai,j: The activity of the neuron during the first step made after lights were turned back on is shown as a raster of 30 step cycles (i) and as a histogram (j). B: Histograms of the activity of another neuron (PTN 5055) that had different activities between light and dark conditions but did not change the activity during the period of the darkness.
Out of 25 neurons that changed their activity gradually after removal of the light, 15 changed their average discharge rate, typically increasing it by 3.7±0.8 spikes/s, either between the 1st and the 2nd or between the 2nd and the 3rd step in the darkness. Fourteen cells changed the depth of modulation by increasing or decreasing it by 3.8±0.4 %. This too could occur either between the 1st and the 2nd or between the 2nd and the 3rd step in the darkness. Among those there were four neurons that changed both the discharge rate and the depth of modulation as did PTN 5046 shown in Figure 10A. In contrast, 21 neurons out of 46 tested had already changed their activity during the first step in the dark and did not alter it more during the period of the darkness maintaining the change until after the lights came back on (Fig. 10B).
4. DISCUSSION
Characteristics of neuronal discharges in the motor cortex during locomotion found in this study are consistent with earlier reports [4-6, 8, 35, 55, 58, 59]. In accordance with previous findings, the activity of nearly all neurons in layer V was modulated in the rhythm of strides, with the great majority exhibiting one PEF per cycle. PEFs of forelimb-related neurons were distributed almost evenly throughout the stride, while those of hindlimb-related neurons were concentrated in the swing phase, so the group of hindlimb-related cells was substantially more active during swing (Fig. 7).
This is the first investigation of the activity of the motor cortex during locomotion with and without light and thus the ability of subjects to see. Comparison of motor cortex population activity during locomotion in the darkness and light, both within this study (Figs. 6,7) and with data on locomotion in the light that were previously published [4, 6, 8, 35, 43, 55, 58] showed that they are largely similar. However, a comparison of activities of individual neurons during locomotion in the darkness and light revealed that the light has a significant effect on discharges of cells in the motor cortex. In 49% of neurons the mean discharge rate, depth of locomotion-related frequency modulation, width of PEF, and/or the number of PEFs were affected by the light (Figs. 8-10).
We believe that the differences in firing behavior of motor cortical neurons between the two lighting conditions are due to the differences in available visual information, not to a difference in the stride kinematics. We are confident in this assessment in part because during data analysis, we specifically selected and compared strides in the darkness and light that closely matched in duration and duty factor (Fig. 4A,B). In addition, the three-dimensional kinematics analysis showed that during these selected steps, the movements of the forepaw were similar (Fig. 4C) between the two conditions and only very minor differences existed in the movements of the scapula (Fig. 4D). Moreover, from six muscles tested, including three from the hindlimb, two did not show any appreciable differences in EMG timing or amplitude between the two lighting conditions, and four had only minor differences (Fig. 5). One may suggest that observed differences in neuronal discharges in the motor cortex during locomotion in the darkness and light reflect different levels of attention to the task by the animal in different conditions. While this cannot be completely ruled out within our experimental paradigm, we wish to note that during our testing, the main focus of subjects’ attention remained unchanged regardless of the illumination condition: cats’ behavior was driven solely by their desire to complete a round of walking around the chamber to receive a food reward.
The conclusion that the light and thus the ability to see, affects the activity of neurons in the motor cortex during locomotion is consistent with both anatomical data and previous reports on widespread distribution of visual responsiveness in frontal cortex in anesthetized or awake but paralyzed cats [31, 32, 60]. In particular, Weyand and colleagues [32], working with awake paralyzed cats, showed that in area 4γ, the area we recorded from, cells are reliably responsive to visual stimuli, and respond best to the light on/off stimulus. The motor cortex receives visual information via two groups of routes: cortical and subcortical. The input from the parietal cortex, areas 5 and 7, is typically viewed as the main avenue. Indeed, both of these areas respond strongly to visual stimuli and, especially area 5, project intensively to the motor cortex [16-18]. In our recent study, however, we found that neurons of layer III in area 5b, which are the only neurons projecting to the motor cortex from this area, have rather low activity during locomotion, both in terms of proportion of neurons involved (58%) as well as their average discharge rates (2.5 spikes/s) and have relatively similar activity during vision-independent locomotion on a flat surface and vision-involved locomotion along a horizontal ladder [61]. Therefore it appears unlikely that the rather sparse activity of visually unresponsive parietal-to-motor cortex projection is actually fit to assure quite pronounced visual responses in the motor cortex during locomotion. On the other hand, when we investigated locomotion-related activity of the ventrolateral thalamus, which links the motor cortex with the lateral cerebellum, we found that upon transition from a visually-independent to a visually-demanding locomotion task, the activity of 79% of neurons in the ventrolateral thalamus change [30]. The most typical changes were: an increase in the magnitude of the stride-related frequency modulation, a more precise focusing of the discharge in a particular phase of the stride, and a change in the number of PEFs per cycle. In addition, the average discharge rate of neurons in the ventrolateral thalamus is roughly twice as high as that of neurons in the motor cortex. Taking into account the rich visual inputs of the lateral cerebellum, from which the ventrolateral thalamus receives one of its main inputs [rev. in 29, 62], we concluded that the ventrolateral thalamus must play an important role in transmitting processed visual signals to the motor cortex.
Our finding that the mean discharge rate in 19% of motor cortical neurons, the depth of stride-related frequency modulation in 24%, the duration of the PEF in 19%, and/or the number of PEFs in 26% of them was different between walking in the darkness and light points to three mechanisms by which visual information can affect discharges in the motor cortex: a “tonic” mechanism of changing the average activity rate (19% of neurons), an “in-phase” mechanism of altering the magnitude of already existing activity modulation (24% of neurons), and an “out-of-phase” mechanism that alters the pattern of stride-related activity modulation by changing the duration of the PEF or even the number of PEFs (19% and 26% of neurons, respectively). The tonic mechanism was seen more often in the hindlimb-related neurons and typically reduced their discharge rate in the light. A reduction of cortical influence on the spinal hindlimb-related networks might render them more susceptible to other influences, including propriospinal inputs from forelimb-related circuits. This will make the hindlimbs “listen” more to what the forelimbs are doing when the cat walks in the light. The fact that the “out-of-phase” mechanism is so common suggests that the visual information received in the motor cortex during locomotion often fundamentally structures locomotion-related discharges of its neurons. For example, the activity of two-PEF neurons, which presumably discharged their second PEF in the darkness in response to an input from a second limb controller [63], was often depressed, their depth of frequency modulation enhanced, and their discharge pattern often re-written to a one-PEF pattern in the light (Figs 9G,H). In parallel, discharges of PTNs, with a one-PEF or two-PEF pattern alike, were shaped to become more locomotion-phase specific.
It was demonstrated in several studies that simple locomotion on a flat surface does not require participation of the motor cortex to be successful while locomotion over complex terrains strictly does [6, 14, 15, 64, 65, 66, 67]. We have previously suggested that the locomotion-related modulation of the activity of motor cortical neurons during simple locomotion has an informational character [6]. This modulation sets, for each individual neuron, the allowable phase of the cycle when, should a need arise, a descending influence is permissible. It thus allows the motor cortex to affect subcortical and spinal locomotor mechanisms during corrections of movements in complex situations without interruption of the on-going locomotor rhythm. Results of the current study show that these permissible time windows are adjusted based on the availability of visual information.
It has been previously shown that during some motor tasks the activity of selected subpopulations of the motor cortex does not correlate with the activity of muscles or movement mechanics and appears to have other control targets [e.g., 58, 68, 69, 70]. In addition to determining the allowable phase of the response during voluntary gait modifications as suggested above, another possible function of these neurons may be to contribute to the activation and reconfiguration of the brain stem–spinal locomotor networks. Such a function seems to be necessary when one considers the enormous variety of modifications to locomotion available to animals and humans. Among other possible functions, not related directly to the production of motor output, the motor cortical neurons could participate in the modulation of afferent signals’ transmission to different motor centers.
In addition to these possible roles of the activity of the motor cortex during locomotion, the fact that it took a step or two for the activity of about half of neurons to wear off the effect of the light when the lights were extinguished suggests that during locomotion the activity of neurons in the motor cortex may encode memories of the visual scene. It is interesting, however, that the activity of few cells that responded to visual stimuli at rest, during locomotion in the darkness was often step cycle-unrelated, and that these cells reacted inconsistently and rather weakly to introduction of the light. These observations suggest that these motor cortical neurons are members of a separate network, which is perhaps devoted to detection of particular visual features of the environment.
In conclusion, in this study we extend previous observations of visual responsiveness of cells in the motor cortex obtained in anesthetized and awake but paralyzed cats to freely walking cats, and demonstrate that during locomotion the responsiveness to light in the motor cortex is very common, typically stride phase-depended, and often significantly modifies the locomotion-related pattern of the activity observed during walking in the darkness.
How vision influences locomotion-related activity of motor cortex is unclear.
Activity of motor cortex neurons was compared between light & dark in walking cat.
The activity of 49% of neurons (n=146) was different between the two conditions.
Visual input plays a significant role in determining discharges in motor cortex.
Acknowledgments
The idea for this study was suggested by Dr. Alan R. Gibson. In addition, authors are indebted to Mr. Peter Wettenstein for his exceptional engineering assistance, and Mr. Neet Shah and Mr. Dan Griffiths for assistance with analyses. The research was supported by NIH grant R01 NS-058659 to INB.
Footnotes
Publisher's Disclaimer: This is a PDF file of an unedited manuscript that has been accepted for publication. As a service to our customers we are providing this early version of the manuscript. The manuscript will undergo copyediting, typesetting, and review of the resulting proof before it is published in its final citable form. Please note that during the production process errors may be discovered which could affect the content, and all legal disclaimers that apply to the journal pertain.
REFERENCES
- 1.Georgopoulos AP, Kalaska JF, Caminiti R, Massey JT. On the relations between the direction of two-dimensional arm movements and cell discharge in primate motor cortex. J Neurosci. 1982;2:1527–1537. doi: 10.1523/JNEUROSCI.02-11-01527.1982. [DOI] [PMC free article] [PubMed] [Google Scholar]
- 2.Kalaska JF. From intention to action: motor cortex and the control of reaching movements. Adv Exp Med Biol. 2009;629:139–178. doi: 10.1007/978-0-387-77064-2_8. [DOI] [PubMed] [Google Scholar]
- 3.Scott SH. Inconvenient truths about neural processing in primary motor cortex. J Physiol. 2008;586(5):1217–1224. doi: 10.1113/jphysiol.2007.146068. [DOI] [PMC free article] [PubMed] [Google Scholar]
- 4.Armstrong DM, Drew T. Discharges of pyramidal tract and other motor cortical neurons during locomotion in the cat. J Physiol. 1984a;346:471–495. doi: 10.1113/jphysiol.1984.sp015036. [DOI] [PMC free article] [PubMed] [Google Scholar]
- 5.Beloozerova IN, Sirota MG. Activity of neurons of the motosensory cortex during natural locomotion in the cat. Neurophysiologia. 1985;17:406–408. [PubMed] [Google Scholar]
- 6.Beloozerova IN, Sirota MG. The role of the motor cortex in the control of accuracy of locomotor movements in the cat. J Physiol. 1993a;461:1–25. doi: 10.1113/jphysiol.1993.sp019498. [DOI] [PMC free article] [PubMed] [Google Scholar]
- 7.Beloozerova IN, Farrell BJ, Sirota MG, Prilutsky BI. Differences in movement mechanics, electromyographic, and motor cortex activity between accurate and nonaccurate stepping. J Neurophysiol. 2010;103(4):2285–2300. doi: 10.1152/jn.00360.2009. [DOI] [PMC free article] [PubMed] [Google Scholar]
- 8.Drew T. Motor cortical activity during voluntary gait modifications in the cat. I. Cells related to the forelimbs. J Neurophysiol. 1993;70(1):179–199. doi: 10.1152/jn.1993.70.1.179. [DOI] [PubMed] [Google Scholar]
- 9.Yakovenko S, Krouchev N, Drew T. Sequential activation of motor cortical neurons contributes to intralimb coordination during reaching in the cat by modulating muscle synergies. J Neurophysiol. 2011;105(1):388–409. doi: 10.1152/jn.00469.2010. [DOI] [PubMed] [Google Scholar]
- 10.Martin JH, Ghez C. Differential impairments in reaching and grasping produced by local inactivation within the forelimb representation of the motor cortex in the cat. Exp Brain Res. 1993;94:429–443. doi: 10.1007/BF00230201. [DOI] [PubMed] [Google Scholar]
- 11.Bastian AJ, Zackowski KM, Thach WT. Cerebellar ataxia: torque deficiency or torque mismatch between joints? J Neurophysiol. 2000;83(5):3019–3030. doi: 10.1152/jn.2000.83.5.3019. [DOI] [PubMed] [Google Scholar]
- 12.Beer RF, Dewald JP, Rymer WZ. Deficits in the coordination of multijoint arm movements in patients with hemiparesis: evidence for disturbed control of limb dynamics. Exp Brain Res. 2000;131(3):305–319. doi: 10.1007/s002219900275. [DOI] [PubMed] [Google Scholar]
- 13.Mihaltchev P, Archambault PS, Feldman AG, Levin MF. Control of double-joint arm posture in adults with unilateral brain damage. Exp Brain Res. 2005;163(4):468–486. doi: 10.1007/s00221-004-2202-9. [DOI] [PubMed] [Google Scholar]
- 14.Liddell EGT, Phillips CG. Pyramidal section in the cat. Brain. 1944;67:1–9. [Google Scholar]
- 15.Trendelenburg W. Untersuchungen über reizlose vorübergehende Aussaltung am Zentralnervensystem. III. Die extermitaten Region der Grosshirninde. Pflugers Archiv. 1911;137:515–544. [Google Scholar]
- 16.Babb RS, Waters RS, Asanuma H. Corticocortical connections to the motor cortex from the posterior parietal lobe (areas 5a, 5b, 7) in the cat demonstrated by the retrograde axonal transport of horseradish peroxidase. Exp Brain Res. 1984;54(3):476–484. doi: 10.1007/BF00235473. [DOI] [PubMed] [Google Scholar]
- 17.Andujar JE, Drew T. Organization of the projections from the posterior parietal cortex to the rostral and caudal regions of the motor cortex of the cat. J Comp Neurol. 2007;504(1):17–41. doi: 10.1002/cne.21434. [DOI] [PubMed] [Google Scholar]
- 18.Ghosh S. Comparison of the cortical connections of areas 4 gamma and 4 delta in the cat cerebral cortex. J Comp Neurol. 1997b;388(3):371–396. doi: 10.1002/(sici)1096-9861(19971124)388:3<371::aid-cne3>3.0.co;2-y. [DOI] [PubMed] [Google Scholar]
- 19.Symonds LL, Rosenquist AC, Edwards SB, Palmer LA. Projection of the pulvinar lateral posterior complex to visual cortical areas in the cat. Neuroscience. 1981;6:1995–2020. doi: 10.1016/0306-4522(81)90039-7. [DOI] [PubMed] [Google Scholar]
- 20.Hyvarinen J. Studies of Brain function. Vol. 8. Springer-Verlag; Berlin, Heidelberg, New York: 1982. The Parietal Cortex of Monkey and Man. [Google Scholar]
- 21.Niimi K, Matsuoka H, Yamazaki Y, Katayama T. Thalamic afferents to the anterior and middle suprasylvian gyri in the cat traced with horseradish peroxidase. J Hirnforsh. 1983;24:173–187. [PubMed] [Google Scholar]
- 22.Avendano C, Rausell E, Reinoso-Suarez F. Thalamic projections to areas 5a and 5b of the parietal cortex in the cat: a retrograde horseradish peroxidase study. J Neurosci. 1985;5(6):1446–1470. doi: 10.1523/JNEUROSCI.05-06-01446.1985. [DOI] [PMC free article] [PubMed] [Google Scholar]
- 23.Avendano C, Rausell E, Perez-Aguilar D, Isorna S. Organization of the association cortical afferent connections of area 5: a retrograde tracer study in the cat. J Comp Neurol. 1988;278(1):1–33. doi: 10.1002/cne.902780102. [DOI] [PubMed] [Google Scholar]
- 24.Divac I, Lavail JH, Rakic P, Winston KR. Heterogeneous afferents to the inferior parietal lobule of the rhesus monkey revealed by the retrograde transport method. Brain Res. 1977;123(2):197–207. doi: 10.1016/0006-8993(77)90474-7. [DOI] [PubMed] [Google Scholar]
- 25.Robertson RT. Thalamic projections to parietal cortex. Brain Behav Evol. 1977;14(3):161–84. doi: 10.1159/000125659. [DOI] [PubMed] [Google Scholar]
- 26.Olson CR, Lawler K. Cortical and subcortical afferent connections of a posterior division of feline area 7 (area 7p). J Comp Neurol. 1987;259(1):13–30. doi: 10.1002/cne.902590103. [DOI] [PubMed] [Google Scholar]
- 27.Symonds LL, Rosenquist AC. Corticocortical connections among visual areas in the cat. J Comp Neurol. 1984;229(1):1–38. doi: 10.1002/cne.902290103. [DOI] [PubMed] [Google Scholar]
- 28.Cerminara NL, Edge AL, Marple-Horvat DE, Apps R. The lateral cerebellum and visuomotor control. Prog Brain Res. 2005;148:213–226. doi: 10.1016/S0079-6123(04)48018-2. [DOI] [PubMed] [Google Scholar]
- 29.Stein JF, Glickstein M. Role of the cerebellum in visual guidance of movement. Physiol Rev. 1992;72:967–1017. doi: 10.1152/physrev.1992.72.4.967. [DOI] [PubMed] [Google Scholar]
- 30.Marlinski V, Nilaweera WU, Zelenin PV, Sirota MG, Beloozerova IN. Signals from the ventrolateral thalamus to the motor cortex during locomotion. J Neurophysiol. 2012;107(1):455–472. doi: 10.1152/jn.01113.2010. [DOI] [PMC free article] [PubMed] [Google Scholar]
- 31.Garcia-Rill E, Dubrovsky B. Responses of motor cortex cells to visual stimuli. Brain Res. 1974;82(2):185–194. doi: 10.1016/0006-8993(74)90597-6. [DOI] [PubMed] [Google Scholar]
- 32.Weyand TG, Updyke BV, Gafta AC. Widespread distribution of visual responsiveness in frontal, prefrontal, and prelimbic areas of the cat: an electrophysiologic investigation. J Comp Neurol. 1999;405:99–127. [PubMed] [Google Scholar]
- 33.Martin JH, Ghez C. Task-related coding of stimulus and response in cat motor cortex. Exp Brain Res. 1985;57:427–442. doi: 10.1007/BF00237829. [DOI] [PubMed] [Google Scholar]
- 34.Armer MC, Nilaweera WU, Dasgupta NM, Rivers TJ, Beloozerova IN. Program No. 802.04. 2011 Neuroscience Meeting Planner. Society for Neuroscience; Washington, DC: 2011. Walking in the light: Responses of motor cortical neurons. Online. [Google Scholar]
- 35.Prilutsky BI, Sirota MG, Gregor RJ, Beloozerova IN. Quantification of motor cortex activity and full-body biomechanics during unconstrained locomotion. J Neurophysiol. 2005;94(4):2959–2969. doi: 10.1152/jn.00704.2004. [DOI] [PubMed] [Google Scholar]
- 36.Pryor K. Lads before the wind. Harper and Row; New York: 1975. [Google Scholar]
- 37.Skinner BF. The Behavior of Organisms. Appleton-Century-Crofts Inc.; 1938. [Google Scholar]
- 38.Guenther E, Zenner E. The spectral sensitivity of dark- and light-adapted cat retinal ganglion cells. J Neurosci. 1993;13(4):1543–1550. doi: 10.1523/JNEUROSCI.13-04-01543.1993. [DOI] [PMC free article] [PubMed] [Google Scholar]
- 39.Reitboeck HJ. Fiber microelectrodes for electrophysiological recordings. J Neurosci Methods. 1983;8:249–262. doi: 10.1016/0165-0270(83)90038-9. [DOI] [PubMed] [Google Scholar]
- 40.Bishop PO, Burke W, Davis R. The identification of single units in central visual pathways. J Physiol. 1962;162:409–431. doi: 10.1113/jphysiol.1962.sp006942. [DOI] [PMC free article] [PubMed] [Google Scholar]
- 41.Fuller JH, Schlag J. Determination of antidromic excitation by the collision test: problems of interpretation. Brain Res. 1976;122:283–298. doi: 10.1016/0006-8993(76)90284-5. [DOI] [PubMed] [Google Scholar]
- 42.Takahashi K. Slow and fast groups of pyramidal tract cells and their respective membrane properties. J Neurophysiol. 1965;28(5):908–924. doi: 10.1152/jn.1965.28.5.908. [DOI] [PubMed] [Google Scholar]
- 43.Armstrong DM, Drew T. Topographical localization in the motor cortex of the cat for somatic afferent responses and evoked movements. J Physiol. 1984b;350:33–54. doi: 10.1113/jphysiol.1984.sp015187. [DOI] [PMC free article] [PubMed] [Google Scholar]
- 44.Armstrong DM, Drew T. Electromyographic responses evoked in muscles of the forelimb by intracortical stimulation in the cat. J Physiol. 1985b;367:309–326. doi: 10.1113/jphysiol.1985.sp015826. [DOI] [PMC free article] [PubMed] [Google Scholar]
- 45.Armstrong DM, Drew T. Forelimb electromyographic responses to motor cortex stimulation during locomotion in the cat. J Physiol. 1985a;367:327–351. doi: 10.1113/jphysiol.1985.sp015827. [DOI] [PMC free article] [PubMed] [Google Scholar]
- 46.Nieoullon A, Rispal-Padel L. Somatotopic localization in cat motor cortex. Brain Res. 1976;105:405–422. doi: 10.1016/0006-8993(76)90590-4. [DOI] [PubMed] [Google Scholar]
- 47.Phillips CG, Porter R. Corticospinal neurons. Their role in movement. Monogr Physiol Soc. 1977;(34):v–xii. 1–450. [PubMed] [Google Scholar]
- 48.Vicario DS, Martin JH, Ghez C. Specialized subregions in the cat motor cortex: a single unit analysis in the behaving animal. Exp Brain Res. 1983;51:351–367. [Google Scholar]
- 49.Batshelet E. Circular statistics in biology. Academic Press; New York: 1981. [Google Scholar]
- 50.Fisher NI. Statistical analysis of circular data. University Press; Cambridge, MA: 1993. [Google Scholar]
- 51.Drew T, Doucet S. Application of circular statistics to the study of neuronal discharge during locomotion. J Neurosci Methods. 1991;38:171–181. doi: 10.1016/0165-0270(91)90167-x. [DOI] [PubMed] [Google Scholar]
- 52.Beloozerova IN, Sirota MG, Swadlow HA. Activity of different classes of neurons of the motor cortex during locomotion. J Neurosci. 2003;23(3):1087–1097. doi: 10.1523/JNEUROSCI.23-03-01087.2003. [DOI] [PMC free article] [PubMed] [Google Scholar]
- 53.Sirota MG, Swadlow HA, Beloozerova IN. Three channels of corticothalamic communication during locomotion. J Neurosci. 2005;25:5915–5925. doi: 10.1523/JNEUROSCI.0489-05.2005. [DOI] [PMC free article] [PubMed] [Google Scholar]
- 54.Efron B, Tibshirani RJ. An introduction to the bootstrap. Chapman & Hall; New York: 1993. [Google Scholar]
- 55.Stout EE, Beloozerova IN. Pyramidal tract neurons receptive to different forelimb joints act differently during locomotion. J Neurophysiol. 2012;107:1890–1903. doi: 10.1152/jn.00650.2011. [DOI] [PMC free article] [PubMed] [Google Scholar]
- 56.Ghosh S. Identification of motor areas of the cat cerebral cortex based on studies of cortical stimulation and corticospinal connections. J Comp Neurol. 1997a;380:191–214. doi: 10.1002/(sici)1096-9861(19970407)380:2<191::aid-cne4>3.0.co;2-z. [DOI] [PubMed] [Google Scholar]
- 57.Hassler R, Muhs-Clement K. Architektonischer Aufbau des sensorimotorischen und parietalen Cortex der Katz. J Hirnforsh. 1964;6:377–420. [PubMed] [Google Scholar]
- 58.Beloozerova IN, Sirota MG. The role of the motor cortex in the control of vigour of locomotor movements in the cat. J Physiol. 1993b;461:27–46. doi: 10.1113/jphysiol.1993.sp019499. [DOI] [PMC free article] [PubMed] [Google Scholar]
- 59.Widajewicz W, Kably B, Drew T. Motor cortical activity during voluntary gait modifications in the cat. II. Cells related to the hindlimbs. J Neurophysiol. 1994;72(5):2070–2089. doi: 10.1152/jn.1994.72.5.2070. [DOI] [PubMed] [Google Scholar]
- 60.Garcia-Rill E, Dubrovsky B. Organization of visual input in cat motosensory cortex. Exp Neurol. 1971;3:597–606. doi: 10.1016/0014-4886(71)90130-0. [DOI] [PubMed] [Google Scholar]
- 61.Beloozerova IN, Nilaweera WU, Viana di Prisco G, Sirota MG, Marlinski V. Program No. 803.08. 2011 Neuroscience Meeting Planner. Society for Neuroscience; Washington, DC: 2011. Sparse locomotion-related activity of cortico-cortical projection from parietal area 5 to motor cortex. Online. [Google Scholar]
- 62.Glickstein M. How are visual areas of the brain connected to motor areas for the sensory guidance of movement? Trends Neurosci. 2000;23:613–617. doi: 10.1016/s0166-2236(00)01681-7. [DOI] [PubMed] [Google Scholar]
- 63.Zelenin PV, Deliagina TG, Orlovsky GN, Karayannidou A, Dasgupta NM, Sirota MG, Beloozerova IN. Contribution of different limb controllers to modulation of motor cortex neurons during locomotion. J Neurosci. 2011;31(12):4636–4649. doi: 10.1523/JNEUROSCI.6511-10.2011. [DOI] [PMC free article] [PubMed] [Google Scholar]
- 64.Chambers WWV, Liu CN. Corticospinal tract of the cat. An attempt to correlate the pattern of degeneration with deficit in reflex act following neocortical lesions. J Com. Neurol. 1957;108:23–26. doi: 10.1002/cne.901080103. [DOI] [PubMed] [Google Scholar]
- 65.Drew T, Jiang W, Kably B, Lavoie S. Role of the motor cortex in the control of visually triggered gait modifications. Can J Physiol Pharmacol. 1996;74(4):426–442. [PubMed] [Google Scholar]
- 66.Friel KM, Drew T, Martin JH. Differential activity-dependent development of corticospinal control of movement and final limb position during visually guided locomotion. J Neurophysiol. 2007;97(5):3396–3406. doi: 10.1152/jn.00750.2006. [DOI] [PMC free article] [PubMed] [Google Scholar]
- 67.Metz GA, Whishaw IQ. Cortical and subcortical lesions impair skilled walking in the ladder rung walking test: a new task to evaluate fore- and hindlimb stepping, placing, and co-ordination. J Neurosci Methods. 2002;115(2):169–179. doi: 10.1016/s0165-0270(02)00012-2. [DOI] [PubMed] [Google Scholar]
- 68.Beloozerova IN, Sirota MG, Orlovsky GN, Deliagina TG. Activity of pyramidal tract neurons in the cat during postural corrections. J Neurophysiol. 2005;93(4):1831–1844. doi: 10.1152/jn.00577.2004. [DOI] [PubMed] [Google Scholar]
- 69.Beloozerova IN, Sirota MG, Orlovsky GN, Deliagina TG. Comparison of activity of individual pyramidal tract neurons during balancing, locomotion, and scratching. Behav Brain Res. 2006;169(1):98–110. doi: 10.1016/j.bbr.2005.12.009. [DOI] [PubMed] [Google Scholar]
- 70.Kurtzer I, Herter TM, Scott SH. Random change in cortical load representation suggests distinct control of posture and movement. Nat Neurosci. 2005;8(4):498–504. doi: 10.1038/nn1420. [DOI] [PubMed] [Google Scholar]