

Abstract
Breast cancers that are negative for estrogen receptor α (ERα), progesterone receptor, and human epidermal growth factor receptor 2 are known as triple-negative breast cancers (TNBC). TNBCs are associated with an overall poor prognosis because they lack expression of therapeutic targets like ERα and are biologically more aggressive. A second estrogen receptor, ERβ, has been found to be expressed in 50% to 90% of ERα-negative breast cancers, and ERβ expression in TNBCs has been shown to correlate with improved disease-free survival and good prognosis. To elucidate the role of ERβ in regulating gene expression and cell proliferation in TNBC cells, the TNBC cell line MDA-MB-468 was engineered with inducible expression of full-length ERβ. In culture, ERβ expression inhibited cell growth by inducing a G1 cell cycle arrest, which was further enhanced by 17β-estradiol treatment. In xenografts, ERβ expression also inhibited tumor formation and growth, and 17β-estradiol treatment resulted in rapid tumor regression. Furthermore, genomic RNA sequencing identified both ligand-dependent and -independent ERβ target genes, some of which were also regulated by ERβ in other TNBC cell lines and correlated with ERβ expression in a cohort of TNBCs from the Cancer Genome Atlas Network. ERβ target genes were enriched in genes that regulate cell death and survival, cell movement, cell development, and growth and proliferation, as well as genes involved in the Wnt/β-catenin and the G1/S cell cycle phase checkpoint pathways. In addition to confirming the anti-proliferative effects of ERβ in TNBC cells, these data provide a comprehensive resource of ERβ target genes and suggest that ERβ may be targeted with ligands that can stimulate its growth inhibitory effects.
Estrogen signaling is primarily mediated by two estrogen receptors (ERs): ERα and ERβ. ERα is expressed in approximately 70% of breast cancers, and many of these cancers respond to endocrine therapies that block the proliferative action of ERα. However, approximately 15% to 20% of all breast cancers lack expression of ERα, its target gene progesterone receptor (PR), and human epidermal growth factor receptor 2 (HER2) and are clinically defined as triple-negative breast cancers (TNBCs). Full-length ERβ protein has been detected in 50% to 90% of ERα-negative breast cancers (1–4), and ERβ expression has been shown to correlate with improved disease-free survival and good prognosis in TNBC (2). Unlike ERα, for which PR expression is indicative of receptor expression and function, a target gene or gene set indicating ERβ functionality has yet to be identified.
Like ERα, ERβ is a nuclear receptor that regulates target gene expression in estrogen responsive tissues, such as the mammary gland. Multiple isoforms of ERβ may be expressed in the mammary gland, but the full-length receptor is the only isoform able to bind ligand with high affinity and regulate target gene expression (5, 6). Several studies have assessed the effects of full-length ERβ expression on the growth of ERα-positive breast cancer cells (7–11). The results of these studies demonstrate that ERβ expression inhibits the proliferative response mediated by ERα. Fewer reports have assessed the growth effects of ERβ expression in breast cancer cells that lack ERα, but ERβ expression in ERα-negative breast cancer cells has been shown to inhibit growth in ligand-independent and -dependent manners (12–15). This leads to the hypothesis that some ERα-negative breast cancers, including TNBCs, may benefit from therapies that target ERβ (16).
In regard to gene expression, even fewer studies have aimed to identify ERβ target genes in the absence of ERα. Microarray analyses comparing ERα and ERβ target genes in U2OS osteosarcoma cells (17) and Hs578T breast cancer cells (15) demonstrated that the two receptors have both overlapping and distinct target genes. However, only ligand-dependent ERβ target genes have been identified in ERα-negative breast cancer cells, and a comprehensive assessment of both ligand-independent and -dependent ERβ target genes in TNBC cells has not yet been completed.
In an effort to identify ERβ target genes globally in TNBC cells and assess the growth inhibition of ERβ expression in vitro and in vivo, we generated a TNBC cell line with inducible expression of full-length ERβ. We confirmed ERβ-mediated growth inhibition in vitro and in vivo and identified ERβ target genes using RNA sequencing. We further show that some of the ERβ target genes are associated with ERβ expression in a cohort of TNBCs. These data demonstrate the growth inhibitory properties of ERβ and provide a global view of ligand-independent and -dependent ERβ target genes in the absence of ERα expression. This study also provides a foundation to identify target genes further that may indicate ERβ functionality in TNBCs.
Materials and Methods
Cell culture and reagents
Cell culture media were obtained from Invitrogen. MDA-MB-468 cells were cultured in DMEM + 10% fetal bovine serum (FBS; Invitrogen), and BT549 and HCC1143 cells were cultured in RPMI 1640 + 10% FBS. HCC1143 breast cancer cells were obtained from the Leibniz Institute DSMZ, German Institute for Microorgansims and Cell Culture. All cells were cultured at 37°C and 5% CO2. MDA-MB-468-ERβ inducible cells were cultured in DMEM + 10% Tet-system approved FBS (Clontech Mountain View), 500 mg/L Zeocin, and 5 mg/L Blasticidin S (Research Products International). Before all experiments, MDA-MB-468-ERβ cells were cultured in phenol red free DMEM + 10% charcoal stripped FBS (SFS) for at least 3 days to remove residual estrogens. Doxycycline (Dox) was obtained from Clontech. The Flag and β-actin antibodies were obtained from Sigma-Aldrich, and the Hsp90 antibody was obtained from Santa Cruz Biotechnology. ICI 182,780 and ERB-041 were purchased from Tocris. All other reagents were purchased from Sigma Aldrich unless otherwise noted.
Generation of MDA-MB-468-ERβ inducible cells
MDA-MB-468-ERβ inducible cells were created as previously described using the TRex system (Invitrogen) (15). Briefly, MDA-MB-468 cells were transfected with pcDNA6/TR, and a stable clone was selected after selection with 5 μg/mL Blasticidin S. The MDA-MB-468-Tet cells were then transfected with pcDNA4/TO-ERβ, which encodes the 530 amino acids. full-length ERβ isoform, and selected with 500 μg/mL Zeocin. Stable clones were selected and screened for inducible expression of ERβ using Western blotting with Flag antibody.
Ligand binding assays and Western blots
Ligand binding assays were performed as previously described with slight modification (18). Briefly, 2 × 10⁵ MDA-MB-468-ERβ cells were seeded in a 24-well plate and treated with vehicle or 50 ng/mL Dox. After 48 hours, cells were incubated with 20 nM radiolabeled [3H]-E2 (89.2 Ci/mmol specific activity; Perkin Elmer) in the presence or absence of 450 nM diethylstilbestrol cold competitor. After a 2-hour incubation, cells were washed and lysed and the retained radioactivity was determined using a liquid scintillation counter.
To assess ERβ expression using Western blots, MDA-MB-468-ERβ cells were treated with the corresponding Dox concentrations for the given amount of time. Cells were then washed in PBS and lysed as previously described (18). After separation by SDS-PAGE and transfer to a nitrocellulose membrane, the membrane was incubated with the corresponding antibody and visualized by enhanced chemiluminescence on a Chemidoc XRS system (BioRad) or by fluorescence detection on a Licor Odyssey gel reader (Licor Biosciences) as previously described (18).
Phalloidin staining
MDA-MB-468 ERβ#18 cells were maintained in DMEM supplemented with 10% stripped FBS for 3 days. The cells were then cultured in DMEM + 5% SFS with or without Dox to induce ERβ expression. After 24 hours, the cells were treated with or without 10 nM E2. Forty-eight hours before immunostaining, the cells were seeded onto coverslips in a 6-well plate. After 5 days of treatment, the cells were fixed in 4% formaldehyde for 15 minutes, and the coverslips were washed three times in PBS. Alexa Fluor 555 Phalloidin (Cell Signaling Technology) was diluted 1:20 (6.6 μM stock concentration in methanol) in PBS and added to the cells. After 15 minutes incubation at room temperature, coverslips were washed once with PBS. The coverslips were mounted in ProLong Gold antifade reagent with 4′,6-diamidino-2-phenylindole (Invitrogen). Fluorescence was detected using a Leica DM5000B microscope (Buffalo Grove) with the appropriate wavelengths.
Cell proliferation and cell cycle assays
For cell proliferation assays, 1 × 10⁵ MDA-MB-468-ERβ cells were seeded in triplicate onto 6-well plates in DMEM + 5% SFS. After 24 hours, cells were treated with vehicle or 50 ng/mL Dox for 24 hours. Cells were then treated with the corresponding ligands or 0.1% DMSO for the given amount of time. Media were refreshed every 48 hours. Cells were trypsinized and counted after trypan blue exclusion using an automated cell counter (BioRad) according to the manufacturer's protocol.
To assess the cell cycle distribution, 3 × 10⁵ MDA-MB-468-ERβ cells were seeded in triplicate onto 6-cm plates in DMEM + 5% SFS. After 24 hours, the cells were treated with vehicle or 50 ng/mL Dox for 24 hours followed by treatment with 0.15% DMSO or the corresponding ligands for 72 hours. Cells were collected by trypsinization, fixed in cold 95% ethanol, and washed in PBS. The fixed cells were then resuspended in propidium iodide staining solution (200 μg/mL RNase A, 50 μg/mL propidium iodide, 0.1% [v/v] Triton X-100 in PBS + 1% BSA) and incubated overnight at 4°C. Samples were analyzed by flow cytometry at the University of Wisconsin Flow Cytometry Laboratory.
Xenograft experiments
All animal work was performed in accordance with protocols approved by the Animal Care and Use Committee of the University of Wisconsin-Madison. 468-ERβ#18 cells were infected with retrovirus generated from a pLNCX-FLuc (firefly luciferase) vector. Cells were then cultured in regular media containing 400 μg/mL G418 (Invitrogen) for at least eight passages to generate luciferase-labeled 468-ERβ#18 cells. To assess the effects of ERβ expression on tumorigenicity, 2 × 10⁶ luciferase-labeled 468-ERβ#18 cells were injected bilaterally into the inguinal mammary fat pads of 5- to 6-week-old ovariectomized athymic nude-Foxn1nu mice (n = 4 per group). Mice were given control diets or Dox-containing diets (2000 ppm) obtained from Harlan Laboratories immediately after the injections. To assess tumor regression in response to E2, 2 × 10⁶ luciferase-labeled 468-ERβ#18 cells were injected as described above, and the tumors were allowed to form in the absence of Dox for 10 weeks. On day 0, a 60-day release 0.05 mg E2 pellet (Innovative Research of America) was implanted into each mouse. Mice (n = 3 per group) were then separated randomly and given a control or Dox-containing diet. Luciferase-based noninvasive bioluminescent imaging and analysis were performed as previously described with an IVIS Imaging System (Caliper Life Sciences) (19). Briefly, mice were anesthetized and injected ip with 2 mg d-luciferin (10 mg/mL in PBS) (Gold Biotechnology). Imaging was completed between 15 and 20 minutes after injection. For bioluminescence plots, total photon flux was calculated for each mouse by using a circular region of interest.
RNA sequencing (RNA-seq) of ERβ target genes and pathway analysis
To identify ERβ target genes globally, 468-ERβ#18 cells were treated with vehicle or 50 ng/mL Dox for 48 hours followed by treatment with 0.1% DMSO or 10 nM E2 for 4 hours. Total RNA was extracted using a RNEasy Plus Kit according to manufacturer protocol (Qiagen), and three independent experiments were performed. The total RNA was submitted to the University of Wisconsin Biotechnology Center for RNA quality analysis, sequencing library generation, and sequencing. An Illumina HiSeq 2000 was used to generate 100-bp single-end reads. Reads were trimmed for quality (15 bp from the 5′ end and 2 bp from the 3′ end) and aligned to the University of California, Santa Cruz build hg19 genome using RNA sequencing expectation maximization (RSEM). It has now been well recognized that discarding RNA-seq reads that align to multiple genes introduces bias in expression estimates of gene families and genes containing or inside of repetitive elements (20–23). RSEM implements a principled and biologically motivated probabilistic model for this problem (20, 24). It is based on a generative model of the RNA-seq protocol that takes into account aspects such as sequencing error, fragment length distributions, and nonuniformities in the distribution of read locations along transcripts. The RSEM alignment results are presented in Supplemental Table 2, published on The Endocrine Society's Journals Online web site at http://mend.endojournals.org. For the identification of differentially expressed genes, the fractional counts were rounded to the nearest integer, and DESeq (25) was used to assess differentially expressed genes at a 1.5-fold change cutoff and a false discovery rate <0.01. The filtered gene lists for each comparison are provided in Supplemental Materials and Methods. The raw data will also be submitted to the Gene Expression Omnibus. Pathway enrichments and functional analyses of the gene lists were determined using ingenuity pathway analysis (IPA) software (Ingenuity Systems, www.ingenuity.com). The DESeq and IPA results for all comparisons are available in the Supplemental Materials and Methods.
Quantitative PCR
468-ERβ#18 cells were treated with DMSO, 10 nM E2, or 100 nM ERB-041 as described for the initial RNA-seq experiment. For validation in HCC1143 cells, the cells were infected with retrovirus generated from pLNCX-GFP or pLPCX-ERβ vectors. Twenty-four hours after infection, the media were replaced with phenol red free RPMI 1640 + 5% SFS. After an additional 24 hours, cells were treated with 0.1% DMSO or 10 nM E2 for 4 hours. Total RNA was extracted as described above and reverse-transcribed using Superscript II RT according to the manufacturer's protocol (Invitrogen). Quantitative PCR was performed using TaqMan Prime Time custom designed assays (IDT), FastStart Universal Probe Master Mix (Roche Scientific), and a CFX96 instrument (BioRad). Primer and probe sequences are shown in Supplemental Table 1. Data were analyzed using the ΔΔCq method calculated by CFX Manager Software (BioRad). Student t tests were performed with GraphPad Prism Software (Version 5.04; GraphPad Software Inc).
Correlation analysis of ERβ target genes and ERβ expression in human tumor samples
To compare the RNA sequencing results further with previous studies of TNBC, the Agilent mRNA expression microarray data from the Cancer Genome Atlas (TCGA) database, among which n = 43 samples were identified as TNBC, was examined to assess any correlations between the expression of ERβ and its target genes (26). Using all of the genes identified in the comparison of 468-ERβ#18 cells treated with E2 versus E2+Dox (comparison IV, Figure 5A) with false discovery rate <0.05, a total of 2472 genes were present in both the microarray data and our gene list. The correlation coefficient was calculated for the expression of each of the genes and that of ERβ based on the microarray data. To assess the strength of the correlation, the P values were calculated for a two-sided alternative that these correlation coefficients are significantly different from zero (meaning no correlation). To account for multiple testing, these P values were then converted to the so-called q values (27, 28). For those genes with q < .05 for the correlation and a fold change >1.5 in the RNA sequencing results, the correlation coefficient determined for the array data was graphed against the fold change observed for the gene in the 468-ERβ#18 cells treated with E2 versus E2+Dox.
Figure 5.
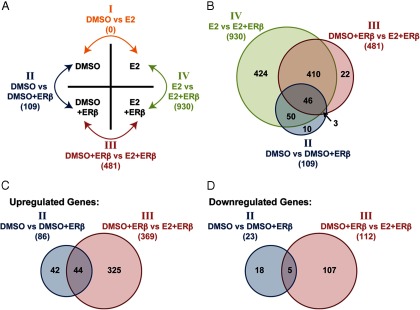
Global identification of ERβ target genes using RNA-seq. 468-ERβ#18 cells were treated with vehicle or Dox for 48 hours followed by treatment with DMSO or 10 nM E2 for 4 hours. Total RNA was extracted and sequenced as described in the Materials and Methods. Differentially expressed genes were identified using DESeq with a 1.5-fold change cutoff and a false discovery rate <0.01. (A) A matrix describing the four contrasts performed to identify differentially expressed genes. No genes were differentially expressed in the DMSO vs E2 group (I), 109 were differentially expressed in the comparison between DMSO vs DMSO+ERβ (II), 481 genes were differentially expressed between DMSO+ERβ vs E2+ERβ (III), and 930 genes were differentially expressed between E2 vs E2+ERβ (IV). (B) A Venn diagram showing the overlap among genes identified in the three groups. (C) A Venn diagram showing the overlap between the up-regulated genes identified in DMSO vs DMSO+ERβ and DMSO+ERβ vs E2+ERβ. Most ERβ target genes were up-regulated, and approximately half of the DMSO vs DMSO+ERβ genes were identified in DMSO+ERβ vs E2+ERβ. (D) A Venn diagram showing the overlap between the down-regulated genes identified in DMSO vs DMSO+ERβ and DMSO+ERβ vs E2+ERβ. Fewer ERβ target genes were down-regulated, and only five genes were identified in both groups.
Results
Inducible expression of ERβ and E2 treatment induces a G1 cell cycle arrest and inhibits the growth of MDA-MB-468 cells in vitro and in vivo
To assess the growth and gene expression effects of ERβ expression and activation in TNBC cells, MDA-MB-468 cells were engineered with inducible expression of full-length ERβ using the TRex system from Invitrogen. After creating MDA-MB-468-Tet cells, which express the tetracycline (Tet) repressor, these cells were transfected with a construct encoding Tet-operated full-length Flag-tagged ERβ. Two MDA-MB-468-ERβ clones with inducible ERβ expression were selected for further characterization (486-ERβ#18 and 468-ERβ#32). First, ERβ expression was assessed in response to increasing Dox concentrations (Figure 1A). As little as 5 ng/mL Dox treatment for 48 hours induced expression of the receptor, and subsequent in vitro experiments were performed with 50 ng/mL Dox. Next, a time course was established for the Dox-inducible expression of ERβ (Figure 1B). ERβ was maximally expressed after 24 hours, and this expression level was sustained after 48 hour and 72 hour treatments. Finally, the expression level was quantified using radiolabeled ligand binding assays (Figure 1C). After Dox treatment, both clones expressed approximately 90 000 receptors per cell, which is comparable to MCF7 breast cancer cells that express ∼150 000 ERα molecules per cell (18).
Figure 1.

MDA-MB-468-ERβ cells express ERβ after Dox treatment. Dox-dependent expression of ERβ was initially characterized in two MDA-MB-468-ERβ clones (468-ERβ#18 and 468-ERβ#32). (A) A Western blot using Flag antibody shows that both clones express detectable levels of ERβ after treatment with as little as 5 ng/mL Dox for 48 hours. Further in vitro studies were performed with 50 ng/mL Dox. (B) A Western blot using Flag antibody shows that treatment with 50 ng/mL Dox for as little as 4 hours induces expression of ERβ. (C) Ligand binding assays performed with radiolabeled E2 demonstrate that both clones express similar levels of ERβ corresponding to approximately 90 000 receptors/cell after 24 hours of Dox treatment. The data represent the mean and SD.
After confirming Dox-inducible expression of ERβ in 486-ERβ#18 and 468-ERβ#32 cells, we assessed the growth effects of ERβ expression and activation by 17β-estradiol (E2) (Figure 2A). The number of viable cells was significantly inhibited by ERβ expression and E2 treatment for both clones. 468-ERβ#18 showed slight growth inhibition when ERβ was expressed in the absence of ligand. Dox and E2 treatment had no effect on the growth of MDA-MB-468-Tet cells (Supplemental Figure 1). To confirm that the growth inhibitory effects observed in MDA-MB-468-ERβ cells were mediated by ERβ, 468-ERβ#18 cells were treated with vehicle or Dox and DMSO or E2 in the presence or absence of the antagonist ICI 182,780 (ICI) or the selective estrogen receptor modulator 4-hydroxytamoxifen (4-OH Tam) (Figure 2B). Dox treatment alone significantly inhibited the growth of 468-ERβ#18 cells, and this effect was rescued by ICI or 4-OH Tam co-treatment. Treatment with E2 further inhibited the growth of the cells, and this inhibition was also rescued by ICI or 4-OH Tam co-treatment. The ERβ-selective ligand, ERB-041 (29), also inhibited cell growth similar to E2 (Supplemental Figure 2). Interestingly, the morphology of the cells was altered after 5 days of treatment with Dox and E2 (Figure 2C), suggesting that the cells may have undergone some type of cell cycle arrest. Indeed, an analysis of the cell cycle phase distribution by flow cytometry revealed an increase in the proportion of cells in the G1 phase after Dox treatment alone, which was further increased by E2 treatment (Figure 2D). ERβ expression and ligand treatment did not induce detectable levels of apoptosis (data not shown).
Figure 2.
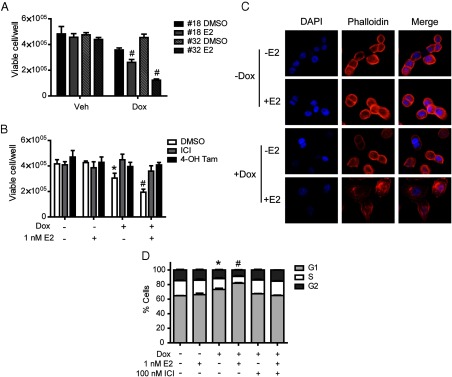
ERβ expression and E2 treatment inhibit the growth of MDA-MB-468-ERβ cells. (A) Two MDA-MB-468-ERβ clones (#18 and #32) were treated in triplicate with vehicle or Dox for 24 hours followed by treatment with DMSO or 1 nM E2. The total number of viable cells was determined using trypan blue exclusion after the given number of days. *, P < .01 compared to DMSO control; #, P < .01 compared to DMSO+Dox control. (B) Treatment with ER antagonists rescue the growth inhibition mediated by ERβ. 468-ERβ#18 cells were treated in triplicate with vehicle or Dox for 24 hours followed by treatment with DMSO or E2 in the presence or absence of 100 nM ICI or 4-OH Tam. The total number of viable cells was determined by trypan blue exclusion after 5 days. *, P < .01 compared to DMSO control; #, P < .01 compared to DMSO+Dox control. (C) ERβ expression and E2 treatment alter the morphology of the 468-ERβ#18 cells. Cells were treated with vehicle or Dox for 24 hours followed by treatment with DMSO or E2 for 5 days and subsequently stained with Alexa Fluor 555 Phalloidin (red), which stains actin filaments to highlight the cytoplasm, and 4′,6-diamidino-2-phenylindole (blue) for nuclear staining. (D) ERβ expression and E2 treatment induce a G1 cell cycle arrest. 468-ERβ#18 cells were treated in triplicate with vehicle or Dox for 24 hours followed by treatment with DMSO or E2 in the presence or absence of 100 nM ICI for 72 hours. The proportion of cells in each phase of the cell cycle was determined using flow cytometry as described in the Materials and Methods. For the proportion of cells in G1; *, P < .01 compared to DMSO control; #, P < .01 compared to DMSO+Dox control. The data represent the mean and SD.
Next, we aimed to assess the effects of ERβ expression and activation on tumor growth of MDA-MB-468 cells. First, soft agar colony formation assays revealed that ERβ expression alone completely blocked the formation of colonies (Supplemental Figure 3). Xenograft experiments were then performed using 468-ERβ#18 cells retrovirally labeled with luciferase to monitor tumor growth by bioluminescence imaging (Figure 3). After injecting cells into the mammary fat pads, the mice were given a control diet or a Dox-containing diet, and the tumor size was monitored using bioluminescence imaging (Figure 3A). In the presence of Dox, the growth of the tumors was reduced and one mouse did not develop tumors (Figure 3, A and B). The final tumor volume was significantly smaller when ERβ was expressed (Figure 3C), and Dox treatment had no effect on the growth of control MDA-MB-468-Tet tumors (Supplemental Figure 4). To assess the effects of ERβ expression and activation on tumor growth, luciferase-labeled 468-ERβ#18 cells were allowed to form tumors for 10 weeks. Mice were then implanted with a slow release E2 pellet and given a control or Dox-containing diet. The tumors rapidly regressed only when ERβ was expressed (Figure 4). These data demonstrate the growth inhibitory effects of ERβ expression and activation in TNBC cells in vivo.
Figure 3.

ERβ expression inhibits tumor growth in xenografts. (A) 468-ERβ#18 cells were labeled with luciferase and injected into the mammary fat pads of nude mice (n = 4 per group). Mice were then provided a control or Dox-containing diet. The tumor growth was monitored using bioluminescence imaging as described in the Materials and Methods. (B) Quantitative plot of bioluminescence for each group over time. (C) Final tumor volumes for each group. The data represent the mean and SEM of the tumors from each group. *, P < .05 compared to control.
Figure 4.

Activation of ERβ in xenografts causes tumor regression. (A) 468-ERβ#18 cells were labeled with luciferase and injected into the mammary fat pads of nude mice. After allowing tumors to form for 10 weeks, slow release E2 pellets were implanted into each mouse. Mice were separated into two groups (n = 3 per group) and provided a control or Dox-containing diet. The tumor growth was monitored using bioluminescence imaging and caliper measurements as described in the Materials and Methods. (B) Quantitative plot of bioluminescence for each group over time. The data represent the mean and SEM of the tumors from each group. (C) Quantitative plot of tumor size as determined by caliper measurements for each group over time. The data represent the mean and SEM of the tumors from each group. *, P < .05 compared to control.
ERβ target gene identification using RNA-seq
The MDA-MB-468-ERβ inducible cells are useful for identifying the ligand-independent and ligand-dependent target genes of ERβ in the absence of ERα. To identify direct ERβ target genes, 468-ERβ#18 cells were treated with or without Dox followed by treatment with E2 for 4 hours. RNA-seq was subsequently performed as described in the Materials and Methods. Reads were aligned using RSEM (20), and the results of the alignment are shown in Supplemental Table 2. Differentially expressed genes were determined for the four conditions by DESeq (25) (Figure 5A, 1.5-fold change cutoff). No genes were differentially expressed after E2 treatment in the absence of ERβ (DMSO vs E2, comparison I), confirming that MDA-MB-468 cells are not estrogen responsive. Only 109 genes were differentially expressed after Dox treatment (DMSO vs DMSO+ERβ, comparison II), whereas 481 genes were differentially expressed after E2 treatment in the presence of ERβ (DMSO+ERβ vs E2+ERβ, comparison III), suggesting that most ERβ target genes are ligand-dependent in these cells. The top genes regulated in comparisons II and III are shown in Tables 1 and 2, respectively. A comparison of E2 treatment with or without Dox (E2 vs E2+ERβ, comparison IV) revealed 930 differentially expressed genes, potentially capturing the total change in gene expression in response to both ERβ expression and activation by E2. The top genes in this comparison are shown in Table 3.
Table 1.
Most Highly Up-regulated and Down-regulated Genes in the DMSO vs DMSO+ERβ Comparison
| Up-regulated Genes |
Down-regulated Genes |
||
|---|---|---|---|
| Gene Symbol | Fold Change | Gene Symbol | Fold Change |
| ESR2 | 92.93 | TMEM189-UBE2V1 | 0.25 |
| FGF19 | 44.42 | ACER1 | 0.26 |
| PDZK1 | 13.76 | NOV | 0.32 |
| SCGB2A2 | 10.70 | ADAMTS5 | 0.41 |
| THRSP | 9.25 | CTGF | 0.43 |
| EPHA8 | 8.11 | NDRG1 | 0.49 |
| RBP3 | 7.55 | KDR | 0.52 |
| CA12 | 6.28 | KRT6B | 0.54 |
| CYP2A13 | 5.60 | NTRK2 | 0.55 |
| MAPK4 | 5.04 | KRT14 | 0.57 |
| CD34 | 4.77 | IGFBP3 | 0.57 |
| KCNK15 | 4.73 | CLIC5 | 0.58 |
| CYP2B7P1 | 4.10 | MAOA | 0.59 |
| C3 | 3.69 | FOXQ1 | 0.59 |
| ST8SIA6 | 3.57 | SYTL4 | 0.59 |
| S100A7A | 3.49 | KRT16 | 0.61 |
| MGAT3 | 3.42 | CASP14 | 0.61 |
| S100A7 | 3.39 | PPP1R3C | 0.62 |
| ANPEP | 3.31 | SMOC1 | 0.63 |
| TMEM229B | 3.04 | KRT17 | 0.63 |
Table 2.
Most Highly Up-regulated and Down-regulated Genes in the DMSO+ERβ vs E2+ERβ Comparison
| Up-regulated Genes |
Down-regulated Genes |
||
|---|---|---|---|
| Gene Symbol | Fold Change | Gene Symbol | Fold Change |
| EGR3 | 43.43 | ADAMTS5 | 0.13 |
| OTOF | 34.18 | CHRM1 | 0.25 |
| SHISA2 | 26.24 | ADAMTS1 | 0.27 |
| ASB2 | 18.22 | LOC152225 | 0.29 |
| PTH1R | 17.93 | STON1 | 0.33 |
| CYTH4 | 15.16 | SOX11 | 0.34 |
| LOC100507584 | 14.34 | RASSF10 | 0.36 |
| BSND | 14.19 | KLHL38 | 0.39 |
| TMIE | 10.74 | ARL4A | 0.40 |
| ENPP2 | 10.51 | ARID5B | 0.41 |
| LOXL4 | 9.85 | ABCA1 | 0.42 |
| IP6K3 | 8.89 | JAG1 | 0.42 |
| PDK4 | 8.80 | VAV3 | 0.42 |
| FAM25A | 8.65 | FAM84A | 0.44 |
| HAND1 | 8.13 | SERTAD4 | 0.44 |
| A4GALT | 8.13 | PPP1R3C | 0.44 |
| WISP2 | 7.88 | RDH10 | 0.44 |
| VWF | 7.67 | PPP1R3C | 0.62 |
| THRSP | 7.65 | SMOC1 | 0.63 |
| CABP7 | 6.75 | KRT17 | 0.63 |
Table 3.
Most Highly Up-regulated and Down-regulated Genes in the E2 vs E2+ERβ Comparison
| Up-regulated Genes |
Down-regulated Genes |
||
|---|---|---|---|
| Gene Symbol | Fold Change | Gene Symbol | Fold Change |
| ISM1 | 99.57 | ADAMTS5 | 0.06 |
| FGF19 | 95.53 | STON1 | 0.15 |
| EGR3 | 85.29 | DKK1 | 0.16 |
| WISP2 | 69.21 | ADAMTS1 | 0.16 |
| ESR2 | 65.01 | CHRM1 | 0.20 |
| THRSP | 54.88 | HRCT1 | 0.23 |
| CYTH4 | 53.59 | GRIN2A | 0.23 |
| OTOF | 51.63 | KLHL38 | 0.24 |
| ENPP2 | 39.12 | NOV | 0.24 |
| SCGB3A1 | 36.32 | PPP1R3C | 0.25 |
| CD34 | 29.79 | SOX11 | 0.25 |
| PDLIM4 | 27.72 | IL8 | 0.26 |
| ANGPTL2 | 26.90 | FGF1 | 0.26 |
| PGLYRP2 | 26.83 | RASSF10 | 0.27 |
| LOC727710 | 25.48 | FOXQ1 | 0.28 |
| SHISA2 | 25.25 | SHROOM2 | 0.28 |
| CRB2 | 25.05 | ARL4A | 0.28 |
| TMIE | 24.75 | ACER1 | 0.28 |
| FOXN1 | 24.04 | FAM105A | 0.29 |
| MGAT3 | 23.58 | IGFBP3 | 0.29 |
Most of the genes in comparisons II and III were captured in comparison IV (Figure 5B). In addition, most genes identified in comparisons II and III were up-regulated, and about half of the potentially ligand-independent genes (comparison II) were also regulated in a ligand-dependent manner (Figure 5C). Fewer genes were found to be down-regulated (Figure 5D). Several genes were validated by quantitative PCR in a new set of biological replicates of 468-ERβ#18 cells treated with vehicle or Dox followed by DMSO or E2 for 4 hours. Two ligand-independent genes were confirmed (CTGF and C3; Figure 6A) and three ligand-dependent genes were confirmed (SDC1, CDH1, and DKK1; Figure 6B). Four genes regulated in both a ligand-dependent and a ligand-independent manner were also validated (WNT4, THRSP, CABLES1, and S100A7; Figure 6C). Importantly, the expression of several ERβ target genes was assessed in MDA-MB-468-Tet cells treated with vehicle or Dox, and none of the genes were regulated by Dox in the absence of ERβ expression (Supplemental Figure 5). In addition, the ERβ-selective ligand ERB-041 was found to regulate ERβ target genes similar to E2 (Figure 7, A and B).
Figure 6.

Validation of ERβ target genes in 468-ERβ#18 cells. 468-ERβ#18 cells were treated with vehicle or Dox for 48 hours followed by treatment with DMSO or 10 nM E2 for 4 hours. Quantitative PCR was performed as described in the Materials and Methods. (A) Expression of ESR2 and 2 ligand independent target genes: CTGF and C3. (B) Expression of three ligand-dependent target genes: SDC1, CDH1, and DKK1. (C) Expression of four genes regulated in both ligand-independent and ligand-dependent manners: WNT4, THRSP, CABLES1, and S100A7. Data represent the mean and SEM of three independent replicates. *, P < .05 compared to DMSO control; #, P < .05 compared to DMSO+Dox control.
Figure 7.

ERβ expression regulates common target genes in HCC1143 TNBC cells. (A) Quantitative PCR validation of SEMA3B, MXD1, and CDKN1A in 468-ERβ#18 cells treated with vehicle or Dox for 24 hours followed by treatment with DMSO or 10 nM E2 for 4 hours. Data represent the mean and SEM of three independent replicates. *, P < .05 compared to DMSO control; #, P < .05 compared to DMSO+Dox control. (B) Quantitative PCR validation of ESR2, SEMA3B, MXD1, and CDKN1A in HCC1143 TNBC cells infected with retrovirus for GFP or ERβ expression followed by treatment with DMSO or 10 nM E2 for 4 hours. The data represent the mean and SEM of three replicates. *, P < .05 compared to GFP/DMSO control; #, P < .05 compared to ERβ/DMSO control. (C) Quantitative PCR validation of SEMA3B, MXD1, and CDKN1A in 468-ERβ#18 cells treated with vehicle or Dox for 24 hours followed by treatment with DMSO or 100 nM ERB-041 for 4 hours. Data represent the mean and SEM of three independent replicates. *, P < .05 compared to DMSO control; #, P < .05 compared to DMSO+Dox control.
ERβ target genes are enriched in pathways regulating cell proliferation, differentiation, and cell cycle
After globally identifying the ERβ target genes in ERα-negative TNBC cells, we conducted a pathway analysis of the total ERβ target genes identified in comparison IV (Figure 5A) using IPA. These ERβ target genes were enriched in several molecular and cellular functions, including cell movement, cell death and necrosis, and cell differentiation (Table 4). In addition, genes involved in cell proliferation and cell morphology were enriched in the ERβ target genes. Similar molecular and cellular functions were enriched in genes identified in comparisons II and III (Figure 5A), representing potential ligand-independent and ligand-dependent targets, respectively (Supplemental Materials and Methods). The top pathways enriched in the total ERβ target gene set included the Wnt/β-catenin pathway and the G1/S cell cycle checkpoint regulation pathway (Table 5). Indeed, several genes involved in Wnt signaling were verified as ERβ target genes, including DKK1, WNT4, and CDH1 (Figure 6, B and C). In addition, the gene encoding the cyclin-dependent kinase inhibitor p21, CDKN1A, was found to be up-regulated by ERβ expression and E2 treatment (Figure 7A). The pathway analysis results support the potential for ERβ to regulate key cellular process that may ultimately play a role in growth inhibition.
Table 4.
Top Biological Functions in the E2 vs E2+ERβ Gene Set
| Top Biological Functions, Molecular and Cellular Functions | P Value | No. of Molecules |
|---|---|---|
| Cell movement | ||
| Cell movement | 1.21E-18 | 166 |
| Migration of cells | 2.73E-18 | 154 |
| Cell death and survival | ||
| Necrosis | 2.19E-17 | 201 |
| Cell death | 2.66E-16 | 236 |
| Cellular development | ||
| Differentiation of cells | 6.66E-17 | 129 |
| Proliferation of tumor cell lines | 1.54E-12 | 143 |
| Cellular growth and proliferation | ||
| Proliferation of tumor cell lines | 1.54E-12 | 143 |
| Proliferation of cells | 1.70E-12 | 249 |
| Cellular morphology | ||
| Formation of lamellipodia | 4.56E-09 | 22 |
| Collapse of growth cone | 2.31E-07 | 12 |
Table 5.
Top Pathways in the E2 vs E2+ERβ Gene Set
| Top Canonical Pathways | P Value | Ratio |
|---|---|---|
| Hepatic fibrosis/hepatic stellate cell activation | 7.24E-07 | 0.16 |
| Axonal guidance signaling | 2.57E-05 | 0.09 |
| Wnt/β-catenin signaling | 1.91E-04 | 0.12 |
| Role of IL-17A in psoriasis | 3.63E-04 | 0.39 |
| Aryl hydrocarbon receptor signaling | 6.17E-04 | 0.11 |
| Molecular mechanisms of cancer | 8.51E-04 | 0.09 |
| Glioblastoma multiforme signaling | 1.66E-03 | 0.10 |
| Human embryonic stem cell pluripotency | 1.82E-03 | 0.10 |
| Coagulation system | 2.04E-03 | 0.18 |
| Glutamate receptor signaling | 2.45E-03 | 0.13 |
| Cell cycle: G1/S checkpoint regulation | 3.55E-03 | 0.14 |
ERβ target genes are regulated in additional breast cancer cell lines and correlate with ERβ expression in TNBCs
To confirm that a common set of ERβ target genes are shared among TNBC cells, the genes identified in MDA-MB-468-ERβ cells were compared to those identified in other TNBC cell lines. First, the gene list was compared to that obtained by Secreto and coworkers (15) in which Hs578T breast cancer cells with inducible ERβ expression were used to identify ligand-dependent ERβ target genes after 24 hours of E2 treatment. Although the authors used a targeted microarray to assess changes in gene expression, 27 genes were found to be commonly regulated in both MDA-MB-468-ERβ and Hs578T-ERβ cells (Table 6). Most of these genes were regulated in the same direction, with the exceptions of BMP5, CEBPD, and PMAIP1. Four ERβ target genes were then verified in another TNBC cell line, HCC1143, infected with retrovirus encoding green fluorescent protein (GFP) as a control or full-length ERβ followed by treatment with DMSO or E2 for 4 hours (Figure 7C). Indeed, all four genes including the cell cycle regulator CDKN1A were regulated in a similar manner in HCC1143 when ERβ was expressed and activated by E2 treatment. These data suggest that ERβ regulates multiple common targets across TNBC cell lines.
Table 6.
Common ERβ Target Genes Identified in Hs578T-ERβ (15) and 468-ERβ#18
| Gene Symbol | Gene Name | Fold Change MDA468-ERβ | Fold Change Hs578T-ERβ |
|---|---|---|---|
| ADAMTS1 | ADAM metallopeptidase with thrombospondin type 1 motif, 1 | 0.2 | 0.4 |
| ADAMTS5 | ADAM metallopeptidase with thrombospondin type 1 motif, 5 | 0.1 | 0.4 |
| BMP5 | Bone morphogenetic protein 5 | 0.5 | 2.6 |
| C3 | Complement component 3 | 4.4 | 12.8 |
| CA12 | Carbonic anhydrase XII | 10.5 | 2.9 |
| CD34 | CD34 molecule | 29.8 | 2.1 |
| CEBPD | CCAAT/enhancer binding protein (C/EBP), δ | 0.5 | 2.7 |
| CTGF | Connective tissue growth factor | 0.3 | 0.4 |
| DKK1 | Dickkopf homolog 1 (Xenopus laevis) | 0.2 | 0.3 |
| EHD2 | EH-domain containing 2 | 2.9 | 2.3 |
| ENPP2 | Ectonucleotide pyrophosphatase/phosphodiesterase 2 (autotaxin) | 39.1 | 2.0 |
| FUT8 | Fucosyltransferase8 (α [1,6] fucosyltransferase) | 2.1 | 2.1 |
| IGFBP3 | Insulin-like growth factor binding protein 3 | 0.3 | 0.4 |
| IGFBP5 | Insulin-like growth factor binding protein 5 | 4.6 | 2.5 |
| JAG1 | Jagged 1 (Alagille syndrome) | 0.3 | 0.1 |
| LMO2 | LIM domain only2 (rhombotin-like 1) | 1.5 | 3.3 |
| PDE4B | Phosphodiesterase 4B, cAMP-specific | 2.0 | 2.3 |
| PFKFB3 | 6-phosphofructo-2-kinase/fructose-2,6-biphosphatase 3 | 4.5 | 2.1 |
| PIM1 | Pim-1 oncogene | 2.2 | 2.3 |
| PLAC1 | Placenta-specific 1 | 2.2 | 3.1 |
| PLAU | Plasminogen activator, urokinase | 0.5 | 0.4 |
| PMAIP1 | Phorbol-12-myristate-13-acetate-induced protein 1 | 2.1 | 0.5 |
| SEMA3B | Sema domain, immunoglobulin domain (Ig), (semaphorin) 3B | 7.2 | 3.6 |
| SFRP1 | Secreted frizzled-related protein 1 | 1.8 | 2.1 |
| TH | Tyrosine hydroxylase | 17.7 | 2.2 |
| TPD52L1 | Tumor protein D52-like 1 | 1.6 | 2.0 |
| WISP2 | WNT1 inducible signaling pathway protein 2 | 69.2 | 3.0 |
The ERβ target genes identified in MDA-MB-468-ERβ cells were next compared to ERβ target genes identified by Grober and colleagues (30) in ERα-positive MCF7 cells engineered to express full-length ERβ. Using chromatin precipitation followed by deep sequencing for ERβ binding sites and gene expression microarrays, they found 424 “primary” ERβ target genes that were differentially expressed when ERβ was expressed and contained ERβ binding sites within 10 kb of the gene. Of the 930 ERβ target genes identified in MDA-MB-468-ERβ cells (comparison IV, Figure 5A), 99 genes (10.6%) were also identified as primary ERβ targets. Fifty-two of these genes were differentially regulated in cells expressing ERβ and not in parental MCF7 cells (Supplemental Materials and Methods). These results indicate that despite the differences in cell lines (ie, ERα-negative basal-like cells versus ERα-positive luminal cells), ERβ can regulate common target genes. Most of these genes were also regulated in the absence of ERβ or contained ERα binding sites, but three genes were found to contain only ERβ binding sites and were only regulated when ERβ was expressed: CCDC103, IGSF9, and P2RY6. Although CCDC103 was only identified in comparison IV (Figure 5A), IGSF9 was found to be a ligand-dependent target (comparison III) and P2RY6 was a ligand-dependent target (comparison II) in MDA-MB-468-ERβ cells.
To validate the ERβ target genes in TNBCs, a correlation analysis was performed using gene expression data from 43 TNBCs available through TCGA (26). Of the 930 ERβ target genes identified in MDA-MB-468-ERβ cells (comparison IV, Figure 5A), 109 genes were significantly correlated with ESR2 expression (q < .05, denoted by points in Figure 8; a complete list is provided in Supplemental File 2). Fifteen of these were found to be ligand-independent in MDA-MB-468-ERβ (identified comparison II, Figure 5A), and 58 of them were regulated in a ligand-dependent manner (identified in comparison III, Figure 5A). Six of these genes were also identified in Hs578T-ERβ cells (highlighted in red in Figure 8), thereby validating that these genes are likely ERβ target genes in TNBCs. However, two genes (ADAMTS1 and ADAMTS5) showed a positive correlation with ERβ expression but were down-regulated in both cell lines, suggesting that ERβ target gene regulation in breast cancer samples is not completely recapitulated by the cell culture models. In addition, two of the genes identified as primary ERβ target genes by Grober et al (30) were significantly correlated with ESR2 expression in the TCGA cohort (highlighted in green in Figure 8), although the correlation coefficients were quite low. This could be due to the difference in breast cancer subtypes: Grober and colleagues used an ERα-positive cell line to identify ERβ target genes, while only TNBCs were included in the TCGA analysis. Overall, these results validate that a set of ERβ target genes identified in cell culture models are correlated with ERβ expression in TNBCs.
Figure 8.

ERβ target genes are correlated with ERβ expression in a cohort of TNBCs. Gene expression data from the TCGA (26) was used to perform a correlation analysis of ERβ target genes and ERβ expression. Of the 930 genes identified 468-ERβ#18 cells (comparison IV, Figure 5A), 109 genes were significantly correlated with ERβ expression (q < .05). The correlation coefficient versus the fold change observed in the RNA-seq results for each gene is shown in the scatterplot. The gene symbols of those genes with the highest correlation coefficients are shown on the plot. Genes in red are those that were also identified in Hs578T-ERβ cells (15), and genes in green are those that were identified in MCF7-ERβ cells (30).
Discussion
Because ERβ is expressed in 50% to 90% of ERα-negative breast cancers (1–4) and its expression has been associated with a better prognosis in TNBCs (2), ERβ may be a therapeutic target for a subset of TNBCs. The results of this study support this hypothesis and confirm the growth inhibitory effects of ERβ expression and activation in TNBC cells. However, the requirement of ligand to stimulate ERβ's effects is likely cell context specific. Previously, ERβ expression was found to inhibit ERα-negative breast cancer cell growth independent of ligand in MDA-MB-231 and SKBR3 cells (12, 13). In Hs578T TNBC cells, ERβ expression inhibited cell growth in a ligand-dependent manner through a G1 cell cycle arrest (15). In culture, ERβ expression also induced a G1 arrest in MDA-MB-468 cells, but this effect was both E2-independent and -dependent. One way that ERβ may regulate the cell cycle is through up-regulation of the cyclin-dependent kinase inhibitor p21 (encoded by CDKN1A), which regulates the progression from G1 to S phase. Indeed, one of the top pathways identified in ERβ target genes was the G1/S checkpoint regulation pathway (Table 5), which includes CDKN1A. In MDA-MB-231 TNBC cells, ERβ increased the expression of p21 via interaction with another transcription factor, inhibitor of differentiation-1 (14). Future studies are warranted to determine if inhibitor of differentiation-1 plays a role in the regulation of CDKN1A in MDA-MB-468 cells.
ERβ-mediated growth inhibition may also depend on the cellular environment. ERβ was found to elicit growth inhibitory effects in vitro and in vivo in MDA-MB-468-ERβ cells. In contrast, in mammary epithelial and breast cancer cells that endogenously coexpress ERα and ERβ, ERβ-selective ligands were found to induce apoptosis in vitro while promoting tumor growth in vivo (31) by coincubation with a basement membrane extract, suggesting that the cellular environment can modulate ERβ activity. Inhibition of extracellular signal-regulated kinase 1 and 2 (ERK1/2) could restore ERβ growth inhibitory effects (31). It appears that cellular context modulates ERβ growth inhibitory effects. Either the coexpression of ERα or the activation of kinase pathways in the mammary epithelial cell model may account for the differential in vivo effects of ERβ in the MDA-MB-468 orthotropic xenograft model.
Like ERα, ERβ has two activation functions (AF-1 and AF-2) that confer transcriptional activity. The AF-1 can mediate transcription independent of ligand, and the AF-2 functions in a ligand-dependent manner (32). Although the AF-1 of ERβ was found to have negligible activity in a Gal4 assay (33), ERβ was found to interact with DNA in a ligand-independent manner (34). In addition, MAP kinase has been shown to phosphorylate the N-terminal activation function (AF-1) of ERβ, thereby promoting the recruitment of steroid receptor coactivator 1, which confers ligand-independent transcriptional activity (35). In MDA-MB-468 cells, ERβ appears to have both ligand-independent and -dependent activity in regard to target gene expression. Interestingly, most target genes were regulated in response to E2 treatment, suggesting strong ligand-dependent activity in these cells. In contrast, most ERβ target genes were regulated independent of ligand in U2OS osteosarcoma cells (36). Therefore, the ligand-independent activity of ERβ is likely the result of the availability of cofactors, the activation of signaling pathways, and the promoter context.
Both the ligand-dependent and -independent ERβ target genes identified in MDA-468-ERβ cells were enriched in genes that regulate cell death, proliferation, movement, and morphology. ERβ target genes identified after 24 hours of E2 treatment in HEK293 cells were found to be enriched in many of the same pathways (37). A pathway analysis of total ERβ target genes revealed significant enrichment of several pathways, including the Wnt/β-catenin pathway. Of the genes involved in the Wnt/β-catenin pathway, ERβ expression and E2 treatment resulted in the up-regulation of WNT4 (a noncanonical Wnt ligand) and CDH1 (a β-catenin interacting protein), as well as the down-regulation of DKK1 (an inhibitor of Wnt signaling). Down-regulation of DKK1 by ERβ expression and estrogen treatment was also observed in Hs578T breast cancer cells (15) and 293T kidney cells (37). Collectively, the gene expression data suggest that ERβ expression may affect the Wnt signaling pathway in breast cancer cells. Although activation of Wnt signaling can transform human mammary epithelial cells (38), a recent study has shown that paracrine Wnt signaling in fibroblasts can either promote or inhibit breast cancer cell growth in mice (39). ERβ has been detected in both mammary epithelial and stromal cells (40) and may therefore affect Wnt signaling in a cell type- and cell context-dependent manner.
Given the heterogeneous nature of TNBCs (41), identification of common ERβ target genes across all TNBCs would be challenging. Recently TNBC cell lines were classified into basal-like, mesenchymal-like, and luminal-androgen receptor subtypes by correlation with expression profiles of large breast cancer data sets (42). Although the RNA-seq was performed in basal-like MDA-MB-468 cells, we verified ERβ target gene expression in Hs578T, a mesenchymal-like cell line, and HCC1143, another basal-like cell line. Despite differences in the cell line and experimental design, 27 genes identified in MDA-MB-468-ERβ cells were found to be ERβ target genes in Hs578T-ERβ cells treated with E2 for 24 hours (15). Four ERβ target genes selected for verification showed the similar regulation by ERβ and E2 in HCC1143 and MDA-MB-468 cells (Figure 7C). In addition, an ERβ target gene identified in MDA-MB-468-ERβ cells, S100A7, was found to be an ERβ-specific target gene in MCF7 ERα-positive breast cancer cells with inducible expression of ERβ and was associated with ERβ in ERα-negative breast tumors (43). Several ERβ targets were also found to be primary ERβ target genes in MCF7 cells (30) and are likely direct targets of the receptor in MDA-MB-468-ERβ cells. Most importantly, 109 ERβ target genes were correlated with ERβ expression in a cohort of 43 TNBCs, including six genes that were also identified in Hs578T TNBC cells. Thus, the genes identified in this study provide the foundation for identifying common target genes of ERβ functionality across ERα-negative breast cancers, including TNBCs.
Overall, this study confirms the growth inhibitory effects of ERβ in TNBC cells, both in vitro and in vivo, and provides the most comprehensive identification of ERβ target genes in TNBC to date. These data also suggest that ERβ selective ligands may be useful for targeting ERβ in a subset of ERα-negative breast cancers, including TNBCs. ERβ-selective ligands could promote the inhibitory effects of ERβ while avoiding the proliferative effects mediated by ERα. ERβ selective ligands, such as ERB-041, have been found to be well-tolerated (44), supporting the use of these compounds clinically. In addition, the identification of ERβ target genes provides a foundation for identifying biomarkers of ERβ functionality in TNBCs. Collectively, these data support the hypothesis that ERβ may be a therapeutic target in a subset of TNBCs and suggest that ERβ may be targeted with ERβ-selective ligands that can stimulate its growth inhibitory effects.
Supplementary Material
Acknowledgments
We gratefully acknowledge Yidan Wang for technical support and Lu Wang for providing the FLuc retrovirus.
This work was supported by the National Institute of Environmental Health and Safety (Grant T32 ES007015), the National Institutes of Health (Grant R01CA125387), the Department of Defense Breast Cancer Research Program (Grants BC100252, Era of Hope Scholar Award W81XWYH-11-1-0237), and the UWCCC (Multi-IT Grant).
Disclosure Summary: The authors have nothing to disclose.
Footnotes
- Dox
- doxycycline
- E2
- 17β-estradiol
- ERα
- estrogen receptor α
- ERβ
- estrogen receptor β
- FBS
- fetal bovine serum
- GFP
- green fluorescent protein
- IPA
- Ingenuity pathway analysis
- HER2
- human epidermal growth factor receptor 2
- 4-OH Tam
- 4-hydroxytamoxifen
- PR
- progesterone receptor
- RSEM
- RNA sequencing expectation maximization
- RNA-seq
- RNA sequencing
- SFS
- charcoal stripped FBS
- TCGA
- the Cancer Genome Atlas
- Tet
- tetracycline
- TNBC
- triple-negative breast cancers.
References
- 1. Skliris GP, Leygue E, Curtis-Snell L, Watson PH, Murphy LC. Expression of oestrogen receptor-β in oestrogen receptor-α negative human breast tumours. Br J Cancer. 2006;95(5):616–626 [DOI] [PMC free article] [PubMed] [Google Scholar]
- 2. Honma N, Horii R, Iwase T, et al. Clinical importance of estrogen receptor-β evaluation in breast cancer patients treated with adjuvant tamoxifen therapy. J Clin Oncol. 2008;26(22):3727–3734 [DOI] [PubMed] [Google Scholar]
- 3. Marotti JD, Collins LC, Hu R, Tamimi RM. Estrogen receptor-β expression in invasive breast cancer in relation to molecular phenotype: results from the Nurses' Health Study. Mod Pathol. 2010;23(2):197–204 [DOI] [PMC free article] [PubMed] [Google Scholar]
- 4. Yan M, Rayoo M, Takano EA, kConFab Investigators, Fox SB. Nuclear and cytoplasmic expressions of ERβ1 and ERβ2 are predictive of response to therapy and alters prognosis in familial breast cancers. Breast Cancer Res Treat. 2011;126(2):395–405 [DOI] [PubMed] [Google Scholar]
- 5. Leung Y-K, Mak P, Hassan S, Ho S-M. Estrogen receptor (ER)-b isoforms: a key to understanding ER-β signaling. Proc Natl Acad Sci USA. 2006;103(35):13162–13167 [DOI] [PMC free article] [PubMed] [Google Scholar]
- 6. Peng B, Lu B, Leygue E, Murphy L. Putative functional characteristics of human estrogen receptor-β isoforms. J Mol Endocrinol. 2003;30(1):13–29 [DOI] [PubMed] [Google Scholar]
- 7. Paruthiyil S, Parmar H, Kerekatte V, Cunha GR, Firestone GL, Leitman DC. Estrogen receptor β inhibits human breast cancer cell proliferation and tumor formation by causing a G2 cell cycle arrest. Cancer Res. 2004;64(1):423–428 [DOI] [PubMed] [Google Scholar]
- 8. Ström A, Hartman J, Foster JS, Kietz S, Wimalasena J, Gustafsson JA. Estrogen receptor β inhibits 17β-estradiol-stimulated proliferation of the breast cancer cell line T47D. Proc Natl Acad Sci USA. 2004;101(6):1566–1571 [DOI] [PMC free article] [PubMed] [Google Scholar]
- 9. Murphy LC, Peng B, Lewis A, et al. Inducible upregulation of oestrogen receptor-β1 affects oestrogen and tamoxifen responsiveness in MCF7 human breast cancer cells. J Mol Endocrinol. 2005;34(2):553–566 [DOI] [PubMed] [Google Scholar]
- 10. Hartman J, Lindberg K, Morani A, Inzunza J, Ström A, Gustafsson JA. Estrogen receptor β inhibits angiogenesis and growth of T47D breast cancer xenografts. Cancer Res. 2006;66(23):11207–11213 [DOI] [PubMed] [Google Scholar]
- 11. Hodges-Gallagher L, Valentine CD, El Bader S, Kushner PJ. Estrogen receptor β increases the efficacy of antiestrogens by effects on apoptosis and cell cycling in breast cancer cells. Breast Cancer Res Treat. 2008;109(2):241–250 [DOI] [PubMed] [Google Scholar]
- 12. Lazennec G, Bresson D, Lucas A, Chauveau C, Vignon F. ER β inhibits proliferation and invasion of breast cancer cells. Endocrinology. 2001;142(9):4120–4130 [DOI] [PMC free article] [PubMed] [Google Scholar]
- 13. Treeck O, Juhasz-Boess I, Lattrich C, Horn F, Goerse R, Ortmann O. Effects of exon-deleted estrogen receptor β transcript variants on growth, apoptosis and gene expression of human breast cancer cell lines. Breast Cancer Res Treat. 2008;110(3):507–520 [DOI] [PubMed] [Google Scholar]
- 14. Chen L, Qiu J, Yang C, et al. Identification of a novel estrogen receptor β1 binding partner, inhibitor of differentiation-1, and role of ERβ1 in human breast cancer cells. Cancer Lett. 2009;278(2):210–219 [DOI] [PubMed] [Google Scholar]
- 15. Secreto FJ, Monroe DG, Dutta S, Ingle JN, Spelsberg TC. Estrogen receptor α/β isoforms, but not βcx, modulate unique patterns of gene expression and cell proliferation in Hs578T cells. J Cell Biochem. 2007;101(5):1125–1147 [DOI] [PubMed] [Google Scholar]
- 16. Hartman J, Ström A, Gustafsson JA. Estrogen receptor β in breast cancer—diagnostic and therapeutic implications. Steroids. 2009;74(8):635–641 [DOI] [PubMed] [Google Scholar]
- 17. Stossi F, Barnett DH, Frasor J, Komm B, Lyttle CR, Katzenellenbogen BS. Transcriptional profiling of estrogen-regulated gene expression via estrogen receptor (ER) α or ERβ in human osteosarcoma cells: distinct and common target genes for these receptors. Endocrinology. 2004;145(7):3473–3486 [DOI] [PubMed] [Google Scholar]
- 18. Shanle EK, Hawse JR, Xu W. Generation of stable reporter breast cancer cell lines for the identification of ER subtype selective ligands. Biochem Pharmacol. 2011;82(12):1940–1949 [DOI] [PMC free article] [PubMed] [Google Scholar]
- 19. Minn AJ, Gupta GP, Siegel PM, et al. Genes that mediate breast cancer metastasis to lung. Nature. 2005;436(7050):518–524 [DOI] [PMC free article] [PubMed] [Google Scholar]
- 20. Li B, Ruotti V, Stewart RM, Thomson JA, Dewey CN. RNA-Seq gene expression estimation with read mapping uncertainty. Bioinformatics. 2010;26(4):493–500 [DOI] [PMC free article] [PubMed] [Google Scholar]
- 21. Faulkner GJ, Forrest AR, Chalk AM, et al. A rescue strategy for multimapping short sequence tags refines surveys of transcriptional activity by CAGE. Genomics. 2008;91(3):281–288 [DOI] [PubMed] [Google Scholar]
- 22. Mortazavi A, Williams BA, McCue K, Schaeffer L, Wold B. Mapping and quantifying mammalian transcriptomes by RNA-Seq. Nat Methods. 2008;5(7):621–628 [DOI] [PubMed] [Google Scholar]
- 23. Taub MLD, Speed TP. Methods for allocating ambiguous short-reads. Comm Inform Syst. 2010;10(2):69–82 [Google Scholar]
- 24. Li B, Dewey CN. RSEM: accurate transcript quantification from RNA-Seq data with or without a reference genome. BMC Bioinformatics. 2011;12:323. [DOI] [PMC free article] [PubMed] [Google Scholar]
- 25. Anders S, Huber W. Differential expression analysis for sequence count data. Genome Biol. 2010;11(10):R106. [DOI] [PMC free article] [PubMed] [Google Scholar]
- 26. Cancer Genome Atlas Network Comprehensive molecular portraits of human breast tumours. Nature. 2012;490(7418):61–70 [DOI] [PMC free article] [PubMed] [Google Scholar]
- 27. Benjamini Y, Hochberg Y. Controlling the false discovery rate: a practical and powerful approach to multiple testing. J Royal Stat Soc B (Method). 1995;57:289–300 [Google Scholar]
- 28. Storey JD, Tibshirani R. Statistical significance for genomewide studies. Proc Natl Acad Sci USA. 2003;100(16):9440–9445 [DOI] [PMC free article] [PubMed] [Google Scholar]
- 29. Harris HA, Albert LM, Leathurby Y, et al. Evaluation of an estrogen receptor-β agonist in animal models of human disease. Endocrinology. 2003;144(10):4241–4249 [DOI] [PubMed] [Google Scholar]
- 30. Grober OM, Mutarelli M, Giurato G, et al. Global analysis of estrogen receptor β binding to breast cancer cell genome reveals an extensive interplay with estrogen receptor α for target gene regulation. BMC Genomics. 2011;12:36. [DOI] [PMC free article] [PubMed] [Google Scholar]
- 31. Cotrim CZ, Fabris V, Doria ML, et al. Estrogen receptor β growth-inhibitory effects are repressed through activation of MAPK and PI3K signalling in mammary epithelial and breast cancer cells. Oncogene. 2012;32(19):2390–2402 [DOI] [PubMed] [Google Scholar]
- 32. Heldring N, Pike A, Andersson S, et al. Estrogen receptors: how do they signal and what are their targets. Physiol Rev. 2007;87(3):905–931 [DOI] [PubMed] [Google Scholar]
- 33. Cowley SM, Parker MG. A comparison of transcriptional activation by ERα and ERβ. J Steroid Biochem Mol Biol. 1999;69(1–6):165–175 [DOI] [PubMed] [Google Scholar]
- 34. Hall JM, McDonnell DP. The estrogen receptor β-isoform (ERβ) of the human estrogen receptor modulates ERα transcriptional activity and is a key regulator of the cellular response to estrogens and antiestrogens. Endocrinology. 1999;140:5566–5578 [DOI] [PubMed] [Google Scholar]
- 35. Tremblay A, Tremblay GB, Labrie F, Giguère V. Ligand-independent recruitment of SRC-1 to estrogen receptor β through phosphorylation of activation function AF-1. Molecular Cell. 1999;3(4):513–519 [DOI] [PubMed] [Google Scholar]
- 36. Vivar OI, Zhao X, Saunier EF, et al. Estrogen receptor β binds to and regulates three distinct classes of target genes. J Biol Chem. 285(29):22059–22066 [DOI] [PMC free article] [PubMed] [Google Scholar]
- 37. Zhao C, Putnik M, Gustafsson JA, Dahlman-Wright K. Microarray analysis of altered gene expression in ERβ-overexpressing HEK293 cells. Endocrine. 2009;36(2):224–232 [DOI] [PubMed] [Google Scholar]
- 38. Ayyanan A, Civenni G, Ciarloni L, et al. Increased Wnt signaling triggers oncogenic conversion of human breast epithelial cells by a Notch-dependent mechanism. Proc Natl Acad Sci USA. 2006;103(10):3799–3804 [DOI] [PMC free article] [PubMed] [Google Scholar]
- 39. Green JL, La J, Yum KW, et al. Paracrine Wnt signaling both promotes and inhibits human breast tumor growth. Proc Natl Acad Sci USA. 2013;110(17):6991–6996 [DOI] [PMC free article] [PubMed] [Google Scholar]
- 40. Palmieri C, Saji S, Sakaguchi H, et al. The expression of oestrogen receptor (ER)-β and its variants, but not ERα, in adult human mammary fibroblasts. J Mol Endocrinol. 2004;33(1):35–50 [DOI] [PubMed] [Google Scholar]
- 41. Shah SP, Roth A, Goya R, et al. The clonal and mutational evolution spectrum of primary triple-negative breast cancers. Nature. 2012;486(7403):395–399 [DOI] [PMC free article] [PubMed] [Google Scholar]
- 42. Lehmann BD, Bauer JA, Chen X, et al. Identification of human triple-negative breast cancer subtypes and preclinical models for selection of targeted therapies. J Clin Invest. 2011;121(7):2750–2767 [DOI] [PMC free article] [PubMed] [Google Scholar]
- 43. Skliris GP, Lewis A, Emberley E, et al. Estrogen receptor-β regulates psoriasin (S100A7) in human breast cancer. Breast Cancer Res Treat. 2007;104(1):75–85 [DOI] [PubMed] [Google Scholar]
- 44. Roman-Blas JA, Castañeda S, Cutolo M, Herrero-Beaumont G. Efficacy and safety of a selective estrogen receptor β agonist, ERB-041, in patients with rheumatoid arthritis: a 12-week, randomized, placebo-controlled, phase II study. Arthritis Care Res (Hoboken). 2010;62(11):1588–1593 [DOI] [PubMed] [Google Scholar]
Associated Data
This section collects any data citations, data availability statements, or supplementary materials included in this article.