

Abstract
Intestinal transporter proteins affect the oral bioavailability of many drugs in a significant manner. In order to estimate or predict their impact on oral drug absorption, data on their intestinal expression levels are needed. So far, predominantly mRNA expression data are available which are not necessarily correlated with the respective protein content. All available protein data were assessed by immunoblotting techniques such as Western blotting which both possess a number of limitations for reliable protein quantification. In contrast to this, mass spectrometry-based targeted proteomics may represent a promising alternative method to provide comprehensive protein expression data. In this review, we will summarize so far available intestinal mRNA and protein expression data for relevant human multidrug transporters. Moreover, recently observed mass spectrometry-based targeted proteomic data will be presented and discussed with respect to potential functional consequences. Associated to this, we will provide a short tutorial how to set up these methods and emphasize critical aspects in method development. Finally, potential limitations and pitfalls of this emerging technique will be discussed. From our perspective, LC-MS/MS-based targeted proteomics represents a valuable new method to comprehensively analyse the intestinal expression of transporter proteins. The resulting expression data are expected to improve our understanding about the intestinal processing of drugs.
KEY WORDS: drug transporters, intestinal, mass spectrometry, quantification, targeted proteomics
INTRODUCTION
The oral drug absorption is a very complex process which is influenced by many poorly predictable factors such as gastrointestinal motility, intestinal water content, drug liberation from the administered dosage form, drug dissolution properties, passive diffusion, intestinal phase I and II metabolism as well as uptake and efflux transport (1,2). Therefore, it is not surprising that the oral administration of drugs, although being the most favourable administration route, is associated with several problems such as (1) low and highly variable (inter- and intra-subject) bioavailability for many drugs; (2) substantial impact of the administered dosage form on drug absorption for many compounds; and (3) poorly predictable drug–drug or drug–food interactions (1,3,4). As a consequence, it is still challenging to predict the oral absorption of drugs or to estimate intestinal DDIs despite the availability of highly sophisticated physiologically based pharmacokinetic modeling and prediction tools (5,6).
During the last decade, it was clearly pointed out that the oral bioavailability of many drugs is significantly influenced by several intestinal transporter proteins (7). With reference to this, ABC (ATP binding cassette) transporters such as ABCB1 (P-glycoprotein), ABCC2 (MRP2) and ABCG2 (BCRP) act as efflux transporters thereby limiting the intestinal absorption of many compounds by pumping them back to gut lumen (Fig. 1). Thus, co-administration of inducers or inhibitors and substrates of these proteins were shown to cause clinically relevant drug–drug interactions (DDIs, Table I) (3,8–17). Moreover, several uptake carriers from the SLC transporter family have been reported to mediate the intestinal uptake of many endogenous compounds (e.g. bile acids by ASBT, sugars by GLUTs) and drugs (e.g. ß-lactam antibiotics and ACE inhibitors by PEPT1) (7,18). However, their intestinal expression and contribution to intestinal drug absorption are less well documented and understood and in part controversially discussed (e.g. intestinal expression of OATPs, see section “Available Intestinal Expression Data”) (19). The same is true for drug transporters that are expressed at the basolateral membrane of the enterocytes which could act as functional uptake (ABCC1, ABCC3, OSTalpha) or efflux carriers (e.g. OCT1).
Fig. 1.
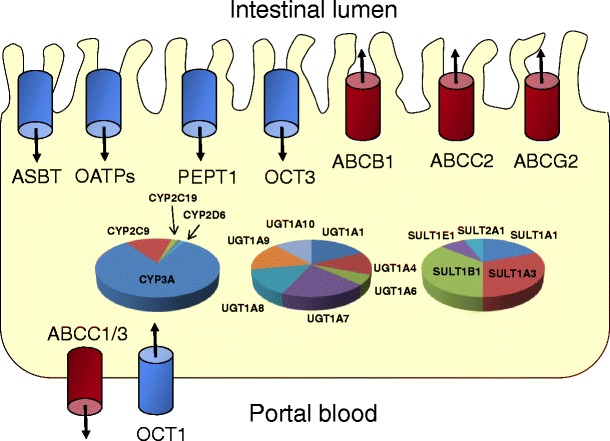
Schematic overview of clinically relevant intestinal uptake (blue) and efflux (red) transporters as well as cytochrome P450 enzymes (CYP), UDP-glucuronosyltransferases (UGT) and sulfotransferases (SULT) which were shown to affect the oral absorption of many drugs (according to Giacomini et al. 2010 (7), Paine et al. 2006 (20), Riches et al. 2009 (21) and Harbourt et al. 2012 (22))
Table I.
Examples for Clinically Relevant Drug–Drug Interactions Caused by Induction or Inhibition of Intestinal Transporter Proteins
| Substrate (victim) | Inhibitor/inducer | PK change | Reason | Reference |
|---|---|---|---|---|
| Digoxin | Rifampicin (600 mg, 10 days) | F↓ 30% | Induction of ABCB1 | Greiner et al. 1999 (17) |
| Digoxin | Clarithromycin (250 mg, b.i.d., 3 days) | AUC↑ 64% | Inhibition of ABCB1 | Rengelshausen et al. 2003 (13) |
| Ezetimibe | Rifampicin (600 mg, 8 days) | AUCa↓ 63% | Induction of ABCB1, ABCC2 | Oswald et al. 2006 (11) |
| Ezetimibe | Rifampicin (600 mg, SD) | AUCa↑ 92% | Inhibition of ABCB1, ABCC2, OATP1B1 | Oswald et al. 2006 (12) |
| Talinolol | Rifampicin (600 mg, 8 days) | F↓ 35% | Induction of ABCB1 | Westphal et al. 2000 (16) |
| Talinolol | Erythromycin (500 mg, SD) | AUC↑ 52% | Inhibition of ABCB1 | Schwarz et al. 2000 (14) |
| Talinolol | Grapefruit juice (SD) | AUC↓ 56% | Inhibition of intestinal OATPs | Schwarz et al. 2005 (15) |
| Fexofenadine | Rifampicin (600 mg, 8 days) | CL/F↑ 87–164% | Induction of ABCB1 | Hamman et al. 2001 (9) |
| Fexofenadine | Rifampicin (600 mg, SD) | CL/F↓ 73–76% | Inhibition of ABCB1, ABCC2, OATP1B1/3 | Kusuhara et al. 2013 (10) |
| Fexofenadine | Grapefruit juice (SD) | AUC↓ 63% | Inhibition of intestinal OATPs | Dresser et al. 2002 (8) |
aSum of ezetimibe and ezetimibe glucuronide
The intestinal processing of drugs is even more complicated by that fact that the expression of different metabolizing enzymes and transporter proteins is most likely not homogeneous along the human intestine as indicated by several mRNA expression studies (see section “Available Intestinal Expression Data”). Therefore, the extent of intestinal drug absorption may be influenced by the intestinal site of drug release and, thus, be determined by the administered dosage form (e.g. immediate vs. sustained release) or co-administered drugs that affect gastrointestinal motility (e.g. anticholinergic drugs) or transporter function (inhibition/induction). This assumption is supported by some experimental clinical studies that demonstrated site-dependent intestinal absorption of drugs that are known to be transporter substrates (23–26). For example, the intestinal absorption of the ABCB1 substrate talinolol was shown to be significantly higher from the upper small intestine than from lower parts, which is in well agreement to the observation that the intestinal ABCB1 expression increases from duodenum to ileum (25–27). In parallel to their impact on intestinal drug absorption, different expression pattern of transporters along the gut may also affect their probability to contribute to intestinal DDIs (3,28). Accordingly, one would expect predominately interactions involving transporters that are highly expressed in the small intestine (e.g. ABCB1), i.e. the site of predominant drug absorption, but not for those that are most abundant in more distal parts of the small intestine or even in colon.
However, only very limited data on intestinal transporter protein expression are available to draw reliable conclusions on their relevance for drug absorption or DDIs in general. On the other side, these data are of great interest for industry and academia to estimate or even to predict the relevance of the aforementioned transporters in oral drug absorption (5,6,28,29).
The majority of so far available information is based on mRNA expression data which must not necessarily be correlated with the respective protein expression (30–40). The few available protein data were generated by former methods of choice for protein quantification, namely immunohistochemistry and Western blotting (11,16,27,41,42). However, these methods possess a number of substantial limitations which make them appear inappropriately for reliable protein quantification (see section “Protein Quantification by Immunoblotting”). This is especially true when one considers the emerging role of transporter proteins in drug development and regulatory affairs and the need for robust and reliable protein expression data from in vitro or in vivo models to conclude on their pharmacokinetic relevance (43).
A novel and promising approach for the determination of transporter proteins is liquid chromatography-tandem mass spectrometry (LC-MS/MS)-based targeted proteomics (44,45). Here, amino acid sequence-dependent mass transitions of protein specific peptides generated by tryptic digestion are monitored for quantification. Because the tryptic digestion of the respective protein is supposed to be complete, the molarity of the measured peptide acts as a surrogate for the respective protein expression. Therefore, these methods are expected to assess the absolute protein expression levels by using synthetic peptide standards and isotope labelled internal standards. These methods have been successfully used to quantify several ABC (e.g. ABCB1, ABCC2 and ABCG2) and SLC transporters (e.g. OATP1B1, OATP2B1, OATP1B3 and NTCP) in human tissue (liver, brain and kidney), human cells (hepatocytes, platelets) and transfected cell lines (46–64). However, to our knowledge, this emerging technique has so far not been applied to quantify these transporter proteins in human intestinal tissue.
In this review, we will summarize so far available mRNA and protein expression data for clinically relevant multidrug transporters in the human intestine. Moreover, we will present own mass spectrometry-based protein quantification data and discuss advantages and limitations of this novel method as well as potential functional implications of the observed transporter protein expression in the human intestine.
AVAILABLE INTESTINAL EXPRESSION DATA
The expression of transporter proteins in the human intestine has been investigated by several studies (27,30–39,41,42). Tables II and III summarize so far available intestinal expression data, which represent predominately mRNA expression data (Table II). This is comprehensible from the technical point of view as intestinal samples are mostly taken by biopsies which provide not sufficient amount of sample for tissue consuming protein quantification procedures such as immunoblotting but is still adequate for a multiplex gene expression analysis (30,32,33,36,40).
Table II.
Overview of so Far Available mRNA Data Expression for Transporter Proteins in the Human Intestine (+++, High Expression; ++, Moderate Expression; +, Low Expression; n.d., Not Detectable; −, No Data Available)
| Protein | ABCB1 | ABCC1 | ABCC2 | ABCC3 | ABCG2 | ASBT | OATP1A2 | OATP2B1 | OCT1 | OCT3 | PEPT1 |
| Alias | P-gp | MRP1 | MRP2 | MRP3 | BCRP | IBAT | OATP-A | OATP-B | − | EMT | − |
| Gene | ABCB1 | ABCC1 | ABCC2 | ABCC3 | ABCG2 | SLC10A2 | SLCO1A2 | SLCO2B1 | SLC22A1 | SLC22A3 | SLC15A1 |
| Duodenum | +/++ | + | +++ | ++ | ++ | + | n.d. | ++ | + | − | ++ |
| Jejunum | ++ | + | +++ | ++ | ++ | ++ | n.d. | ++ | + | + | +++ |
| Ileum | +++ | +/++ | ++ | ++ | ++/+++ | +++ | n.d. | ++ | + | − | +++ |
| Colon | +/++ | +/++ | + | +++ | +/++ | + | n.d. | +/++ | +/++ | +/n.d. | + |
Table III.
Overview of so Far Available Protein Expression Data for Drug Transporter Proteins in the Human Intestine (+++, High Expression; ++, Moderate Expression; +, Low Expression; n.d., Not Detectable; −, No Data Available)
| Reference | Mouly et al. 2003 (27) | Berggren et al. 2007 (41) | Tucker et al. 2012 (42) | |||
|---|---|---|---|---|---|---|
| Quantitative assay | Western blot (N = 5) | Western blot (N = 15a) | Western blot (N = 14) | |||
| Segment/protein | ABCB1 | ABCB1 | ABCC2 | ABCB1 (pmol/mg) | ABCC2 (pmol/mg) | ABCG2 (pmol/mg) |
| Duodenum | + | − | − | 205 ± 153 | 49 ± 52 | 227 ± 184 |
| Jejunum | ++ | ++ | +++ | − | − | − |
| Ileum | +++ | ++ | ++ | − | − | − |
| Colon | − | ++ | ++ | − | − | − |
aSamples for each segment were from different donors (jejunum = 3, Ileum = 4, colon = 7)
Although the data are heterogeneous, the majority of these records indicate considerable differences in the expression levels of multidrug transporter genes along the human intestine (Table II). With reference to this, the expression of ABCB1, ABCC2, ABCG2, ASBT and PEPT1 was shown to be highest in proximal parts of the intestine (30–33,36,39,40), while the abundance of ABCC3, OCT1, OCT3 and MCT1 was highest in the colon (30,31,36,39,40). The expression levels of OATP2B1 were moderate and homogenous along the entire human intestine (30,32,33,36,40). The relative rank order of gene expression within and between the different gut segments varied markedly between the studies. Potential reasons for these discrepancies may be due to the fact that available human data were predominately derived from patients suffering from different gastrointestinal diseases including gastrointestinal cancer or inflammatory diseases that may affect gene expression as clearly shown for ulcerative colitis and Crohn’s disease (65,66).
Another potential confounder may be merging of expression data, i.e. expression data from different individuals and intestinal segments were matched to each other to conclude on the transporter expression along the human gut. However, considering the high variability in the expression of intestinal transporters that have been reported, this approach remains very questionable (11,67).
Finally, intestinal mRNA expression data must not necessarily be correlated with the respective protein abundance or function (37,56,68). In this regard, in previous clinical studies, we were not able to find significant correlations between the mRNA and protein expression for ABCB1 and ABCC2 in human duodenum using quantitative immunohistochemistry for protein quantification ((11,69–71); Fig. 2).
Fig. 2.
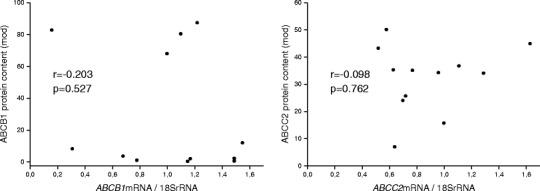
Correlation between duodenal mRNA and protein expression of ABCB1 (left) and ABCC2 (right) in 12 healthy volunteers (Oswald et al. 2006) (11). Similar findings have been observed by Haenisch et al. 2008 (71) and Giessmann et al. 2004 (69,70)
Moreover, a low expression of target genes which is compensated by using a high number of PCR cycles may generate expression signals that can easily cause misleading observations such as the reported intestinal expression of the liver-specific uptake transporters OATP1B1 and OATP1B3 (72). The same is true for the reported mRNA expression of intestinal OATP1A2 which could also not be confirmed by other studies (32,33,35,36).
Taken together, protein data are needed and appear to be a more reliable surrogate for intestinal transporter function than available gene expression data. To our knowledge, there were so far only three studies published which quantified the protein content of human multidrug transporters (ABCB1, ABCC2 and ABCG2) along the intestine (Table III) (27,41,42). All of these studies used Western blotting for protein quantification (limitations see next section). Mouly et al. verified on protein level the reported increase in ABCB1 expression from duodenum to ileum (27). This is in contrast to findings from Berggren who observed a substantial drop in intestinal expression from proximal to distal small intestine for ABCB1 and ABCC2 (41). A recent study by Tucker et al. investigated the expression of ABCB1, ABCC2 and ABCG2 solely in duodenal tissue and observed the following rank order of transporter protein expression: ABCG2 ≥ ABCB1 > ABCC2 (42). This study reported for the first time absolute protein expression values which are a prerequisite for prediction of transporter function (5,6). However, the duodenum is not supposed to be the predominate site for intestinal drug absorption. In this regard, many of the aforementioned studies generated their expression data from intestinal parts that are accessible by endoscopic procedures (duodenum, terminal ileum, and colon segments), thereby omitting the intestinal section that is expected to be most important for drug absorption, i.e. the jejunum (30,31,33,34,38,39).
There are also some intestinal protein expression data from rat and dog available (73,74). However, it remains uncertain how predictive these transporter expression data are for the situation in human (75). In conclusion, there are substantial gaps in knowledge which counteract a comprehensive understanding or a reliable prediction about the impact of intestinal drug transporters on oral drug absorption due to the lack of absolute protein expression data.
PROTEIN QUANTIFICATION BY IMMUNOBLOTTING
The previous methods of choice for specific quantification of membrane transporters and proteins in general were immunological methods such as Western blotting or quantitative immunohistochemistry. The analytical principle of both methods is binding of specific antibodies to the protein of interest which enables afterwards detection of an optical densitometric, fluorescence or radioactive signal caused by a secondary antibody.
Although these methods are supposed to be protein specific, a major limitation is the uncertain specificity of the used antibody, i.e. cross-reactivity with other proteins or even a lack of functionality (76,77). This is not surprising when one keeps in mind that an epitope which is recognized by specific antibodies has normally the length of five to ten amino acids and its distinct binding motif is mostly unknown. Other limitations which could be associated with antibodies are their high prize or their lack of commercial availability.
Both methods are well-accepted bioanalytical techniques for protein detection. However, they are also frequently used for protein quantification (especially Western blot). In this regard, and in addition to the aforementioned limitations, one has to consider further aspects which could interfere with reliable protein quantification. Firstly, there are mostly no data on the analytical quality for immunoblotting assays available, i.e. specificity, limit of detection, accuracy and precision. Associated to this, we recently observed a high variability and analytical error (i.e. poor reproducibility; Fig. 3) for Western blot-based protein quantification of human serum albumin (HSA) and hepatic OATP transporters overexpressed in HEK293 cells (78).
Fig. 3.
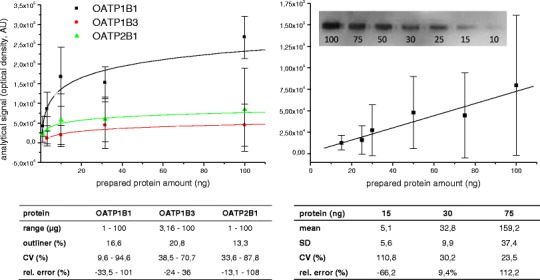
Analytical data for the Western blot quantification of OATPs in overexpressing HEK293 cells (left) and human serum albumin (right). Graphs represent correlations between protein content and analytical signal (optical density) which were derived in each case from six calibration curves prepared and measured on six different days. Tables below summarize within-day accuracy and precision derived from in each case six quality control sample sets measured on 1 day
Secondly, the linear analytical range, i.e. a linear correlation between protein amount and analytical signal, is mostly unknown when quantifying proteins by Western blot using chemiluminescent signals for detection (76,79). Associated to this, we could demonstrate a highly variable but linear correlation for the water-soluble protein HSA but rather a quadratic correlation for hepatic OATP transporters (78). Considering that this correlation is mostly unknown and differs between the different proteins and used antibodies, the blind assumption of a linear correlation, e.g. doubling the optical density means twofold higher protein expression, may cause misleading results.
Thirdly, Western blotting has only a very limited sample throughput and is characterized by a poor reproducibility (i.e. highly variable within- and between accuracy and precision, Fig. 3). Consequently, without a minimal method validation, all quantitative data generated by immunoblotting remain questionable.
PROTEIN QUANTIFICATION BY MASS SPECTROMETRY-BASED TARGETED PROTEOMICS
Mass spectrometry-based targeted proteomics may be a promising approach to overcome most of the aforementioned limitations (44,45). This novel methodology enables the simultaneous and label-free absolute quantification of several proteins of interest. The first methods have been published in the early 1990s of the last century and were applied to quantify human endogenous compounds such as beta-endorphin and apolipoprotein A-I (80,81). Nowadays, this method is a frequently used standard technique which is used to quantify a broad variety of target proteins including serum proteins, hormones and other biomarkers (82–84).
In 2008, mass spectrometry-based targeted proteomics were introduced to the field of membrane transporters by Tetsuya Terasaki and Yurong Lai (49,51). Both groups and others contributed in the meanwhile several manuscripts that quantified different ABC- and SLC transporters as well as metabolizing enzymes in different human tissues (liver, brain and kidney), human cells (hepatocytes, platelets), transfected cell lines and animals (46–64).
The basic principle of the method is to measure proteospecific peptides generated by a tryptic digest as surrogates for the respective protein. Figure 4 demonstrates the general workflow of the method with ABCB1 as an example.
Fig. 4.
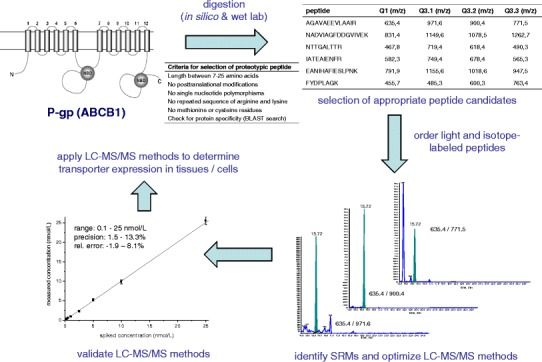
Graphical summary of the workflow needed to set up a reliable LC-MS/MS for transporter protein quantification
Method Development
The first and most critical step is the selection of an appropriate peptide candidate for protein quantification. A very easy way to so is to perform an in silico trypsin digestion for the protein of interest by using well-established proteomic web tools such as UniProtKB/Swiss-Prot (http://web.expasy.org) or ProteinProspector (http://prospector.ucsf.edu). However, these prediction algorithms will simply identify all possible tryptic peptides (cleavage after arginine and lysine) but will ignore important biological facts which have to be considered in the following selection process. Here, the following aspects should be taken into account: (1) the mass of the selected peptide must be within the mass range of the used mass spectrometer (but at least seven amino acids to assure protein specificity); (2) the peptide should not contain posttranslational modifications (only few experimentally proven modifications, prediction via online tools such as NetPhos, NetNGlyc, NetOGlyc); (3) the peptide should not contain amino acid exchanges due to genetic polymorphisms (if so, allele frequency should be below 1%); (4) the peptide should not be located within a transmembrane region of the protein to exclude inefficient trypsin digestion; (5) the amino acid sequence should not contain repeated sequences of arginine and lysine due to the risk of missed cleavage by trypsin; (6) the peptide should not contain cysteine, methionine and tryptophan due to stability issues and (7) the protein (and species) specificity must be verified by BLAST search analysis.
Finally, the selection procedure will result in a list of potential peptide candidates eligible for protein quantification. However, in the case of large proteins such as ABCB1 (1,280 amino acids), there is still a substantial number of peptides remaining; in the case of ABCB1 17 peptides. To assure that we will pick the right peptide candidate, we always perform in parallel wet-lab trypsin digestions for the protein of interest using transporter over-expressing cell lines or commercially available membrane preparations. Afterwards, we perform a so-called shot-gun proteomics experiment to identify the experimentally observable peptides (85). Only the peptides which were theoretically predicted and experimentally proven are considered as reliable candidates for quantification. The final step is to identify the peptide specific mass transitions, the so-called multiple reaction monitoring (MRM) mass to charge (m/z) ratios. For this purpose, we order crude peptides for all final candidates and perform a mass spectrometric optimization comparable to that for small molecules. For each peptide, we use the three MRMs of the highest signal intensity for detection.
There are also free web-based or vendor-specific prediction tools available to forecast appropriate MRMs such as Skyline, MIDAS workflow, ProteinPilot, MRMPilot, PinPoint, PeptideAtlas or PeptideArt (86). However, most of these algorithms are based on empirical data from different training sets of proteins, which bear the risk that superior peptides or mass transitions may be overseen.
After collection of all relevant data for mass spectrometric detection, the chromatographic behaviour has to be investigated. Due to the complexity of the digested biological matrix, the chromatography is exclusively performed with gradient elution (mostly going from 1–5% to 30–50% acetonitrile over 20–60 min) using reverse phase C18 columns. In contrast to peptide identification via shotgun experiments, MRM quantification methods mostly use a more robust high flow rate chromatography (200–500 μl/min), the efficiency of which can be markedly increased by using UHPLC systems. Considering a run time of approximately 20–30 min, the daily sample throughput of these methods is moderate (30–60 samples).
Although MRM methods allow multiplex quantification of several proteins in one analytical run, the number of simultaneously measured peptides is not unlimited but restricted by the following aspects: (1) a practical analytical run time (length of gradient); (2) the number of peptides monitored per protein; (3) the number of monitored mass transitions per peptide (e.g. six for each transporter peptide and its internal standard peptide when using three MRMs per peptide); (4) a reliable dwell time (time needed for each MRM experiment) of at least 30 ms; and (5) a feasible cycle time (cycle time = number of proteins × number of peptides/protein × 2 (factor for internal standard peptides) × number of MRMs/peptide × dwell time/MRM). Considering typical LC-MS experiments with peak widths of about 10–20 s, the cycle time should be adjusted to allow at least eight data points per peak for a reliable quantification (i.e. cycle times of 1–2 s are acceptable). Figure 5 demonstrates the influence of dwell time and cycle time on the LC-MS/MS analysis of a single peptide (three transitions). One can easily see that the shorter the dwell time, the more data points are generated per peak. However, associated to this the shape, symmetry and height of the peak become more and more worse. Although some authors recommend a dwell time below 10 ms (50,60–63), we can only recommend 30 ms as a lower limit for reliable quantification (Fig. 5). Using this dwell time, the number of simultaneously quantified proteins is limited to six assuming the quantification of one peptide/protein, the use of three MRMs/peptide and typical peak widths of 10 s. To increase this number, the principle of scheduled MRM was introduced; i.e. the mass spectrometry method is divided into different time segments in which different mass transitions will be monitored in dependence on the known retention time of the respective peptide peak. These methods were shown to quantify dozens of peptides in one analytical run (87).
Fig. 5.
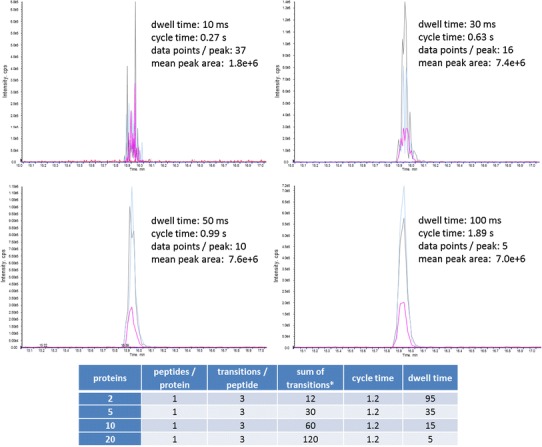
Relationship between the applied dwell time and cycle time of mass spectrometric detection of three mass transitions from one peptide and resulting chromatographic peaks. Table below demonstrates resulting dwell time for unscheduled MRM methods in dependence on the number of monitored proteins at a cycle time of 1.2 s which allows a sufficient peak quantification for a peak width of 10 s (asterisk sum for unlabeled and stable isotope labeled peptides)
Finally, the peptide(s) which result in the highest intensity and the best chromatographic properties (i.e. no interference with signals from the biological matrix, co-elution of all mass transitions from one peptide) will be ordered in high analytical quality as light and stable isotope labelled version (internal standard) for further method validation.
It is beyond the scope of this article to give a comprehensive tutorial to set up these methods, but we can highly recommend excellent reviews for this (44,45,88). There are also several free online prediction tools and online data repositories for MRM-based quantification of proteins available which also contain data for transporter proteins such as PeptideAtlas, SRMAtlas or the Global Proteome Machine Database. In addition to the aforementioned predicted data and own experimental data, these information may be helpful to set up sound quantitative methods for targeted transporter proteomics.
Method Validation and Application of Targeted Proteomics to Human Intestinal Samples
Before the analytical assay can be applied to biological samples, the method has to be comprehensively validated to assure reliable measurements. Although this step is obligatory and well accepted for the quantification of small molecules, validation data for quantitative proteomic assays are rarely found in the literature (51,60).
As targeted proteomics assays are multistep methods, all steps need to be optimized or standardized and if possible validated, i.e. sample preparation, membrane protein extraction, protein digestion and LC-MS/MS analysis. Very recently, we described a comprehensive method validation procedure for the quantification of ten clinically relevant transporter proteins in human intestinal tissue (89).
A minimal method validation should contain at least the following parameters as suggested by bioanalytical method validation guidelines (FDA and EMA): (1) selectivity (no interference with signals from the matrix or other peptides); (2) linearity (definition of LLOQ); (3) within-day and between-day accuracy and precision; (4) peptide stability (e.g. freeze–thaw stability, post-preparative stability, stability during digestion, stability under storage conditions) and (5) digestion efficiency (time course of protein digestion). In order to assure reproducible sample preparation, membrane protein extraction and protein digestion, we apply standardized protocols and use if possible commercially available kits such as the ProteoExtract® Native Membrane Protein Extraction kit (89).
One challenging aspect during the process of method validation is that there is mostly no biological blank matrix available. On the other side, it is important to perform the method validation in a matrix comparable to the biological samples of interest because it is expected that the sample preparation and peptide quantification are influenced by the matrix itself (e.g. digestion efficiency, ion suppression in the mass spectrometer). Strategies to overcome this issue are preparation of an artificial matrix mimicking the biological samples (e.g. a digested human protein of identical concentration) or to apply the method of standard addition to a pooled matrix of biological tissue. Finally (if possible), the accuracy of the method should be compared with a different quantitative method (e.g. Western blotting) (49).
We applied our recently developed and validated method to quantify the expression of clinically relevant intestinal uptake and efflux transporters (ABCB1, ABCC2, ABCC3, ABCG2, ASBT, OATP1A2, OATP2B1, OCT1, OCT3 and PEPT1) along the entire human intestine from eight body donors (90).
Applying this method to intestinal samples from our recently established intestinal tissue bank, we assessed the expression pattern given in Fig. 6. These data show that the expression levels of ABCB1, ABCC2, ABCG2 and OATP2B1 are comparable (0.2–0.6 pmol/mg), whereas that of PEPT1 was found to be 7–20-fold higher in human jejunum, i.e. the predominate site of drug absorption. Interestingly, in ileum the expression of ABCB1, ABCC2 and PEPT1 was considerably higher. Although these conclusions are in this case based on protein expression data from only four samples from jejunum and ileum, similar findings have been observed in our more comprehensive expression study using in each case ten samples from the entire intestinal tract from eight donors (90). A similar increase in ABCB1 protein expression from jejunum to ileum was also reported by Mouly et al. (27).
Fig. 6.
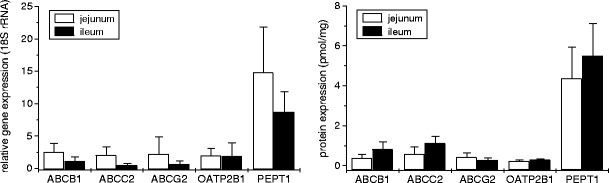
Intestinal mRNA (left) and protein (right) expression of clinically relevant uptake (OATP2B1, PEPT1) and efflux (ABCB1, ABCC2, ABCG2) transporters in human jejunum and ileum from four donors
The transporter protein expression was in accordance with the respective mRNA expression data in jejunum but not in ileum which may be due to different tissue-specific regulation. This again demonstrates the limitation of mRNA expression data alone. In line with this assumption, we were only able to identify substantial correlations between mRNA and protein for ABCB1 and PEPT1 in our recent expression study (90).
A very recent study by Tucker et al. published absolute protein expression data from the human duodenum as observed by Western blotting (42). These expression data (Table III) were markedly different to our data from human jejunum; i.e. ABCB1 (377 vs. 205 fmol/mg), ABCC2 (581 vs. 49 fmol/mg) and ABCG2 (422 vs. 227 fmol/mg). However, we recently observed substantial differences in the expression pattern of several transporter proteins along the small intestine. Thus, these differences may be partly explained by site-dependent differences in intestinal transporter expression. Moreover, as this study also used the crude membrane fraction for analysis, differences in membrane preparation and/or protein extraction procedures may have contributed to these differences (see also “Limitations and Future Perspectives”). Finally, our data are based on the analysis of four donors only, whereas the study of Tucker et al. included tissues from 14 patients which has thereby a markedly higher explanatory power. On the other side, no validation data of the respective Western blot assays which would allow an estimate of the analytical quality have been provided (see further limitations under “Protein Quantification by Immunoblotting”).
In addition to the expression analysis of human intestinal samples, we also characterized the transporter protein expression in Caco-2 cells which is one of the most frequently used in vitro models to characterize the intestinal drug absorption (91) (Fig. 7). Here, we found that the expression of ABCB1 and PEPT1 is very comparable to that in human jejunum. Thus, for these transporters Caco-2 cells may appear as an appropriate in vitro model to conclude on drug absorption in human. However, the expression of OATP2B1 was fourfold higher, while ABCC2 was found to be ∼80% lower than in human jejunum. Surprisingly, the expression of ABCG2 was even below the limit of quantification. These differences in transporter expression may have a substantial impact on interpretation of Caco-2 monolayer studies. Considering this finding and the well-documented variability in the transporter expression in Caco-2 cells in dependence on different laboratory conditions (92), it appears to be mandatory to characterize the transporter protein expression in Caco-2 cells for each transport experiment to avoid misinterpretation of the generated transport data. This information may help to standardize or normalize the respective experimental data comparable to recognize passive diffusion and paracellular transport by monitoring the transfer of propranolol and mannitol.
Fig. 7.
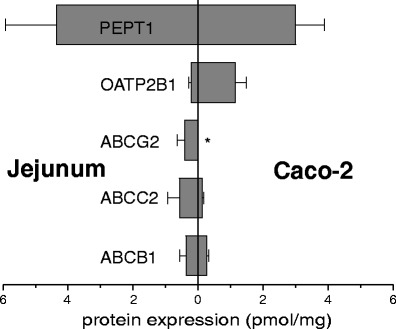
Protein expression of clinically relevant multidrug transporters in human jejunum (N = 4) and in Caco-2 cells (N = 4). Mean ± SD are given (asterisk indicates values below limit of quantification)
POTENTIAL IMPLICATIONS OF INTESTINAL EXPRESSION DATA
From our perspective, the potential value of reliable intestinal transporter protein expression data are (1) to know which transporter proteins are expressed in the intestine; (2) the impact of transporter proteins for the intestinal absorption of different drugs could be estimated or predicted; (3) the contribution of different transporters to intestinal drug–drug interactions caused by transporter induction or inhibition could be elucidated and; (4) site-dependent differences in the intestinal could be explained.
In the following paragraph, we will discuss briefly the potential impact of intestinal expression and function of ABCB1 (P-gp), PEPT1 and OATPs.
The expression data presented in Fig. 6 and from our recent expression analysis study observed in the human jejunum substantial amounts of ABCB1 the expression of which was even higher in the ileum (27,90). This expression pattern fits to site-dependent intestinal absorption phenomena of ABCB1 substrates such as talinolol that have been described. For this beta 1-selective adrenergic blocker, the intestinal absorption after direct administration into the intestine via a catheter was shown to be decreased the more distal the drug was administered most likely caused by a higher ABCB1-mediated efflux in the lower small intestine (25). The same conclusion can be derived from a previous clinical study in which we compared the absorption of talinolol after administration of different dosage forms, namely a capsule and an enteric-coated tablet (26). Again, the drug release in more distal intestinal segments by the enteric-coated tablet caused a substantial loss in oral bioavailability (AUC, 1.33 μg × h/ml vs. 2.64 μg × h/ml, p < 0.05), while the absorption of paracetamol which was present in the same dosage form was not affected (AUC, 3.72 μg × h/ml vs. 3.96 μg × h/ml, NS). The differences in oral absorption of digoxin in dependence on the administered dosage form may also be due to a higher ABCB1 expression in more distal parts of the small intestine. While digoxin solution is nearly completely absorbed, the bioavailability of elixirs and immediate release tablets which are absorbed in deeper intestinal segments is incomplete and accounts for 60–80% and 70–85% (93).
Considering the nearly parallel expression pattern of ABCB1 and PXR along the intestine (own unpublished mRNA data), it is not surprising that co-administration of prototypic enzyme/transporter inducers such as rifampicin or St. John’s wort results in substantial DDIs (3,8–17). The same is true for inhibition of ABCB1 for example by macrolide antibiotics (Table I).
With respect to SLC transporters, PEPT1 showed the highest expression of all investigated transporters and was almost exclusively expressed in the small intestine with highest abundance in ileum, whereas the OATP2B1 expression was markedly lower but homogeneous in jejunum and ileum. Interestingly, we could not detect neither mRNA nor protein expression for OATP1A2 in our previous expression analysis (90). This is an interesting finding because OATP1A2 was reported to be expressed in the human intestine and is frequently speculated to be a potential intestinal uptake carrier for several drugs such as talinolol, fexofenadine and aliskiren (8,15,19,72). Moreover, several interaction studies with grapefruit juice were explained by inhibition of OATP1A2 as the grapefruit juice flavonoid naringin was shown to be a potent OATP1A2 inhibitor in vitro (94). However, in view of our expression data, we assume that rather OATP2B1 than OATP1A2 may be the responsible transporter behind these interactions because this protein is expressed along the entire intestine, accepts OATP1A2 substrates (e.g. talinolol) and can also be inhibited by fruit juices (95).
The high intestinal expression of the di- and tripeptide transporter PEPT1 suggests a substantial role in the intestinal uptake of peptide-like compounds. Indeed, ß-lactam antibiotics such as amoxicillin or cefadroxil, ACE inhibitors (captopril, benazepril, enalapril, fosinopril) and antiviral drugs valacyclovir and oseltamivir have been described as PEPT1 substrates (29). Considering the predominate expression of PEPT1 in the upper small intestine, one could speculate that PEPT1 substrates may be exclusively absorbed in these intestinal segments. This assumption is supported by few clinical studies, which demonstrated only a substantial drug absorption after intestinal infusion of the PEPT1 substrates amoxicillin and benazepril to the small intestine but not to colon (23,24). However, systematic data on drug affinity or DDIs for PEPT1 are not available which may also be due to its narrow substrate spectrum or its transport characteristics (low affinity/high capacity).
In conclusion, intestinal transporter protein data could provide deeper insights into the intestinal drug processing. Using sophisticated in silico tools such as SimCyp or GastroPlus, these data may allow prediction of intestinal drug absorption, DDI and site-dependent intestinal absorption phenomena (5,6,28). Finally, these in vivo predictions could be refined by using Ussing chamber perfusion data from human intestinal tissue which allows biorelevant insights into the intestinal transporter function (96).
LIMITATIONS AND FUTURE PERSPECTIVES
Mass spectrometry-based targeted proteomics is a promising novel tool to determine simultaneously the expression of several transporters in a reliable manner by using validated assays. Consequently, this method was frequently used in recent applications to study the expression, regulation and function of transporters in in vitro models, animals and human tissues (46–64). These expression data may improve our current understanding of transporter-mediated drug possessing, e.g. at the intestinal absorption barrier. In association with prediction algorithms, these data may enable predictions of transporter function in vivo.
Despite the convincing quality of mass spectrometry-based protein quantification methods and first promising expression data, one has to keep in mind also some limitations of targeted proteomics which apply to all so far available methods and applications.
Firstly, all methods published so far (including our data) are based on the quantification of a single proteospecific peptide only. Assuming different trypsin digestion efficiency at different regions of the proteins and potential posttranslational modifications that may occur, the appearance of tryptic peptides may differ. Thus, it appears necessary to verify the protein expression at least by using two to three different peptides. The lack of experimentally proven posttranslational modifications of transporter proteins (mostly prediction tools such as NetPhos are used) also illustrates the need of verification by independent peptide candidates.
Secondly, the digestion efficiency between the different transporter proteins being monitored in one assay may differ. However, due to the lack of purified transporter proteins this issue is hard to address. It is also worth to notice that the digestion efficiency can also differ somewhat for one protein in different samples, which can be normalized by using SILAC-labelled internal standard proteins as described recently (46).
Thirdly, the observed protein expression may not necessarily be associated with the protein function due to intracellular localisation of the transporter. This aspect also directs the attention to the membrane fraction used for tryptic digestion. Although only the portion of transporter proteins localized in the outer membrane (plasma membrane) can contribute to transporter function, it is very challenging to isolate the plasma membrane fraction alone in a reliable and reproducible manner. Moreover, considering only the protein that is expressed in the plasma membrane may neglect any protein regulation or protein traffic to the cell surface which was shown to take place within few minutes (97,98). Consequently, we and others decided to consider the whole membrane fraction.
Finally, the protein expression data should be normalized to a cell or tissue-specific protein comparable to normalization of mRNA expression data by housekeeping genes. These protein markers that should be measured in parallel to the transporters of interest normalize for differences in membrane protein isolation when using a plasma membrane marker such as Na/K-ATPase or differences in the fraction of a specific cell type in a tissue sample (e.g. vilin-1 for enterocytes). However, as an essential prerequisite, these reference proteins must be stably expressed in the tissue of interest.
All of the aforementioned limitations are from our point of view no knockout criteria for available protein expression data generated by targeted proteomics but needs to be addressed by further research projects to assure that this thrilling technique generates reliable protein expression data.
Because it is today well established that the intestine is equipped with a complex network of phase I and II enzymes and transporter proteins which work in concert to limit the intestinal absorption of xenobiotics, the so far available intestinal expression data for transporters need to be extended by expression data for relevant metabolizing enzymes which has so far only been done by mRNA expression analysis (99–101).
ACKNOWLEDGMENTS
This study was supported by the German Federal Ministry for Education and Research (grant 03IPT612X, InnoProfile-Transfer).
Conflict of Interest
The authors declare no conflict of interest.
REFERENCES
- 1.Fisher MB, Labissiere G. The role of the intestine in drug metabolism and pharmacokinetics: an industry perspective. Curr Drug Metab. 2007;8(7):694–699. doi: 10.2174/138920007782109788. [DOI] [PubMed] [Google Scholar]
- 2.Darwich AS, Neuhoff S, Jamei M, Rostami-Hodjegan A. Interplay of metabolism and transport in determining oral drug absorption and gut wall metabolism: a simulation assessment using the “Advanced Dissolution, Absorption, Metabolism (ADAM)” model. Curr Drug Metab. 2010;11(9):716–729. doi: 10.2174/138920010794328913. [DOI] [PubMed] [Google Scholar]
- 3.Konig J, Muller F, Fromm MF. Transporters and drug–drug interactions: important determinants of drug disposition and effects. Pharmacol Rev. 2013;65(3):944–966. doi: 10.1124/pr.113.007518. [DOI] [PubMed] [Google Scholar]
- 4.Zhang Y, Benet LZ. The gut as a barrier to drug absorption: combined role of cytochrome P450 3A and P-glycoprotein. Clin Pharmacokinet. 2001;40(3):159–168. doi: 10.2165/00003088-200140030-00002. [DOI] [PubMed] [Google Scholar]
- 5.Harwood MD, Neuhoff S, Carlson GL, Warhurst G, Rostami-Hodjegan A. Absolute abundance and function of intestinal drug transporters: a prerequisite for fully mechanistic in vitro-in vivo extrapolation of oral drug absorption. Biopharm Drug Dispos. 2013;34(1):2–28. doi: 10.1002/bdd.1810. [DOI] [PubMed] [Google Scholar]
- 6.Bruyere A, Decleves X, Bouzom F, Ball K, Marques C, Treton X, et al. Effect of variations in the amounts of P-glycoprotein (ABCB1), BCRP (ABCG2) and CYP3A4 along the human small intestine on PBPK models for predicting intestinal first pass. Mol Pharm. 2010;7(5):1596–1607. doi: 10.1021/mp100015x. [DOI] [PubMed] [Google Scholar]
- 7.Giacomini KM, Huang SM, Tweedie DJ, Benet LZ, Brouwer KL, Chu X, et al. Membrane transporters in drug development. Nat Rev Drug Discov. 2010;9(3):215–236. doi: 10.1038/nrd3028. [DOI] [PMC free article] [PubMed] [Google Scholar]
- 8.Dresser GK, Bailey DG, Leake BF, Schwarz UI, Dawson PA, Freeman DJ, et al. Fruit juices inhibit organic anion transporting polypeptide-mediated drug uptake to decrease the oral availability of fexofenadine. Clin Pharmacol Ther. 2002;71(1):11–20. doi: 10.1067/mcp.2002.121152. [DOI] [PubMed] [Google Scholar]
- 9.Hamman MA, Bruce MA, Haehner-Daniels BD, Hall SD. The effect of rifampin administration on the disposition of fexofenadine. Clin Pharmacol Ther. 2001;69(3):114–121. doi: 10.1067/mcp.2001.113697. [DOI] [PubMed] [Google Scholar]
- 10.Kusuhara H, Miura M, Yasui-Furukori N, Yoshida K, Akamine Y, Yokochi M, et al. Effect of coadministration of single and multiple doses of rifampicin on the pharmacokinetics of fexofenadine enantiomers in healthy subjects. Drug Metab Dispos. 2013;41(1):206–213. doi: 10.1124/dmd.112.048330. [DOI] [PubMed] [Google Scholar]
- 11.Oswald S, Haenisch S, Fricke C, Sudhop T, Remmler C, Giessmann T, et al. Intestinal expression of P-glycoprotein (ABCB1), multidrug resistance associated protein 2 (ABCC2), and uridine diphosphate-glucuronosyltransferase 1A1 predicts the disposition and modulates the effects of the cholesterol absorption inhibitor ezetimibe in humans. Clin Pharmacol Ther. 2006;79(3):206–217. doi: 10.1016/j.clpt.2005.11.004. [DOI] [PubMed] [Google Scholar]
- 12.Oswald S, Giessmann T, Luetjohann D, Wegner D, Rosskopf D, Weitschies W, et al. Disposition and sterol-lowering effect of ezetimibe are influenced by single-dose coadministration of rifampin, an inhibitor of multidrug transport proteins. Clin Pharmacol Ther. 2006;80(5):477–485. doi: 10.1016/j.clpt.2006.07.006. [DOI] [PubMed] [Google Scholar]
- 13.Rengelshausen J, Goggelmann C, Burhenne J, Riedel KD, Ludwig J, Weiss J, et al. Contribution of increased oral bioavailability and reduced nonglomerular renal clearance of digoxin to the digoxin–clarithromycin interaction. Br J Clin Pharmacol. 2003;56(1):32–38. doi: 10.1046/j.1365-2125.2003.01824.x. [DOI] [PMC free article] [PubMed] [Google Scholar]
- 14.Schwarz UI, Gramatte T, Krappweis J, Oertel R, Kirch W. P-glycoprotein inhibitor erythromycin increases oral bioavailability of talinolol in humans. Int J Clin Pharmacol Ther. 2000;38(4):161–167. doi: 10.5414/CPP38161. [DOI] [PubMed] [Google Scholar]
- 15.Schwarz UI, Seemann D, Oertel R, Miehlke S, Kuhlisch E, Fromm MF, et al. Grapefruit juice ingestion significantly reduces talinolol bioavailability. Clin Pharmacol Ther. 2005;77(4):291–301. doi: 10.1016/j.clpt.2004.11.111. [DOI] [PubMed] [Google Scholar]
- 16.Westphal K, Weinbrenner A, Zschiesche M, Franke G, Knoke M, Oertel R, et al. Induction of P-glycoprotein by rifampin increases intestinal secretion of talinolol in human beings: a new type of drug/drug interaction. Clin Pharmacol Ther. 2000;68(4):345–355. doi: 10.1067/mcp.2000.109797. [DOI] [PubMed] [Google Scholar]
- 17.Greiner B, Eichelbaum M, Fritz P, Kreichgauer HP, Von RO, Zundler J, et al. The role of intestinal P-glycoprotein in the interaction of digoxin and rifampin. J Clin Invest. 1999;104(2):147–153. doi: 10.1172/JCI6663. [DOI] [PMC free article] [PubMed] [Google Scholar]
- 18.Hediger MA, Romero MF, Peng JB, Rolfs A, Takanaga H, Bruford EA. The ABCs of solute carriers: physiological, pathological and therapeutic implications of human membrane transport proteinsIntroduction. Pflugers Arch. 2004;447(5):465–468. doi: 10.1007/s00424-003-1192-y. [DOI] [PubMed] [Google Scholar]
- 19.Tamai I. Oral drug delivery utilizing intestinal OATP transporters. Adv Drug Deliv Rev. 2012;64(6):508–514. doi: 10.1016/j.addr.2011.07.007. [DOI] [PubMed] [Google Scholar]
- 20.Paine MF, Hart HL, Ludington SS, Haining RL, Rettie AE, Zeldin DC. The human intestinal cytochrome P450 “pie”. Drug Metab Dispos. 2006;34(5):880–6. [DOI] [PMC free article] [PubMed]
- 21.Riches Z, Stanley EL, Bloomer JC, Coughtrie MW. Quantitative evaluation of the expression and activity of five major sulfotransferases (SULTs) in human tissues: the SULT “pie”. Drug Metab Dispos. 2009;37(11):2255–61. [DOI] [PMC free article] [PubMed]
- 22.Harbourt DE, Fallon JK, Ito S, Baba T, Ritter JK, Glish GL, et al. Quantification of human uridine-diphosphate glucuronosyl transferase 1A isoforms in liver, intestine, and kidney using nanobore liquid chromatography-tandem mass spectrometry. Anal Chem. 2012;84(1):98–105. [DOI] [PMC free article] [PubMed]
- 23.Barr WH, Zola EM, Candler EL, Hwang SM, Tendolkar AV, Shamburek R, et al. Differential absorption of amoxicillin from the human small and large intestine. Clin Pharmacol Ther. 1994;56(3):279–285. doi: 10.1038/clpt.1994.138. [DOI] [PubMed] [Google Scholar]
- 24.Chan KK, Buch A, Glazer RD, John VA, Barr WH. Site-differential gastrointestinal absorption of benazepril hydrochloride in healthy volunteers. Pharm Res. 1994;11(3):432–437. doi: 10.1023/A:1018925407109. [DOI] [PubMed] [Google Scholar]
- 25.Gramatte T, Oertel R, Terhaag B, Kirch W. Direct demonstration of small intestinal secretion and site-dependent absorption of the beta-blocker talinolol in humans. Clin Pharmacol Ther. 1996;59(5):541–549. doi: 10.1016/S0009-9236(96)90182-4. [DOI] [PubMed] [Google Scholar]
- 26.Weitschies W, Bernsdorf A, Giessmann T, Zschiesche M, Modess C, Hartmann V, et al. The talinolol double-peak phenomenon is likely caused by presystemic processing after uptake from gut lumen. Pharm Res. 2005;22(5):728–735. doi: 10.1007/s11095-005-2588-5. [DOI] [PubMed] [Google Scholar]
- 27.Mouly S, Paine MF. P-glycoprotein increases from proximal to distal regions of human small intestine. Pharm Res. 2003;20(10):1595–1599. doi: 10.1023/A:1026183200740. [DOI] [PubMed] [Google Scholar]
- 28.Tachibana T, Kato M, Takano J, Sugiyama Y. Predicting drug–drug interactions involving the inhibition of intestinal CYP3A4 and P-glycoprotein. Curr Drug Metab. 2010;11(9):762–777. doi: 10.2174/138920010794328922. [DOI] [PubMed] [Google Scholar]
- 29.Varma MV, Ambler CM, Ullah M, Rotter CJ, Sun H, Litchfield J, et al. Targeting intestinal transporters for optimizing oral drug absorption. Curr Drug Metab. 2010;11(9):730–742. doi: 10.2174/138920010794328850. [DOI] [PubMed] [Google Scholar]
- 30.Englund G, Rorsman F, Ronnblom A, Karlbom U, Lazorova L, Grasjo J, et al. Regional levels of drug transporters along the human intestinal tract: co-expression of ABC and SLC transporters and comparison with Caco-2 cells. Eur J Pharm Sci. 2006;29(3–4):269–277. doi: 10.1016/j.ejps.2006.04.010. [DOI] [PubMed] [Google Scholar]
- 31.Gutmann H, Hruz P, Zimmermann C, Beglinger C, Drewe J. Distribution of breast cancer resistance protein (BCRP/ABCG2) mRNA expression along the human GI tract. Biochem Pharmacol. 2005;70(5):695–699. doi: 10.1016/j.bcp.2005.05.031. [DOI] [PubMed] [Google Scholar]
- 32.Hilgendorf C, Ahlin G, Seithel A, Artursson P, Ungell AL, Karlsson J. Expression of thirty-six drug transporter genes in human intestine, liver, kidney, and organotypic cell lines. Drug Metab Dispos. 2007;35(8):1333–1340. doi: 10.1124/dmd.107.014902. [DOI] [PubMed] [Google Scholar]
- 33.Meier Y, Eloranta JJ, Darimont J, Ismair MG, Hiller C, Fried M, et al. Regional distribution of solute carrier mRNA expression along the human intestinal tract. Drug Metab Dispos. 2007;35(4):590–594. doi: 10.1124/dmd.106.013342. [DOI] [PubMed] [Google Scholar]
- 34.Nakamura T, Sakaeda T, Ohmoto N, Tamura T, Aoyama N, Shirakawa T, et al. Real-time quantitative polymerase chain reaction for MDR1, MRP1, MRP2, and CYP3A-mRNA levels in Caco-2 cell lines, human duodenal enterocytes, normal colorectal tissues, and colorectal adenocarcinomas. Drug Metab Dispos. 2002;30(1):4–6. doi: 10.1124/dmd.30.1.4. [DOI] [PubMed] [Google Scholar]
- 35.Nishimura M, Naito S. Tissue-specific mRNA expression profiles of human ATP-binding cassette and solute carrier transporter superfamilies. Drug Metab Pharmacokinet. 2005;20(6):452–477. doi: 10.2133/dmpk.20.452. [DOI] [PubMed] [Google Scholar]
- 36.Seithel A, Karlsson J, Hilgendorf C, Bjorquist A, Ungell AL. Variability in mRNA expression of ABC- and SLC-transporters in human intestinal cells: comparison between human segments and Caco-2 cells. Eur J Pharm Sci. 2006;28(4):291–299. doi: 10.1016/j.ejps.2006.03.003. [DOI] [PubMed] [Google Scholar]
- 37.Taipalensuu J, Tornblom H, Lindberg G, Einarsson C, Sjoqvist F, Melhus H, et al. Correlation of gene expression of ten drug efflux proteins of the ATP-binding cassette transporter family in normal human jejunum and in human intestinal epithelial Caco-2 cell monolayers. J Pharmacol Exp Ther. 2001;299(1):164–170. [PubMed] [Google Scholar]
- 38.Thorn M, Finnstrom N, Lundgren S, Rane A, Loof L. Cytochromes P450 and MDR1 mRNA expression along the human gastrointestinal tract. Br J Clin Pharmacol. 2005;60(1):54–60. doi: 10.1111/j.1365-2125.2005.02389.x. [DOI] [PMC free article] [PubMed] [Google Scholar]
- 39.Zimmermann C, Gutmann H, Hruz P, Gutzwiller JP, Beglinger C, Drewe J. Mapping of multidrug resistance gene 1 and multidrug resistance-associated protein isoform 1 to 5 mRNA expression along the human intestinal tract. Drug Metab Dispos. 2005;33(2):219–224. doi: 10.1124/dmd.104.001354. [DOI] [PubMed] [Google Scholar]
- 40.Terada T, Shimada Y, Pan X, Kishimoto K, Sakurai T, Doi R, et al. Expression profiles of various transporters for oligopeptides, amino acids and organic ions along the human digestive tract. Biochem Pharmacol. 2005;70(12):1756–1763. doi: 10.1016/j.bcp.2005.09.027. [DOI] [PubMed] [Google Scholar]
- 41.Berggren S, Gall C, Wollnitz N, Ekelund M, Karlbom U, Hoogstraate J, et al. Gene and protein expression of P-glycoprotein, MRP1, MRP2, and CYP3A4 in the small and large human intestine. Mol Pharm. 2007;4(2):252–257. doi: 10.1021/mp0600687. [DOI] [PubMed] [Google Scholar]
- 42.Tucker TG, Milne AM, Fournel-Gigleux S, Fenner KS, Coughtrie MW. Absolute immunoquantification of the expression of ABC transporters P-glycoprotein, breast cancer resistance protein and multidrug resistance-associated protein 2 in human liver and duodenum. Biochem Pharmacol. 2012;83(2):279–285. doi: 10.1016/j.bcp.2011.10.017. [DOI] [PubMed] [Google Scholar]
- 43.Tweedie D, Polli JW, Gil BE, Huang SM, Zhang L, Poirier A, et al. Transporter studies in drug development: experience to date and follow up on decision trees from the international transporter consortium. Clin Pharmacol Ther 2013; 94(1): 113–25. [DOI] [PubMed]
- 44.Picotti P, Aebersold R. Selected reaction monitoring-based proteomics: workflows, potential, pitfalls and future directions. Nat Methods. 2012;9(6):555–566. doi: 10.1038/nmeth.2015. [DOI] [PubMed] [Google Scholar]
- 45.Gallien S, Duriez E, Domon B. Selected reaction monitoring applied to proteomics. J Mass Spectrom. 2011;46(3):298–312. doi: 10.1002/jms.1895. [DOI] [PubMed] [Google Scholar]
- 46.Balogh L, Kimoto E, Chupka J, Zhang H, Lai Y. Membrane protein quantification by peptide-based mass spectrometry approaches: studies on the organic anion-transporting polypeptide family. J Proteomics Bioinform 2012.
- 47.Deo AK, Prasad B, Balogh L, Lai Y, Unadkat JD. Interindividual variability in hepatic expression of the multidrug resistance-associated protein 2 (MRP2/ABCC2): quantification by liquid chromatography/tandem mass spectrometry. Drug Metab Dispos. 2012;40(5):852–855. doi: 10.1124/dmd.111.043810. [DOI] [PMC free article] [PubMed] [Google Scholar]
- 48.Ji C, Tschantz WR, Pfeifer ND, Ullah M, Sadagopan N. Development of a multiplex UPLC-MRM MS method for quantification of human membrane transport proteins OATP1B1, OATP1B3 and OATP2B1 in in vitro systems and tissues. Anal Chim Acta. 2012;717:67–76. doi: 10.1016/j.aca.2011.12.005. [DOI] [PubMed] [Google Scholar]
- 49.Kamiie J, Ohtsuki S, Iwase R, Ohmine K, Katsukura Y, Yanai K, et al. Quantitative atlas of membrane transporter proteins: development and application of a highly sensitive simultaneous LC/MS/MS method combined with novel in-silico peptide selection criteria. Pharm Res. 2008;25(6):1469–1483. doi: 10.1007/s11095-008-9532-4. [DOI] [PubMed] [Google Scholar]
- 50.Kawakami H, Ohtsuki S, Kamiie J, Suzuki T, Abe T, Terasaki T. Simultaneous absolute quantification of 11 cytochrome P450 isoforms in human liver microsomes by liquid chromatography tandem mass spectrometry with In silico target peptide selection. J Pharm Sci 2011; 100(1):341–52. [DOI] [PubMed]
- 51.Li N, Nemirovskiy OV, Zhang Y, Yuan H, Mo J, Ji C, et al. Absolute quantification of multidrug resistance-associated protein 2 (MRP2/ABCC2) using liquid chromatography tandem mass spectrometry. Anal Biochem. 2008;380(2):211–222. doi: 10.1016/j.ab.2008.05.032. [DOI] [PubMed] [Google Scholar]
- 52.Li N, Palandra J, Nemirovskiy OV, Lai Y. LC-MS/MS mediated absolute quantification and comparison of bile salt export pump and breast cancer resistance protein in livers and hepatocytes across species. Anal Chem. 2009;81(6):2251–2259. doi: 10.1021/ac8024009. [DOI] [PubMed] [Google Scholar]
- 53.Miliotis T, Ali L, Palm JE, Lundqvist AJ, Ahnoff M, Andersson TB, et al. Development of a highly sensitive method using liquid chromatography-multiple reaction monitoring to quantify membrane P-glycoprotein in biological matrices and relationship to transport function. Drug Metab Dispos. 2011;39(12):2440–2449. doi: 10.1124/dmd.111.040774. [DOI] [PubMed] [Google Scholar]
- 54.Niessen J, Jedlitschky G, Grube M, Bien S, Schwertz H, Ohtsuki S, et al. Human platelets express organic anion-transporting peptide 2B1, an uptake transporter for atorvastatin. Drug Metab Dispos. 2009;37(5):1129–1137. doi: 10.1124/dmd.108.024570. [DOI] [PubMed] [Google Scholar]
- 55.Ohtsuki S, Uchida Y, Kubo Y, Terasaki T. Quantitative targeted absolute proteomics-based ADME research as a new path to drug discovery and development: methodology, advantages, strategy, and prospects. J Pharm Sci. 2011;100(9):3547–3559. doi: 10.1002/jps.22612. [DOI] [PubMed] [Google Scholar]
- 56.Ohtsuki S, Schaefer O, Kawakami H, Inoue T, Liehner S, Saito A, et al. Simultaneous absolute protein quantification of transporters, cytochromes P450, and UDP-glucuronosyltransferases as a novel approach for the characterization of individual human liver: comparison with mRNA levels and activities. Drug Metab Dispos. 2012;40(1):83–92. doi: 10.1124/dmd.111.042259. [DOI] [PubMed] [Google Scholar]
- 57.Ohtsuki S, Ikeda C, Uchida Y, Sakamoto Y, Miller F, Glacial F, et al. Quantitative targeted absolute proteomic analysis of transporters, receptors and junction proteins for validation of human cerebral microvascular endothelial cell line hCMEC/D3 as a human blood–brain barrier model. Mol Pharm. 2013;10(1):289–296. doi: 10.1021/mp3004308. [DOI] [PubMed] [Google Scholar]
- 58.Prasad B, Lai Y, Lin Y, Unadkat JD. Interindividual variability in the hepatic expression of the human breast cancer resistance protein (BCRP/ABCG2): Effect of age, sex, and genotype. J Pharm Sci. 2013;102(3):787–793. doi: 10.1002/jps.23436. [DOI] [PubMed] [Google Scholar]
- 59.Qiu X, Bi YA, Balogh LM, Lai Y. Absolute measurement of species differences in sodium taurocholate cotransporting polypeptide (NTCP/Ntcp) and its modulation in cultured hepatocytes. J Pharm Sci 2013. doi:10.1002/jps.23582. [DOI] [PubMed]
- 60.Sakamoto A, Matsumaru T, Ishiguro N, Schaefer O, Ohtsuki S, Inoue T, et al. Reliability and robustness of simultaneous absolute quantification of drug transporters, cytochrome P450 enzymes, and Udp-glucuronosyltransferases in human liver tissue by multiplexed MRM/selected reaction monitoring mode tandem mass spectrometry with nano-liquid chromatography. J Pharm Sci. 2011;100(9):4037–4043. doi: 10.1002/jps.22591. [DOI] [PubMed] [Google Scholar]
- 61.Sakamoto A, Matsumaru T, Yamamura N, Uchida Y, Tachikawa M, Ohtsuki S, et al. Quantitative expression of human drug transporter proteins in lung tissues: Analysis of regional, gender, and interindividual differences by liquid chromatography-tandem mass spectrometry. J Pharm Sci 2013 May 13. doi:10.1002/jps.23606 [DOI] [PubMed]
- 62.Schaefer O, Ohtsuki S, Kawakami H, Inoue T, Liehner S, Saito A, et al. Absolute quantification and differential expression of drug transporters, cytochrome P450 enzymes, and UDP-glucuronosyltransferases in cultured primary human hepatocytes. Drug Metab Dispos. 2012;40(1):93–103. doi: 10.1124/dmd.111.042275. [DOI] [PubMed] [Google Scholar]
- 63.Uchida Y, Ohtsuki S, Katsukura Y, Ikeda C, Suzuki T, Kamiie J, et al. Quantitative targeted absolute proteomics of human blood–brain barrier transporters and receptors. J Neurochem. 2011;117(2):333–345. doi: 10.1111/j.1471-4159.2011.07208.x. [DOI] [PubMed] [Google Scholar]
- 64.Zhang Y, Li N, Brown PW, Ozer JS, Lai Y. Liquid chromatography/tandem mass spectrometry based targeted proteomics quantification of P-glycoprotein in various biological samples. Rapid Commun Mass Spectrom. 2011;25(12):1715–1724. doi: 10.1002/rcm.5026. [DOI] [PubMed] [Google Scholar]
- 65.Englund G, Jacobson A, Rorsman F, Artursson P, Kindmark A, Ronnblom A. Efflux transporters in ulcerative colitis: decreased expression of BCRP (ABCG2) and Pgp (ABCB1) Inflamm Bowel Dis. 2007;13(3):291–297. doi: 10.1002/ibd.20030. [DOI] [PubMed] [Google Scholar]
- 66.Wojtal KA, Eloranta JJ, Hruz P, Gutmann H, Drewe J, Staumann A, et al. Changes in mRNA expression levels of solute carrier transporters in inflammatory bowel disease patients. Drug Metab Dispos. 2009;37(9):1871–1877. doi: 10.1124/dmd.109.027367. [DOI] [PubMed] [Google Scholar]
- 67.von RO, Burk O, Fromm MF, Thon KP, Eichelbaum M, Kivisto KT. Cytochrome P450 3A4 and P-glycoprotein expression in human small intestinal enterocytes and hepatocytes: a comparative analysis in paired tissue specimens. Clin Pharmacol Ther. 2004;75(3):172–183. doi: 10.1016/j.clpt.2003.10.008. [DOI] [PubMed] [Google Scholar]
- 68.Gygi SP, Rochon Y, Franza BR, Aebersold R. Correlation between protein and mRNA abundance in yeast. Mol Cell Biol. 1999;19(3):1720–1730. doi: 10.1128/mcb.19.3.1720. [DOI] [PMC free article] [PubMed] [Google Scholar]
- 69.Giessmann T, May K, Modess C, Wegner D, Hecker U, Zschiesche M, et al. Carbamazepine regulates intestinal P-glycoprotein and multidrug resistance protein MRP2 and influences disposition of talinolol in humans. Clin Pharmacol Ther. 2004;76(3):192–200. doi: 10.1016/j.clpt.2004.04.011. [DOI] [PubMed] [Google Scholar]
- 70.Giessmann T, Modess C, Hecker U, Zschiesche M, Dazert P, Kunert-Keil C, et al. CYP2D6 genotype and induction of intestinal drug transporters by rifampin predict presystemic clearance of carvedilol in healthy subjects. Clin Pharmacol Ther. 2004;75(3):213–222. doi: 10.1016/j.clpt.2003.10.004. [DOI] [PubMed] [Google Scholar]
- 71.Haenisch S, May K, Wegner D, Caliebe A, Cascorbi I, Siegmund W. Influence of genetic polymorphisms on intestinal expression and rifampicin-type induction of ABCC2 and on bioavailability of talinolol. Pharmacogenet Genomics. 2008;18(4):357–365. doi: 10.1097/FPC.0b013e3282f974b7. [DOI] [PubMed] [Google Scholar]
- 72.Glaeser H, Bailey DG, Dresser GK, Gregor JC, Schwarz UI, McGrath JS, et al. Intestinal drug transporter expression and the impact of grapefruit juice in humans. Clin Pharmacol Ther. 2007;81(3):362–370. doi: 10.1038/sj.clpt.6100056. [DOI] [PubMed] [Google Scholar]
- 73.Haller S, Schuler F, Lazic SE, Bachir-Cherif D, Kramer SD, Parrott NJ, et al. Expression profiles of metabolic enzymes and drug transporters in the liver and along the intestine of beagle dogs. Drug Metab Dispos 2012; 40(8): 1603–10. [DOI] [PubMed]
- 74.MacLean C, Moenning U, Reichel A, Fricker G. Closing the gaps: a full scan of the intestinal expression of p-glycoprotein, breast cancer resistance protein, and multidrug resistance-associated protein 2 in male and female rats. Drug Metab Dispos. 2008;36(7):1249–1254. doi: 10.1124/dmd.108.020859. [DOI] [PubMed] [Google Scholar]
- 75.Cao X, Gibbs ST, Fang L, Miller HA, Landowski CP, Shin HC, et al. Why is it challenging to predict intestinal drug absorption and oral bioavailability in human using rat model. Pharm Res. 2006;23(8):1675–1686. doi: 10.1007/s11095-006-9041-2. [DOI] [PubMed] [Google Scholar]
- 76.Alegria-Schaffer A, Lodge A, Vattem K. Performing and optimizing Western blots with an emphasis on chemiluminescent detection. Methods Enzymol. 2009;463:573–599. doi: 10.1016/S0076-6879(09)63033-0. [DOI] [PubMed] [Google Scholar]
- 77.MacPhee DJ. Methodological considerations for improving Western blot analysis. J Pharmacol Toxicol Methods. 2010;61(2):171–177. doi: 10.1016/j.vascn.2009.12.001. [DOI] [PubMed] [Google Scholar]
- 78.Oswald S, Hintze D, Peter A, Keiser M, Siegmund W. Comparison of absolute protein quantification by Western blot and MRM-based mass spectrometric analysis. Proteomic Forum. 2011 (Abstract).
- 79.Charette SJ, Lambert H, Nadeau PJ, Landry J. Protein quantification by chemiluminescent Western blotting: elimination of the antibody factor by dilution series and calibration curve. J Immunol Methods. 2010;353(1–2):148–150. doi: 10.1016/j.jim.2009.12.007. [DOI] [PubMed] [Google Scholar]
- 80.Barr JR, Maggio VL, Patterson DG, Jr, Cooper GR, Henderson LO, Turner WE, et al. Isotope dilution–mass spectrometric quantification of specific proteins: model application with apolipoprotein A-I. Clin Chem. 1996;42(10):1676–1682. [PubMed] [Google Scholar]
- 81.Dass C, Kusmierz JJ, Desiderio DM. Mass spectrometric quantification of endogenous beta-endorphin. Biol Mass Spectrom. 1991;20(3):130–138. doi: 10.1002/bms.1200200306. [DOI] [PubMed] [Google Scholar]
- 82.Anderson L, Hunter CL. Quantitative mass spectrometric multiple reaction monitoring assays for major plasma proteins. Mol Cell Proteomics. 2006;5(4):573–588. doi: 10.1074/mcp.M500331-MCP200. [DOI] [PubMed] [Google Scholar]
- 83.Barnidge DR, Dratz EA, Martin T, Bonilla LE, Moran LB, Lindall A. Absolute quantification of the G protein-coupled receptor rhodopsin by LC/MS/MS using proteolysis product peptides and synthetic peptide standards. Anal Chem. 2003;75(3):445–451. doi: 10.1021/ac026154+. [DOI] [PubMed] [Google Scholar]
- 84.Barnidge DR, Goodmanson MK, Klee GG, Muddiman DC. Absolute quantification of the model biomarker prostate-specific antigen in serum by LC-Ms/MS using protein cleavage and isotope dilution mass spectrometry. J Proteome Res. 2004;3(3):644–652. doi: 10.1021/pr049963d. [DOI] [PubMed] [Google Scholar]
- 85.Nesvizhskii AI, Aebersold R. Interpretation of shotgun proteomic data: the protein inference problem. Mol Cell Proteomics. 2005;4(10):1419–1440. doi: 10.1074/mcp.R500012-MCP200. [DOI] [PubMed] [Google Scholar]
- 86.Mead JA, Shadforth IP, Bessant C. Public proteomic MS repositories and pipelines: available tools and biological applications. Proteomics. 2007;7(16):2769–2786. doi: 10.1002/pmic.200700152. [DOI] [PubMed] [Google Scholar]
- 87.Picotti P, Bodenmiller B, Mueller LN, Domon B, Aebersold R. Full dynamic range proteome analysis of S. cerevisiae by targeted proteomics. Cell. 2009;138(4):795–806. doi: 10.1016/j.cell.2009.05.051. [DOI] [PMC free article] [PubMed] [Google Scholar]
- 88.Lange V, Picotti P, Domon B, Aebersold R. Selected reaction monitoring for quantitative proteomics: a tutorial. Mol Syst Biol. 2008;4:222. doi: 10.1038/msb.2008.61. [DOI] [PMC free article] [PubMed] [Google Scholar]
- 89.Gröer C, Brück S, Balogh LM, Lai Y, Paulick A, Busemann A, et al. LC-MS/MS-based quantification of clinically relevant intestinal uptake and efflux transporter proteins. submitted 2013. doi:10.1016/j.jpba.2013.07.031. [DOI] [PubMed]
- 90.Drozdzik M, Penski J, Lapczuk I, Ostrowski M, Balogh LM, Lai Y, et al. Expression of clinically relevant drug transporter proteins along the entire human intestine. Clin Pharmacol Ther. 2013;93:S65. [Google Scholar]
- 91.Hubatsch I, Ragnarsson EG, Artursson P. Determination of drug permeability and prediction of drug absorption in Caco-2 monolayers. Nat Protoc. 2007;2(9):2111–2119. doi: 10.1038/nprot.2007.303. [DOI] [PubMed] [Google Scholar]
- 92.Hayeshi R, Hilgendorf C, Artursson P, Augustijns P, Brodin B, Dehertogh P, et al. Comparison of drug transporter gene expression and functionality in Caco-2 cells from 10 different laboratories. Eur J Pharm Sci. 2008;35(5):383–396. doi: 10.1016/j.ejps.2008.08.004. [DOI] [PubMed] [Google Scholar]
- 93.Oswald S, Terhaag B, Siegmund W. In vivo probes of drug transport: commonly used probe drugs to assess function of intestinal P-glycoprotein (ABCB1) in humans. Handb Exp Pharmacol. 2011;201:403–447. doi: 10.1007/978-3-642-14541-4_11. [DOI] [PubMed] [Google Scholar]
- 94.Bailey DG. Fruit juice inhibition of uptake transport: a new type of food–drug interaction. Br J Clin Pharmacol. 2010;70(5):645–655. doi: 10.1111/j.1365-2125.2010.03722.x. [DOI] [PMC free article] [PubMed] [Google Scholar]
- 95.Shirasaka Y, Shichiri M, Mori T, Nakanishi T, Tamai I. Major active components in grapefruit, orange, and apple juices responsible for OATP2B1-mediated drug interactions. J Pharm Sci. 2013;102(1):280–288. doi: 10.1002/jps.23357. [DOI] [PubMed] [Google Scholar]
- 96.Sjoberg A, Lutz M, Tannergren C, Wingolf C, Borde A, Ungell AL. Comprehensive study on regional human intestinal permeability and prediction of fraction absorbed of drugs using the Ussing chamber technique. Eur J Pharm Sci. 2013;48(1–2):166–180. doi: 10.1016/j.ejps.2012.10.007. [DOI] [PubMed] [Google Scholar]
- 97.Andreose JS, Fumagalli G, Sigworth FJ, Caplan MJ. Real-time detection of the surface delivery of newly synthesized membrane proteins. Proc Natl Acad Sci U S A. 1996;93(15):7661–7666. doi: 10.1073/pnas.93.15.7661. [DOI] [PMC free article] [PubMed] [Google Scholar]
- 98.Hua W, Sheff D, Toomre D, Mellman I. Vectorial insertion of apical and basolateral membrane proteins in polarized epithelial cells revealed by quantitative 3D live cell imaging. J Cell Biol. 2006;172(7):1035–1044. doi: 10.1083/jcb.200512012. [DOI] [PMC free article] [PubMed] [Google Scholar]
- 99.Drozdzik M, Penski J, Lapczuk J, Ostrowski M, Siegmund W, Oswald S. Expression of drug metabolizing enzymes and transporter proteins along the entire human gastrointestinal tract. Clin Pharmacol Ther. 2012;91:S50. doi: 10.1038/clpt.2012.15. [DOI] [Google Scholar]
- 100.Nishimura M, Yaguti H, Yoshitsugu H, Naito S, Satoh T. Tissue distribution of mRNA expression of human cytochrome P450 isoforms assessed by high-sensitivity real-time reverse transcription PCR. Yakugaku Zasshi. 2003;123(5):369–375. doi: 10.1248/yakushi.123.369. [DOI] [PubMed] [Google Scholar]
- 101.Nishimura M, Naito S. Tissue-specific mRNA expression profiles of human phase I metabolizing enzymes except for cytochrome P450 and phase II metabolizing enzymes. Drug Metab Pharmacokinet. 2006;21(5):357–374. doi: 10.2133/dmpk.21.357. [DOI] [PubMed] [Google Scholar]