

Abstract
Flow imaging microscopy was introduced as a technique for protein particle analysis a few years ago and has strongly gained in importance ever since. The aim of the present study was a comparative evaluation of four of the most relevant flow imaging microscopy systems for biopharmaceuticals on the market: Micro-Flow Imaging (MFI)4100, MFI5200, Flow Cytometer And Microscope (FlowCAM) VS1, and FlowCAM PV. Polystyrene standards, particles generated from therapeutic monoclonal antibodies, and silicone oil droplets were analyzed by all systems. The performance was critically assessed regarding quantification, characterization, image quality, differentiation of protein particles and silicone oil droplets, and handling of the systems. The FlowCAM systems, especially the FlowCAM VS1, showed high-resolution images. The FlowCAM PV system provided the most precise quantification of particles of therapeutic monoclonal antibodies, also under impaired optical conditions by an increased refractive index of the formulation. Furthermore, the most accurate differentiation of protein particles and silicone oil droplets could be achieved with this instrument. The MFI systems provided excellent size and count accuracy (evaluated with polystyrene standards) especially the MFI5200 system. This instrument also showed very good performance for protein particles, also in case of an increased refractive index of the formulation. Both MFI systems were easier to use and appeared more standardized regarding measurement and data analysis as compared to the FlowCAM systems. Our study shows that the selection of the appropriate flow imaging microscopy system depends strongly on the main output parameters of interest and it is recommended to decide based on the intended application.
Electronic supplementary material
The online version of this article (doi:10.1208/s12248-013-9522-2) contains supplementary material, which is available to authorized users.
KEY WORDS: flow imaging, particle analysis, protein particles, silicone oil droplets, subvisible particles
INTRODUCTION
Protein aggregates and particles are important quality attributes of therapeutic protein formulations (1–3). Especially micron-sized aggregates (subvisible protein particles) (4) are considered as critical due to their potential risk of enhancing an immunogenic response (5). Quantification of (not necessarily proteinaceous) subvisible particles larger than 10 and 25 μm in parenterals is required by the pharmacopeias, and is commonly performed using light obscuration (LO) techniques (6,7). For therapeutic protein products, regulatory agencies increasingly ask for quantification and characterization of particles with a size below 10 μm by an orthogonal approach (8,9). Furthermore, the availability of an increasing number of emerging techniques (10,11) extends the spectrum of particle analysis tools and enables a more detailed characterization of the particles counted. These factors inspired the development of a new educational chapter USP<1787> entitled “Measurement of Subvisible Particulate Matter in Therapeutic Protein Injections” (12). It is currently being discussed whether this chapter should include particle analysis starting already from 2 μm as well as the use of additional techniques such as flow imaging microscopy. Flow imaging microscopy has already been used extensively in research and development (13–19) and more recently also for quality control/routine testing (own experiences). However, it needs to be considered that the calculation of particle size depends on the underlying measurement principle and may differ between LO and flow imaging microscopy. Moreover, comparison of results is influenced by the type of diameter selected for data evaluation and the algorithm that the instrument is using.
Flow imaging microscopy uses a charge-coupled device camera with high magnification to capture images of the sample solution passing through a thin flow cell. The flow cell is illuminated and particles with a different refractive index (RI) than the solution decrease the light intensity compared to the background and can be detected on the captured images (20,21). Particle size and count information is then generated based on image analysis. Besides quantification, the digital particle images allow for subsequent morphological characterization including size, shape, and optical parameters. This, however, requires sufficiently high image quality to draw reliable conclusions (21). A prominent application example is the differentiation of silicone oil droplets and protein particles in prefilled syringes and cartridges. For this approach, flow imaging microscopy has been successfully applied in several studies (22–24). In general, flow imaging microscopy tends to be more sensitive than LO for small transparent protein particles and therefore usually detects higher particle numbers (13,15,25). An increased RI of the formulation, leading to a decreased RI difference between particles and formulation, can impede a correct detection of protein particles by light-based techniques. Compared to LO, Micro-Flow Imaging (MFI) was shown to be slightly more robust against such a decreased RI difference (13,26).
There are several flow imaging microscopy instruments available on the market provided by different suppliers. Those are, for example, Sysmex Flow Particle Image Analyzer (FPIA) 3000 by Malvern Instruments (Worcestershire, UK), various Occhio Flowcell systems by Occhio (Angleur, Belgium), the MicroFlow Particle Sizing System by JM Canty (Buffalo, NY, USA), several MFI systems by ProteinSimple (Santa Clara, CA, USA), and various Flow Cytometer and Microscope (FlowCAM) systems by Fluid Imaging (Yarmouth, ME, USA). In this study, MFI and FlowCAM systems with different settings were evaluated (Table I). Both systems are often used for the analysis of subvisible particles in research and development and partly also for routine testing in a quality-controlled (QC) environment. A short general article about the handling of MFI and FlowCAM is available (27) but no comprehensive report about a direct comparison of the four systems has been published until now.
Table I.
Overview of Technical Parameters and Settings of the Systems Evaluated in this Study
| Parameter | Effect on | MFI4100 | MFI5200 | FlowCAM VS1 | FlowCAM PV |
|---|---|---|---|---|---|
| Magnification (combination of camera and lens magnification) | Image resolution | 14× | 5× | 200× | 100× |
| Flow cell depth (depth of field) | Sample volume/flow rate | 100 μm | 100 μm | 50 μm | 80 μm |
| Measurement time | |||||
| Focus adjustment | Size accuracy | By screw driver (supported by software) | By screw driver (supported by software) | By turning knob (evaluated optically)a | By manufacturer (not adjustable by user) |
| Size range | – | 0.75–70 μm | 1–70 μm | 2–50 μmb | 2–80 μmb |
| Flow rate | Sampling efficiency, measurement duration | Fixed (0.1 mL/min) | Fixed (0.17 mL/min) | Adjustable (0.005–200 mL/min)c, (0.07 mL/min in this study) | Adjustable (0.005–20 mL/min)c, (0.04 mL/min in this study) |
| Image capture rate | Sampling efficiency, measurement duration | Fixed to maximize efficiency and to minimize image overlaps | Fixed to maximize efficiency and to minimize image overlaps | Adjustable (1–22 frames/s), (20 frames/s in this study) | Adjustable (1–22 frames/s), (21 frames/s in this study) |
| Sampling efficiency | Statistical relevance of the data | Fixed (5–8%) | Fixed (80–85%) | Adjustable (5–8% in this study) | Adjustable (80–85% in this study) |
| CFR21 part 11 compatibility | GMP suitability | No | Yes | No | Yes |
aSupport by software available in the newest generation of the FlowCAM VS1 according to the manufacturer
bOfficial size range as indicated by the manufacturer, lower size limit could be extended to 1 μm in this study
cDepending on the syringe size
Here, we present the first study thoroughly challenging four of the most relevant flow imaging microscopy systems for biopharmaceuticals on the market: MFI4100 and MFI5200 as well as FlowCAM VS1 and FlowCAM PV. By that, we want to provide a basis for the increasing use of such systems in QC and support industry and authorities in their efforts towards new standards in the field of subvisible particle characterization.
MATERIALS AND METHODS
Materials
Infliximab (Remicade®, lots no. 7GD9301402, 7FD8701601, 7RMKA81402, pooled) and rituximab (MabThera®, lot no. B6082) were provided by local hospitals. Polystyrene particle standards were purchased from Duke Scientific (through Thermo Scientific, Fremont, CA, USA) and diluted in water for analysis.
Sucrose, sodium hydroxide, disodium hydrogenphosphate dihydrate, and sodium dihydrogenphosphate dihydrate were purchased from Merck KGaA (Darmstadt, Germany). Sodium chloride, sodium citrate dihydrate, and polysorbate 80 were from VWR (Darmstadt, Germany). Silicone oil with a viscosity of 1,000 cSt (as listed in the Ph.Eur. monography for silicone oil as a lubricant (24)) was purchased from Sigma Aldrich (Steinheim, Germany). The water used in this study was highly purified water (Advantage A10 purification system, Millipore, Newark, NJ, USA).
Sucrose solutions were prepared by dilution (w/w) of a 70% (w/w) solution, filtered using a 0.2 μm cellulose acetate syringe filter (Minisart®, Sartorius Stedim Biotech, Aubagne, France) and air bubbles were removed by centrifugation for 5 min at 7,000×g (Centrifuge 5810R, Eppendorf, Hamburg, Germany) prior to use.
Preparation of Protein Samples
Rituximab solution at a concentration of 1 mg/mL was prepared by dilution of 10 mg/mL rituximab commercial product in 25 mM citrate buffer (pH 6.5) containing 154 mM NaCl and 0.07% polysorbate 80 (formulation buffer). The formulation was filtered using a 0.2 μm polyethersulfone syringe filter (Sartorius, Göttingen, Germany) and kept at 2–8°C for a maximum of 1 week. Heat-stressed rituximab was prepared by incubating 1.5 mL of the 1 mg/mL rituximab solution for 30 min at 71°C in a thermomixer (Eppendorf, Hamburg, Germany). Stressed rituximab at 1 mg/mL (protein particles stock suspension) was stored at 2–8°C until the measurement.
Infliximab solution at a concentration of 1 mg/mL was prepared by dilution of 10 mg/mL infliximab commercial product in 100 mM phosphate buffer (pH 7.2). The formulation was filtered through a 0.2 μm polyethersulfone syringe filter. Stir-stressed infliximab was prepared by incubating 8 mL of the 1 mg/mL infliximab solution in a 10R glass vial using an 18-mm Teflon®-coated stir bar at 250 rpm for 24 h at room temperature on a magnetic stirrer (MR Hei-Standard, Heidolph, Schwabach, Germany).
For analysis of protein samples, stressed protein solution was diluted in the appropriate buffer (filtered through a 0.22 μm cellulose acetate/nitrate membrane filter, MF-Millipore®, Millipore), sucrose solution, or water.
Preparation of Silicone Oil Emulsion
Silicone oil was added to filtered formulation buffer in a particle-free 15-mL conical tube to a final concentration of 2% (w/v) to generate an emulsion without additives. After vortexing briefly, silicone oil droplet formation was induced by sonication in a water bath (Sonorex, Brandelin, Berlin, Germany) for 10 min. Fresh silicone oil emulsion (silicone oil droplet stock emulsion) was prepared on the day of the measurement and kept at room temperature.
Preparation of Individual and Mixed Samples of Silicone Oil Droplets and Protein Particles
Silicone oil droplet stock emulsion and/or protein particles stock suspension was diluted in unstressed protein solution or filtered formulation buffer for the preparation of mixed and individual samples. Mixed samples were prepared in a number ratio of 10:90 based on particle counts >2 μm determined by MFI4100. Individual samples were prepared to contain the same number of silicone oil droplets and protein particles, respectively, as in the mixed samples and are referred to as the theoretical concentration. All samples were prepared to a final protein concentration of 0.5 mg/mL rituximab. The samples were gently mixed with a pipette, kept at room temperature, and measured on the day of preparation.
Refractive Index Determination
Refractive indices of sucrose solutions were determined using an Abbé refractometer (Carl Zeiss, Oberkochen, Germany). Measurements were performed in triplicate at a wavelength of 589 nm at room temperature and the mean value was calculated.
Light Obscuration
Polystyrene standards were analyzed by light obscuration using a PAMAS SVSS-C (Partikelmess- und Analysesysteme, Rutesheim, Germany) equipped with an HCB-LD-25/25 sensor in order to obtain a reference value for linearity evaluation with polystyrene standards of MFI4100, MFI5200, FlowCAM VS1, and FlowCAM PV. Samples were diluted to a concentration of ∼103 particles/mL as a reference point for the flow imaging microscopy instruments. Three measurements of a volume of 0.3 mL for each sample were performed with a pre-run volume of 0.5 mL at a fixed fill rate and an emptying rate and rinse rate of 10 mL/min; the mean particle concentration per milliliter was reported by the system. Samples were measured in triplicate and mean and standard deviation were calculated.
Micro-Flow Imaging
MFI4100
An MFI4100 system (ProteinSimple) equipped with a 100 μm flow cell, operated at high magnification (14×), and controlled by the MFI View software version 6.9 was used. The system was flushed with 5 mL purified water at maximum flow rate and flow cell cleanliness was checked visually between measurements. Water, the appropriate sucrose solution, filtered unstressed rituximab formulation (0.5 mg/mL), or the appropriate formulation buffer was used to perform “optimize illumination” prior to each measurement to ensure correct thresholding of the MFI system. Samples of 0.65 mL with a pre-run volume of 0.3 mL were analyzed at a flow rate of 0.1 mL/min and a fixed camera rate (not adjustable by the user) leading to a sampling efficiency of about 5–8%. Samples were measured in triplicate and mean and standard deviation were calculated.
MFI5200
An MFI5200 system (ProteinSimple) equipped with a 100 μm flow cell and controlled by the MFI View System Software (MVSS) version 2-R2.6.1.20.1915 was used. The system was flushed with 10 mL purified water at maximum flow rate and flow cell cleanliness was checked visually between measurements. “Optimize illumination” prior to each measurement was done comparably to MFI4100. Samples of 0.5 mL with a pre-run volume of 0.2 mL were analyzed at a flow rate of 0.17 mL/min and a fixed camera rate (not adjustable by the user) leading to a sampling efficiency of about 80–85%. Samples were measured in triplicate and mean and standard deviation were calculated.
Particle Data Analysis MFI
For both systems, MFI View Analysis Suite (MVAS) version 1.2 was used for data analysis. Particles stuck to the flow cell wall were only counted once and edge particles were excluded from analysis. Particle size was evaluated as the diameter of a circle with the same projected area as the particle (designated as equivalent circular diameter (ECD), in the MFI software). For the discrimination of silicone oil droplets and protein particles, a minimum of 20 particles (MFI4100) or 50 particles (MFI5200) above 5 μm clearly recognizable as silicone oil droplets was selected for the “find similar” operation in the MVAS software.
FlowCAM Analysis
FlowCAM VS1
A FlowCAM VS1 Benchtop B3 system (Fluid Imaging Technologies) was equipped with a 50 μm single-use cell, a 20× magnification lens and controlled by the VisualSpreadsheet software version 3.1.10. A new 50 μm multi-use flow cell was recently introduced but was not available at the time of the study. The system was flushed with 1 mL purified water at a flow rate of 0.5 mL/min and flow cell cleanliness was checked visually. Samples of 0.5 mL with a pre-run volume of 0.5 mL (primed manually into the flow cell) were analyzed with a flow rate of 0.07 mL/min and a camera rate of 20 frames/s leading to a sampling efficiency of about 5–8%. Only dark pixels were selected for particle size determination at the preset default threshold value of 20. Particle size was evaluated as the diameter of a circle with the same projected area as the particle (designated as area-based diameter (ABD) in the FlowCAM software). For the discrimination of silicone oil droplets and protein particles, a filter can be developed and the parameters can be saved in the software. However, to ensure comparability with the MFI systems and to represent the analysis of a single sample as good as possible, the selection of silicone oil droplets in this study was performed on a sample-by-sample basis. A minimum of 20 particles above 5 μm clearly recognizable as silicone oil droplets was selected for the “find similar as selected” function. Samples were measured in triplicate and mean and standard deviation were calculated.
FlowCAM PV
A FlowCAM PV-100 Benchtop system (Fluid Imaging Technologies) was equipped with a 80 μm multi-use cell, a 10× magnification lens, and controlled by the VisualSpreadsheet software version 3.4.2. The system was flushed with 5 × 1 mL purified water by the flushing function in the software and flow cell cleanliness was accepted if less than 10 particles were counted in 0.02 mL of water in the “autoimage mode (no save)”. Samples of 0.5 mL with a pre-run volume of 0.2 mL (primed manually into the flow cell) were analyzed with a flow rate of 0.04 mL/min and a camera rate of 21 frames/s leading to a sampling efficiency of about 80–85%. Dark and light pixels were selected for particle size determination at the preset default threshold value of 30. Particle size was evaluated as the diameter of a circle with the same projected area as the particle (designated as ABD in the FlowCAM software). For the discrimination of silicone oil droplets and protein particles through the “find similar” operation, a minimum of 100 particles above 5 μm clearly recognizable as silicone oil droplets was selected to generate a library. The complete particle population was filtered by the “find similar as library” function. The resulting particle population was sorted by filter score and particles with filter scores of 0–5 (with 0 describing images which the highest match to the images in the library) were defined as silicone oil droplets. This procedure was necessary as the software was not able to perform the same “find similar as selected function” as applied for the FlowCAM VS1 which was probably due to the clearly higher number of particles images by the FlowCAM PV. Samples were measured in triplicate and mean and standard deviation were calculated.
Performance Evaluation
Critical performance parameters (e.g., image quality, size accuracy, and several other factors as described below) were ranked relatively within the evaluated systems. The system with the strongest performance for one specific parameter was scored as “4” (++++), the system with the weakest performance in this parameter was scored as “1” (+). In detail, the performance was quantified as follows: The image quality parameters were evaluated by eye. Polystyrene sizing and counting performance was judged with respect to the specifications by the manufacturer (NIST-traceable), linearity was evaluated based on the deviation from the theoretical concentration expected from the dilution factor and the linearity of the obtained concentrations (assessed by the R2 value). For the robustness towards RI influences, the relative decrease in the measured protein particle concentration in formulations with a higher RI was used for the ranking. The differentiation of silicone oil droplets and protein particles was evaluated based on the match with the theoretical concentration within the system (based on individual samples) and the standard deviation, defined as precision. The rating of handling parameters was based on the personal judgment of the authors.
RESULTS AND DISCUSSION
Count and Size Performance with Polystyrene Standards
The four systems MFI4100, MFI5200, FlowCAM VS1, and FlowCAM PV were first evaluated regarding their size and count performance with monodisperse certified polystyrene standards. All systems determined the correct concentration of a 5 μm polystyrene count standard with 3,000 ± 300 particles/mL > 3 μm (Table II).
Table II.
Results of Polystyrene Standard Measurements with MFI4100, MFI5200, FlowCAM VS1, and FlowCAM PV
| Standard type | Specification | MFI4100 | MFI5200 | FlowCAM VS1 | FlowCAM PV |
|---|---|---|---|---|---|
| 5 μm count standard | 3,000 ± 300 part./mL (>3 μm)a | 2,906 ± 324 part./mLc | 3,203 ± 116 part./mLc | 2,779 ± 162 part./mLc | 2,974 ± 184 part./mLc |
| 2 μm size standard | 1.999 ± 0.020 μmb | 1.74 ± 0.28 μmd | 1.95 ± 0.35 μmd | 3.20 ± 1.39 μmd | 2.38 ± 0.90 μmd |
| 5 μm size standard | 4.993 ± 0.040 μmb | 5.10 ± 0.80 μmd | 5.12 ± 0.57 μmd | 5.94 ± 1.61 μmd | 4.66 ± 1.52 μmd |
| 10 μm size standard | 10.00 ± 0.08 μmb | 10.56 ± 1.22 μmd | 10.16 ± 1.16 μmd | 10.71 ± 2.41 μmd | 9.66 ± 1.43 μmd |
aBased on light obscuration
bBased on microscopy
cStandard deviation from three measurements
dFull peak width at half of the maximum height
Concentration linearity was evaluated with different dilutions of 5 μm polystyrene size standards over a wide range from about 4 × 10² to 8 × 10⁶ particles/mL. The obtained concentrations for particles >3 μm (as specified for the 5 μm count standard) were compared to the theoretical concentration as determined by LO in the low concentration range (4,056 particles/mL for the second highest dilution) and calculated for the higher concentrations (Fig. 1). All systems showed good overall linearity,but underestimated the particle number at high concentrations (Fig. 1a) probably due to coincidence of particles, meaning that two particles which are located very closely next to or behind each other are detected as one particle. For the highest concentration of theoretically 8 × 10⁶ particles/mL, a measurement was only possible with the MFI4100 and FlowCAM VS1. MFI5200 and FlowCAM PV were not able to handle such high particle concentrations as the measurements were automatically aborted at 1 × 10⁶ and 5 × 10⁵ captured particles, respectively. This is due to a software setting limiting the number of captured particles to 500,000 per analysis to ensure proper data handling. The limit can be increased, but this would slow down data processing by the software. For the sample with a theoretical concentration of 4 × 10⁶ particles/mL, MFI4100, MFI5200, and FlowCAM VS1 underestimated the particle concentration by less than 10%, whereas the FlowCAM PV system detected 25% less particles than actually expected. In the medium concentration range of theoretically 4 × 10³ to 1 × 10⁶ particles/mL, all systems showed good results (Fig. 1b,c). Whereas the FlowCAM systems slightly underestimated the concentration, the MFI4100 system overestimated the concentration in the case of theoretically 4 × 10⁵ particles/mL. The MFI5200 system constantly showed deviations from the theoretical concentration of less than 2%. For the lowest concentration of theoretically 406 particles/mL, MFI4100, MFI5200, and FlowCAM PV showed large deviations of 11–28% and only the FlowCAM VS1 system detected the theoretical concentration within 1% (Fig. 1c). All systems showed large relative standard deviations in the low concentration range below 4 × 10³ particles/mL (8% for MFI5200, 18% and more for the other systems).
Fig. 1.

Linearity of particle concentration measurements by MFI4100, MFI5200, FlowCAM VS1, and FlowCAM PV. 5 μm PS standards measured at various dilutions. The theoretical concentrations are based on the counts of the second highest dilution obtained by LO (result, 4,056 particles/mL). a Full concentration range, b zoom into medium concentrations, c zoom into low concentrations. Error bars standard deviations from triplicate measurements
Size accuracy was evaluated with monodisperse polystyrene size standards of 2, 5, and 10 μm. Overall, the MFI systems rendered images of poorer resolution, but better size accuracy as compared with the FlowCAM systems evaluated in this study (Table II and Fig. 2). The MFI4100 system underestimated the size of the 2 μm polystyrene standards due to resolution limitations for those small particles but showed satisfying size accuracy for 5 and 10 μm as well as a narrow distribution for all sizes (Fig. 2a). MFI5200 was the only system that determined all sizes accurately and with a high precision (Fig. 2b). The images of size standards obtained by the MFI systems appeared rather blurry, but comparable in size and optical appearance, leading to the observed good size accuracy and precision. In contrast, the images obtained by the FlowCAM systems showed high resolution and sharpness but also a large variability in size and optical appearance. Especially the FlowCAM VS1 system showed clear deviations from the correct size (Table II) and also a broad size distribution with apparently more than one population per analyzed size standard (Fig. 2c). This is particularly striking for the 10 μm polystyrene standard for which two apparent populations around 10 and 12 μm were detected. The 10 μm peak particles appear to be captured in focus, whereas the 12 μm peak particles appear out of focus as indicated by the concentrical rings. Although the FlowCAM software VisualSpreadsheet is theoretically able to exclude out-of-focus particles, this was not performed as it would compromise the accuracy of the particle concentration and does therefore not represent a suitable option for real protein sample analysis. The FlowCAM PV rendered images of slightly lower resolution, but in return better size homogeneity leading to better size accuracy and precision (Fig. 2d). For a mixed sample of 2, 5, and 10 μm polystyrene size standards, the described differences in image quality and homogeneity led to a better separation between the sizes in the MFI systems as compared with the FlowCAM systems (Fig. 2a–d, lower panels). The underlying reasons for the differing image quality and homogeneity are assumed to be (1) the magnification and (2) the depth of focus (Table I). Furthermore, the threshold value in the FlowCAM systems influences the size accuracy as there is always a trade-off between size accuracy and image fragmentation.
Fig. 2.

Size accuracy and precision of 2, 5, and 10 μm PS size standards measured separately (upper panels) and as a mix (lower panels) by a MFI4100, b MFI5200, c FlowCAM VS1, and d FlowCAM PV. Representative images are shown above the corresponding peak of the size distribution
Image Properties
As discussed above, differences in the image properties and especially in the image homogeneity lead to divergences in size determination. Furthermore, the image quality is a crucial parameter for morphological analysis and for a reliable discrimination of different particle types, e.g., proteinaceous vs. nonproteinaceous particles. Therefore, we compared images of polystyrene standards, artificially generated silicone oil droplets, and protein particles (heat-stressed rituximab; Fig. 3). In general, images provided by the FlowCAM systems appeared sharper and of higher resolution than images captured by the MFI systems. This is mainly due to the smaller focus area and higher magnification of the FlowCAM optics. Thus, many morphological details were already visible on particles as small as 5 μm in size, especially for the FlowCAM VS1 system. However, the small focus area caused particles of the same type to appear optically different, which could be well observed on images for polystyrene standards and silicone oil droplets. Dark particles with a bright halo as well as bright particles with a dark edge and several nuances in between were detected within one sample. For protein particles, images captured by the FlowCAM systems appeared more uniform regarding the optical contrast than for polystyrene standards and silicone oil droplets. The MFI4100 system provided comparable images of protein particles. In contrast, the images captured by the MFI5200 system appeared more variable, presumably due to its larger view window which results in different illumination of particles depending on their location within the view window. For protein particles, this can lead to a high diversity in the optical appearance due to diffraction patterns within those heterogeneous particles (21). However, it is difficult to judge which instrument displays the real heterogeneity of protein particles as this is not known. The difference in sharpness and resolution between MFI systems and FlowCAM systems was particularly obvious for protein particles with sizes of about 5 and 10 μm. Here, FlowCAM images provide more morphological details, whereas MFI images appear rather blurry. Furthermore, the MFI systems capture only pixels of the particle which are darker than the background. In contrast, the FlowCAM systems use a different background calibration procedure allowing the additional depiction of pixels brighter than the background which probably results from specific diffraction patterns (21). This contributes to the enhanced visibility of morphological details but also leads to the heterogeneity in FlowCAM images. Within the brands, the MFI4100 and FlowCAM VS1 captured better images than the MFI5200 and FlowCAM PV.
Fig. 3.

Representative images of polystyrene standards, silicone oil droplets, and protein particles (heat-stressed rituximab) of different particle sizes scaled to the same image size
An additional cause of image variability in the FlowCAM systems for polystyrene standards and silicone oil droplets might be the illumination of the flow cell. While the background of an MFI flow cell appears uniformly gray (Electronic Supplementary Material (ESM) Fig. S1a,b), the background of a FlowCAM flow cell seems to be less evenly illuminated, especially for the FlowCAM VS1 system (ESM Fig. S1c,d). This can affect the overall brightness of an image depending on where within the flow cell it was captured. According to the manufacturer, this feature is currently under development for the FlowCAM systems.
Quantification of Protein Particles
Because the captured particle images form the basis for particle analysis, a potential correlation between image quality and detected particle numbers was investigated. To this end, protein particles were generated by heating a rituximab formulation and analyzed by the four systems. Due to the time-shifted availability of the FlowCAM systems, the exact same sample could not be analyzed in parallel by all four systems. Instead, one sample was analyzed in parallel by the MFI4100 and FlowCAM VS1 (Fig. 4a). Another sample, prepared later under the same conditions, was analyzed in parallel by the MFI5200 and FlowCAM PV as well as by MFI4100 for comparison (Fig. 4b). Thus, the difference in the cumulative size distribution between Fig. 4a,b can be attributed to the variability in the sample preparation. System-dependent differences can only be evaluated within Fig. 4a or within Fig. 4b. Although the image resolution for particles below 2 μm was poor and the official lower size limit of the FlowCAM systems is 2 μm, counting of particles could be performed for particles >1 μm with satisfying data quality for all systems. This has been shown before for the MFI4100 system (26). For the same sample, the FlowCAM VS1 system detected more particles below 3 μm but fewer particles above 3 μm, particularly above 10 μm, as compared with the MFI4100 system.
Fig. 4.

Cumulative particle counts for protein particles of heat-stressed rituximab analyzed by a MFI4100 and FlowCAM VS1 and b MFI4100, MFI5200, and FlowCAM PV. Error bars standard deviations from triplicate measurements
A possible reason for this might be image fragmentation which was observed for the FlowCAM VS1 when using the setting “only dark particles” (Fig. 5). It seems that bright parts of particles were detected as the particle boundary by the software. This effect was observed for particles larger than 10 μm. Although image fragmentation might also have occurred for smaller particles it could not be confirmed by optical evaluation of the images due to resolution limitations. Changing the settings to “dark and light” might have decreased this effect but, as discussed earlier, failed to provide the correct size for polystyrene size standards and was therefore not chosen. This shows again that the user has to accept a certain trade-off between good size accuracy and robustness against image fragmentation for the FlowCAM systems. On the one hand, this brings along certain user dependency and data variability and there is no optimal setting for all purposes. On the other hand, those many adjustable settings in the FlowCAM systems enable the handling of a specific problem. In contrast, the MFI systems require the trust of the user in the predefined settings which cannot be changed. For the other systems evaluated in this study, image fragmentation was not observed for the same samples. However, for an IgG-containing sample from a different study, image fragmentation was observed for the MFI4100 system (data not shown due to confidentiality).
Fig. 5.
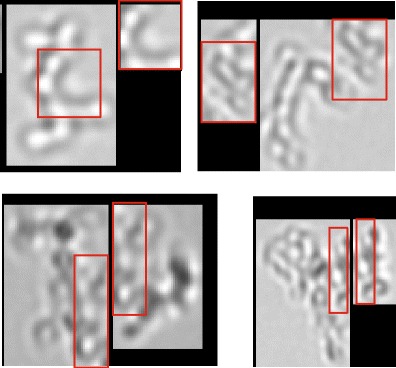
Images of protein particles around 10 μm (heat-stressed rituximab) captured by the FlowCAM VS1 system. Red boxes overlapping or doubly imaged regions in two separate images due to image fragmentation
For the second sample analyzed, MFI5200 and FlowCAM PV detected similar size distributions with slightly less particles detected by the FlowCAM PV system (Fig. 4b). Clearly more small particles larger than 1 μm were detected by the MFI5200 system, pointing on the one hand towards a better sensitivity for small transparent particles, on the other hand potentially also towards undetected image fragmentation. For the FlowCAM PV system, it needs to be considered that the official size range of this system starts only at 2 μm and was extended consciously in this study. For total particle concentrations larger than 2 μm, similar concentrations were detected by all three systems. The difference for particles larger than 10 μm is probably due to the low total number in this size range causing higher standard deviations. In general, the MFI5200 and FlowCAM PV showed lower standard deviations for total particle counts larger than 1 μm as compared with the MFI4100 and FlowCAM VS1, as could be expected from the differences in the analyzed volume.
It was shown earlier that light-based quantification of protein particles is influenced by the RI of both, particles and surrounding formulation and that this effect is partly system dependent (26). Therefore, the robustness of MFI4100, MFI5200, and FlowCAM PV towards RI influences was determined by quantifying protein particles larger than 1 μm (stir-stressed infliximab) in the same concentration in formulations of increasing RI, adjusted by addition of sucrose (Fig. 6). The FlowCAM VS1 system was not available at the time of these experiments. Particle concentrations obtained by MFI4100 were rather sensitive to an increase in RI of the formulation. In 20% sucrose (RI, 1.36), 80% of the original particle concentration was still detected whereas in 50% sucrose (RI, 1.42), only 25% could be detected. MFI5200 and FlowCAM PV were both more robust towards RI influences; in 20% sucrose, 93% and 89% of the original particle concentration, respectively, were still detected and in 50% sucrose, the apparent concentration decreased only to 54% and 69% with MFI5200 and FlowCAM PV, respectively. The reason for the superior performance of MFI5200 and FlowCAM PV is potentially connected to optimized optical settings of these newer systems. Two different control experiments in a previous study have shown that the particle concentration was not affected directly by the high sucrose concentration, e.g., by dissolution or generation of particles (26). Instead, the decreased RI difference between particles and surrounding formulation reduced the apparent particle concentration. The RI of a 20% sucrose solution (1.36) represents pharmaceutically relevant conditions, e.g., at high protein concentration or a combination of excipients such as sucrose and high protein concentration (26).
Fig. 6.

Total particle counts for protein particles of stir-stressed infliximab for fixed particle concentrations in sucrose solutions of varying concentration and thus RI. Error bars standard deviations from triplicate measurements
Differentiation of Silicone Oil Droplets and Protein Particles
A major advantage of flow imaging microscopy as compared with other analytical techniques for subvisible particles, e.g., LO or electrical sensing zone analysis, is the possibility to characterize particles based on images (10). Parameters such as shape and transparency can be used to differentiate between different particle types by mathematical filters (22,23). In this context, the discrimination of silicone oil droplets and protein particles is especially relevant due to the increasing application of prefilled syringes. Similar to a previous study protein particles (heat-stressed rituximab) and silicone oil droplets were generated to represent particles and droplets in marketed products (22). The samples were analyzed by MFI4100, MFI5200, FlowCAM VS1, and FlowCAM PV as individual samples (to obtain the theoretical concentration within the same system) and in controlled mixtures. The “find similar” algorithm in the respective software was used to differentiate between silicone oil droplets and protein particles. Due to the time-shifted availability of the FlowCAM systems, the exact same sample could not be analyzed in parallel by all four systems. Instead, one group of samples was analyzed in parallel by the MFI4100 and FlowCAM VS1 (Fig. 7a,c). Another group of samples which was prepared later under the same conditions was analyzed in parallel by the MFI5200 and FlowCAM PV (Fig. 7b,d). The concentration was adjusted in such a way that similar total particle counts larger than 1 μm were obtained for both groups of samples with the MFI4100 as the bridging instrument. However, the relative size distribution for protein particles differed clearly between the two sample groups. Thus, the differentiation performance was evaluated within the systems but not between the systems. The evaluation was based on the match of the detected concentration (in mixed samples) and the theoretical concentration (in individual samples) within each system. The theoretical concentration may differ from system to system and is only valid for the mixed samples analyzed by the same system. Although an optical discrimination of silicone oil droplets and protein particles based on the particle images, which is the basis for the “find similar” operation, was only reasonable for particles of 5 μm and larger, the “find similar” function of the software was able to differentiate particles down to 2 μm.
Fig. 7.

Cumulative particle counts comparing theoretical concentrations (based on individual samples measured with the corresponding instrument) and determined concentrations (mixed samples) of artificially generated silicone oil droplets and protein particles (heat-stressed rituximab) in a droplet/particle ratio of 10:90 (based on particle counts >2 μm with MFI4100). a MFI4100, b MFI5200, c FlowCAM VS1, d FlowCAM PV. Error bars standard deviations from triplicate measurements
The FlowCAM PV system showed the best match with the theoretical concentration, thus the best differentiation of silicone oil droplets and protein particles (Fig. 7d). The MFI5200 and FlowCAM PV (Fig. 7b,d) showed a higher precision than the MFI4100 and FlowCAM VS1 (Fig. 7a,c). Overall, the FlowCAM systems (Fig. 7c,d) showed better differentiation accuracy than the MFI systems (Fig. 7a,b) probably due to the higher image quality. However, the differences were rather small and results might depend on the specific sample properties. In conclusion, all systems proved to be suitable for the differentiation of silicone oil droplets and protein particles from 2 to 10 μm. For particles below 2 μm, alternative techniques such as resonant mass measurement can be beneficial (22). For particles larger than 10 μm, it is recommended independently of the system to differentiate particles by optical evaluation of the images rather than by applying the “find similar” function. This approach is feasible due to the clear images and usually low particle counts in this size range.
Handling of the Systems
Concerning the hardware, MFI systems only allow the adjustment of the sample volume. This ensures standardized, user-independent measurements and repeatable results, but requires full trust in the settings predefined by the manufacturer, which cannot be customized to specific needs or samples. In contrast, the FlowCAM systems allow changes in optical settings (e.g., threshold, shutter, and gain) or technical settings (flow rate and image capture rate) offering customization of the analysis to specific needs for experienced users, but impede comparability between samples analyzed by different operators, at different times, or even by different instruments of the same type.
The exchange of a flow cell, which requires the adjustment of the focus as a critical parameter for image-based particle analysis, is straightforward and unambiguous for the MFI systems. For the FlowCAM systems, especially the FlowCAM VS1, this process was found to be cumbersome but this is currently being improved by the manufacturer. Furthermore, the MFI systems use a peristaltic pump enabling high flow rates and large volumes which is useful for an efficient cleaning step, but the flow rate needs to be calibrated regularly. The FlowCAM systems for small volumes (as applicable for protein samples) are typically equipped with a syringe pump, which does not require calibration by the user, but is restricted in volume and speed limited by the flow cell diameter. Thus, cleaning cycles with FlowCAM need to be performed several times with low volume and flow rate, especially in case of small syringe sizes.
Concerning the software, the MFI systems use different software types for the measurement (MFI View software for MFI4100, MVSS for MFI5200) and the data analysis (MVAS), whereas the FlowCAM systems apply the same software for both steps (VisualSpreadsheet). While the latter allows the analysis of the particle population, regarding size distribution and cropped images, already during the measurement as a real-time analysis, this data becomes available only after the measurement for the MFI systems. However, the MVAS software includes an essential function to “remove stuck particles” (particles stuck to the flow cell wall which would otherwise be counted on every image they were captured on). This option is not yet available for VisualSpreadsheet but is currently under development. In both software solutions, particle data can be exported in many different ways and the raw data of every single particle (e.g., shape or transparency values) is available. MVAS enables export of single-particle images, whereas VisualSpreadsheet offers collages of particle images. Regarding the differentiation of silicone oil droplets and protein particles, the analysis of a single sample is simpler in MVAS, while VisualSpreadsheet enables the generation of libraries from selected particles, which can be used to build a filter for future samples. In addition, VisualSpreadsheet offers the possibility to sort the resulting population of similar particles by “filter score”, i.e., by similarity to the selected particles. Taken together, MFI systems are more standardized, whereas FlowCAM systems are designed for more flexibility for the user, concerning both hardware and software.
CONCLUSION
Our study showed that the selection of the appropriate flow imaging microscopy system depends strongly on the main output parameters of interest and the intended application. Each system shows its strengths and weaknesses in different aspects (Table III). We categorized the four systems evaluated in this study based on the technical data and the results obtained in this study into high-resolution systems (MFI4100 and FlowCAM VS1, because of higher image quality, but lower sampling efficiency) and high-efficiency systems (MFI5200 and FlowCAM PV, because of slightly lower image quality, but higher sampling efficiency as compared to the corresponding system from the same manufacturer). The best images were obtained by the FlowCAM VS1 system, which was seen as the best system among the high-resolution instruments. The best performance regarding particle counting accuracy and precision was achieved by the MFI5200 system, which appeared to be the preferred system among the high-efficiency instruments. The MFI4100 and the FlowCAM PV system were observed as all-round systems which might be a good compromise between the other two systems that are more biased towards particle counting (MFI5200) or particle imaging (FlowCAM VS1).
Table III.
Summarizing Assessment of Important Analysis Factors for MFI4100, MFI5200, FlowCAM VS1, and FlowCAM PV
| Parameter | MFI4100 | MFI5200 | FlowCAM VS1 | FlowCAM PV | |
|---|---|---|---|---|---|
| Image properties | Resolution | ++ | + | ++++ | +++ |
| Contrast within the particle | + | ++ | ++++ | +++ | |
| Image consistency (standards) | ++++ | ++++ | + | + | |
| Polystyrene size | Accuracy | +++ | ++++ | + | ++ |
| Precision | +++ | ++++ | + | ++ | |
| Polystyrene count | Accuracy | +++ | ++ | + | ++++ |
| Precision | + | ++++ | +++ | ++ | |
| Linearity | ++ | ++++ | ++++ | + | |
| Protein particle quantification | Precision | + | +++ | + | ++++ |
| Robustness against RI influences | ++ | +++ | n.a. | ++++ | |
| Differentiation of silicone oil droplets and protein particles | Match with the theoretical concentration | + | ++ | +++ | ++++ |
| Precision | + | +++ | ++ | ++++ | |
| Handling | Hardware | +++ | ++++ | + | ++ |
| Software for measurement | ++++ | +++ | + | ++ | |
| Software for data analysis | ++++ | ++++ | +++ | +++ | |
++++, strongest performance; +++ second strongest performance; ++ third strongest performance; + weakest performance; all criteria were judged only relatively among the evaluated systems
Electronic Supplementary Material
DOCX 68 kb
ACKNOWLEDGMENTS
We thank Axel Wilde from Anasysta (distributor of Fluid Imaging in Germany) and Josh Geib from Fluid Imaging for providing access to the FlowCAM systems and Dave Palmlund from Fluid Imaging for helpful comments to the manuscript.
Footnotes
Sarah Zölls and Daniel Weinbuch equally contributed to this paper.
REFERENCES
- 1.Carpenter JF, Randolph TW, Jiskoot W, Crommelin DJA, Middaugh CR, Winter G, et al. Overlooking subvisible particles in therapeutic protein products: gaps that may compromise product quality. J Pharm Sci. 2009;98:1201–5. doi: 10.1002/jps.21530. [DOI] [PMC free article] [PubMed] [Google Scholar]
- 2.Carpenter J, Cherney B, Lubinecki A, Ma S, Marszal E, Mire-Sluis A, et al. Meeting report on protein particles and immunogenicity of therapeutic proteins: filling in the gaps in risk evaluation and mitigation. Biologicals. 2010;38:602–11. doi: 10.1016/j.biologicals.2010.07.002. [DOI] [PubMed] [Google Scholar]
- 3.Hawe A, Wiggenhorn M, van de Weert M, Garbe JHO, Mahler H-C, Jiskoot W. Forced degradation of therapeutic proteins. J Pharm Sci. 2012;101:895–913. doi: 10.1002/jps.22812. [DOI] [PubMed] [Google Scholar]
- 4.Narhi LO, Schmit J, Bechtold-Peters K, Sharma D. Classification of protein aggregates. J Pharm Sci. 2012;101:493–8. doi: 10.1002/jps.22790. [DOI] [PubMed] [Google Scholar]
- 5.Rosenberg AS. Effects of protein aggregates: an immunologic perspective. AAPS J. 2006;8:E501–7. doi: 10.1208/aapsj080359. [DOI] [PMC free article] [PubMed] [Google Scholar]
- 6.Ph.Eur. 2.9.19, Pharmacopoea Europaea, 7th ed. 2010. Particulate contamination: sub-visible particles. European Directorate for the Quality of Medicine (EDQM).
- 7.USP<788>, United States Pharmacopeia, USP35-NF30, 2012. Particulate matter in injections. United States Pharmacopeial convention.
- 8.Kirshner S. Regulatory expectations for analysis of aggregates and particles. Talk at Workshop on Protein Aggregation and Immunogenicity, Breckenridge, Colorado. 12 July 2012.
- 9.Food US, Administration D. Guidance for industry. Immunogenicity assessment for therapeutic protein products (draft guidance) Silver Spring, MD, USA: FDA; 2013. [Google Scholar]
- 10.Zölls S, Tantipolphan R, Wiggenhorn M, Winter G, Jiskoot W, Friess W, et al. Particles in therapeutic protein formulations, part 1: overview of analytical methods. J Pharm Sci. 2012;101:914–35. doi: 10.1002/jps.23001. [DOI] [PubMed] [Google Scholar]
- 11.Burg TP, Godin M, Knudsen SM, Shen W, Carlson G, Foster JS, et al. Weighing of biomolecules, single cells and single nanoparticles in fluid. Nature. 2007;446:1066–9. doi: 10.1038/nature05741. [DOI] [PubMed] [Google Scholar]
- 12.Narhi LO. AAPS update on USP expert committee for sub-visible particle analysis. Newsletter of the AAPS Aggregation and Biological Relevance Focus Group. 2012;3(2).
- 13.Demeule B, Messick S, Shire SJ, Liu J. Characterization of particles in protein solutions: reaching the limits of current technologies. AAPS J. 2010;12:708–15. doi: 10.1208/s12248-010-9233-x. [DOI] [PMC free article] [PubMed] [Google Scholar]
- 14.Sharma DK, Oma P, Pollo MJ, Sukumar M. Quantification and characterization of subvisible proteinaceous particles in opalescent mAb formulations using micro-flow imaging. J Pharm Sci. 2010;99:2628–42. doi: 10.1002/jps.22046. [DOI] [PubMed] [Google Scholar]
- 15.Wuchner K, Büchler J, Spycher R, Dalmonte P, Volkin DB. Development of a microflow digital imaging assay to characterize protein particulates during storage of a high concentration IgG1 monoclonal antibody formulation. J Pharm Sci. 2010;99:3343–61. doi: 10.1002/jps.22123. [DOI] [PubMed] [Google Scholar]
- 16.Joubert MK, Luo Q, Nashed-Samuel Y, Wypych J, Narhi LO. Classification and characterization of therapeutic antibody aggregates. JBC. 2011;286:25118–33. doi: 10.1074/jbc.M110.160457. [DOI] [PMC free article] [PubMed] [Google Scholar]
- 17.Barnard JG, Babcock K, Carpenter JF. Characterization and quantitation of aggregates and particles in interferon-β products: potential links between product quality attributes and immunogenicity. J Pharm Sci. 2012;102:915–28. doi: 10.1002/jps.23415. [DOI] [PubMed] [Google Scholar]
- 18.Barnard JG, Singh S, Randolph TW, Carpenter JF. Subvisible particle counting provides a sensitive method of detecting and quantifying aggregation of monoclonal antibody caused by freeze-thawing: insights into the roles of particles in the protein aggregation pathway. J Pharm Sci. 2011;100:492–503. doi: 10.1002/jps.22305. [DOI] [PubMed] [Google Scholar]
- 19.Patel AR, Lau D, Liu J. Quantification and characterization of micrometer and submicrometer subvisible particles in protein therapeutics by use of a suspended microchannel resonator. Anal Chem. 2012;84(15):6833–40. doi: 10.1021/ac300976g. [DOI] [PubMed] [Google Scholar]
- 20.Sharma DK, King D, Oma P, Merchant C. Micro-flow imaging: flow microscopy applied to sub-visible particulate analysis in protein formulations. AAPS J. 2010;12:455–64. doi: 10.1208/s12248-010-9205-1. [DOI] [PMC free article] [PubMed] [Google Scholar]
- 21.Brown L. Characterizing biologics using dynamic imaging particle analysis. BioPharm Int. 2011;24(8):s4–s9. [Google Scholar]
- 22.Weinbuch D, Zölls S, Wiggenhorn M, Friess W, Winter G, Jiskoot W, et al. Micro-flow imaging and resonant mass measurement (Archimedes)—complimentary methods to quantitatively differentiate protein particles and silicone oil droplets. J Pharm Sci. 2013;102:2152–65. doi: 10.1002/jps.23552. [DOI] [PubMed] [Google Scholar]
- 23.Strehl R, Rombach-Riegraf V, Diez M, Egodage K, Bluemel M, Jeschke M, et al. Discrimination between silicone oil droplets and protein aggregates in biopharmaceuticals: a novel multiparametric image filter for sub-visible particles in microflow imaging analysis. Pharm Res. 2012;29(2):594–602. doi: 10.1007/s11095-011-0590-7. [DOI] [PubMed] [Google Scholar]
- 24.Sharma BDK, Oma P, Krishnan S. Silicone microdroplets in protein formulations—detection and enumeration. Pharm Technol. 2009;33:74–9. [Google Scholar]
- 25.Huang C-T, Sharma D, Oma P, Krishnamurthy R. Quantitation of protein particles in parenteral solutions using micro-flow imaging. J Pharm Sci. 2009;98:3058–71. doi: 10.1002/jps.21575. [DOI] [PubMed] [Google Scholar]
- 26.Zölls S, Gregoritza M, Tantipolphan R, Wiggenhorn M, Winter G, Friess W, et al. How subvisible particles become invisible—relevance of the refractive index for protein particle analysis. J Pharm Sci. 2013;102:1434–46. doi: 10.1002/jps.23479. [DOI] [PubMed] [Google Scholar]
- 27.Wilson GA, Manning MC. Flow imaging: moving toward best practices for subvisible particle quantitation in protein products. J Pharm Sci. 2013;102:1133–4. doi: 10.1002/jps.23445. [DOI] [PubMed] [Google Scholar]
Associated Data
This section collects any data citations, data availability statements, or supplementary materials included in this article.
Supplementary Materials
DOCX 68 kb