

Abstract
The nuclear lamina is implicated in the organization of the eukaryotic nucleus. Association of nuclear lamins with the genome occurs through large chromatin domains including mostly, but not exclusively, repressed genes. How lamin interactions with regulatory elements modulate gene expression in different cellular contexts is unknown. We show here that in human adipose tissue stem cells, lamin A/C interacts with distinct spatially restricted subpromoter regions, both within and outside peripheral and intra-nuclear lamin-rich domains. These localized interactions are associated with distinct transcriptional outcomes in a manner dependent on local chromatin modifications. Down-regulation of lamin A/C leads to dissociation of lamin A/C from promoters and remodels repressive and permissive histone modifications by enhancing transcriptional permissiveness, but is not sufficient to elicit gene activation. Adipogenic differentiation resets a large number of lamin-genome associations globally and at subpromoter levels and redefines associated transcription outputs. We propose that lamin A/C acts as a modulator of local gene expression outcome through interaction with adjustable sites on promoters, and that these position-dependent transcriptional readouts may be reset upon differentiation.
The nuclear lamina plays a role in the organization of the nucleus. It consists of intermediate filament proteins called lamins and of several associated proteins, which lie between the inner nuclear membrane and chromatin (Burke and Stewart 2013; Schreiber and Kennedy 2013). Lamins are subdivided into A-type lamins (lamins A and C; referred to as LMNA here) encoded as splice variants by the LMNA gene, and B-type lamins, products of the LMNB1 and LMNB2 genes. In contrast to B-type lamins, which are ubiquitously expressed, A-type lamins are developmentally regulated, absent from early embryos and expressed in lineage-committed and differentiated cells (Stewart and Burke 1987; Worman et al. 1988). A-type lamins exist not only at the lamina but also as a nucleoplasmic pool which can be solubilized with a nonionic detergent (Kolb et al. 2011). Over 300 mutations in the LMNA gene have been linked to ∼15 diseases commonly referred to as laminopathies (Schreiber and Kennedy 2013). Laminopathies can affect all developmental lineages, although the mesoderm, including adipose tissue, is most commonly targeted. Mechanisms linking lamin mutations to the pathologies are likely to involve heterochromatin and signal transduction defects (Mattout et al. 2011; Schreiber and Kennedy 2013). The emerging roles of the nuclear envelope on the organization of chromosomes (Zuleger et al. 2011, 2013) and the role of LMNA and post-translational histone modifications on genome conformation (McCord et al. 2012) suggest an interplay between A-type lamins, chromatin, and gene expression outcomes.
The lamina associates with chromatin presumably through interaction of lamins with histones and DNA (Kind and van Steensel 2010). Lamin-genome interactions have been proposed to occur through “lamin association domains” (LADs) (Pickersgill et al. 2006; Guelen et al. 2008; Meuleman et al. 2012; Kind et al. 2013). LADs span 0.1–10 megabases (Mb) and may contain thousands of genes that are mostly inactive or expressed at a low level (Guelen et al. 2008). Lamins can also interact with shorter chromatin domains in HeLa cells (Euskirchen et al. 2011), and in mice and yeast, short DNA sequences can mediate localization of loci to the nuclear periphery (Ahmed et al. 2010; Brickner et al. 2012; Zullo et al. 2012). These studies suggest that LADs may contain many discrete lamin interaction domains.
LADs generally reside in a repressive chromatin environment (Kind and van Steensel 2010), and repositioning of genes at the nuclear periphery is often associated with transcriptional inactivation (Reddy et al. 2008; Towbin et al. 2012; Zullo et al. 2012). Accordingly, SET-domain proteins conferring histone H3 lysine 9 (H3K9) di- or trimethylation (H3K9me2/me3) have emerged as regulators of anchoring of loci to the nuclear periphery (Towbin et al. 2012; Kind et al. 2013). The relationship between lamina association and gene expression is, however, complex. Genes located within LADs can be transcribed (Guelen et al. 2008), so transcription is compatible with intra-LAD localization. Further, changes in expression of genes gaining or losing lamin interaction after differentiation of Drosophila Kc cells are, overall, marginal (Pickersgill et al. 2006). Similarly, not all genes released from or tethered to the nuclear lamina upon embryonic stem cell differentiation alter their expression (Peric-Hupkes et al. 2010), and loss of lamin interaction after lamin down-regulation is not always linked to transcriptional activation (Kubben et al. 2012). Onset of gene repression may also be discordant with targeting to the nuclear lamina, for example, during neurogenesis (Kohwi et al. 2013). Although these studies provide clues on how loci may be addressed to the nuclear periphery, how loci remain active at the nuclear periphery while others are repressed remains undetermined.
We examine here the impact of LMNA association with promoter regions on the expression outcome of all genes, that is, genes not necessarily localized in peripheral LADs. We show in human adipose stem cells (ASCs) interaction of LMNA with thousands of promoters, on spatially restricted domains, and in a manner that specifies chromatin-dependent local transcription outcomes. LMNA influences chromatin modifications at sites it interacts with and beyond. Adipogenic differentiation remodels LMNA-promoter interactions and resets associated gene expression. Our results suggest a model of a variable modulatory function of promoter-associated LMNA on local chromatin environments and transcription outcomes.
Results
Promoters associate with LMNA in primary adipose stem cells
We mapped in human ASCs the occupancy of A-type lamins (LMNA) on promoters using chromatin immunoprecipitation (ChIP) and array hybridization. Lamins A and C are localized at the nuclear periphery and in the nuclear interior in ASCs (Fig. 1A) and cofractionate with chromatin prepared by formaldehyde cross-linking and sonication in a low-salt/EDTA/Triton X-100-based buffer (Fig. 1B; Supplemental Fig. 1A). Lamins A and C were immunoprecipitated (Fig. 1B) and promoter occupancy queried by hybridization of ChIP DNA to microarrays tiling 4 kb around the TSS of 17,790 RefSeq genes (Pearson correlation of log2 IP/input ratios r = 0.975 between ChIP replicates) (Fig. 1C).
Figure 1.

LMNA interacts with promoters in adipose stem cells. (A) Immunofluorescence detection of lamin A/C in ASCs. (Inset) Phase contrast. Bar, 10 μm. (B) Western blot analysis of lamin A/C in ASCs, ASC chromatin (input), and antibody-unbound and -bound fractions after LMNA ChIP. (C) Browser view of LMNA occupancy on two regions of chromosome 1; (left) nucleotide 1,230,000–1,260,000 (TNFRSF18, TNFRSF4, SDF4, B3GALT6); (right) nucleotide 12,810,000–12,888,000 (PRAMEF11, HNRNPCL1, PRAMEF2, PRAMEF4, PRAMEF12) in ASCs before and after LMNA KD. (D) Number of genes with a LMNA-associated promoter in ASCs and in LMNA-KD ASCs. (E) GAGA and A/T-rich motifs enriched in promoter regions underlying LMNA peaks.
Using a “model-based analysis of two-color arrays” (MA2C) algorithm with P < 0.01 for LMNA peak calling, we identify 4827 genes with a promoter enriched in LMNA, which represents 27% of RefSeq genes (Fig. 1D; see Supplemental Table 1 for a list of LMNA-enriched genes). Knockdown of lamins A and C (LMNA KD) with an shRNA to the LMNA gene (Supplemental Fig. 1B) abolishes or markedly reduces LMNA occupancy (Fig. 1C,D), indicating specificity of the immunoprecipitation. Validation of ChIP-chip data by ChIP and quantitative (q)PCR for LMNA-enriched and depleted regions shows high concordance between data sets (Supplemental Fig. 1C,D). Gene ontology (GO) analysis of LMNA-associated genes identifies genes pertaining to development and differentiation, signaling, and immune response functions (Supplemental Table 2), suggesting that LMNA may be involved in the regulation of developmental functions.
Although nuclear lamins can bind DNA in vitro, LMNA-promoter interactions determined by ChIP provide no information on whether LMNA binds directly to promoter sequences or whether interactions are mediated by DNA-binding factors. Nonetheless, a search for DNA motifs enriched among LMNA-associated sequences identifies a recurrent GAGA motif underlying 21% of LMNA peaks (E-value = 1.17 × 10⁻¹⁵, Bonferoni-corrected P-value) (Fig. 1E), which is similar to the extended GAGA motif found in mouse lamin associating sequences (LASs) (Zullo et al. 2012). This extended mouse GAGA motif is bound by the transcription repressor CKROX, which mediates targeting of loci to the lamina (Zullo et al. 2012). The ZBTB7B gene encoding CKROX is expressed in human ASCs (Boquest et al. 2005), suggesting a similar mechanism of association of LMNA with GAGA motifs in mouse and human cells. We also find an A/T-rich motif underlying 62% of LMNA peaks (E-value = 1.15 × 10⁻²⁶) (Fig. 1E), in line with the A/T-richness of LADs (Meuleman et al. 2012). A/T-rich motifs match those of transcription factors such as ARID3A. ARID3A, also expressed in ASCs (Boquest et al. 2005), has been shown to tether loci to the nuclear envelope (Webb et al. 2011) and may confer lineage restriction in somatic stem cells (An et al. 2010), potentially linking LMNA-promoter interactions to developmental regulation.
Evidence for peripheral and intra-nuclear lamin-rich domains
We next analyzed the genomic distribution of LMNA-interacting promoters. First, we determined whether genes enriched in LMNA cluster or are uniformly distributed in the genome. To this end, we computed the number of LMNA-enriched genes in a 31-gene sliding window across the genome and attributed a gene to a “lamin-rich domain” (LRD) if at least 10 of the closest 30 genes were enriched in LMNA (Fig. 2A). This cut-off was significant in a Monte Carlo simulation with a null hypothesis of uniform distribution of LMNA (P < 10−6, two-sided t-test), indicating that LMNA-enriched genes are nonrandomly distributed. LRDs are identified on nearly all chromosomes (Fig. 2A), consistent with a localization of clustered LMNA-interacting genes that extends beyond the nuclear periphery.
Figure 2.

3D immuno-FISH unveils peripheral and intra-nuclear LMNA-associated loci. (A) LMNA enrichment in sliding 31-gene windows (x, x+31) across chromosomes. Scale shows the numbers of LMNA-enriched genes in the window. (B) Distribution of FISH signals from LMNA-enriched (DEFA3, SCN10A, DNAL4) and nonenriched (HOXB9) loci relative to peripheral LMNA (n ≥ 30 loci per gene). (C) 3D immuno-FISH (green; arrows) of loci shown in B relative to peripheral LMNA labeling (red). DNA is stained with DAPI. Scale bars, 5μm.
An overlap analysis of LRDs with LADs previously identified in human fibroblasts (Guelen et al. 2008) shows that 50% (n = 2113) of 4202 RefSeq genes found in LADs are enriched in LMNA in our study. Conversely, nearly 50% of LMNA-bound genes are localized in LADs. Thus, the localization within LADs (Guelen et al. 2008) of LMNA-associated genes identified by ChIP is highly significant (P = 2.2 × 10⁻¹⁶, Pearson's χ2 test). Our analysis provides, therefore, independent evidence for a clustering of LMNA-associated genes into wider lamin-enriched domains (Kind and van Steensel 2010).
Secondly, we examined the intra-nuclear localization of LMNA-enriched genes by 3D immunofluorescence and fluorescence in situ hybridization (immuno-FISH). We analyzed nine loci, seven of which are LMNA targets identified by ChIP and located within or outside LRDs (DEFA3, SCN10A, TCN1, ACTL7A, DNAL4, NANOG, ATP5EP2), and two are not (HOXB9, LDHB) (Supplemental Fig. 2A,B). Several configurations were identified among these loci: (1) Genes strongly enriched in LMNA and found in an LRD display localization both at the nuclear periphery (defined as ≤0.5 μm from peripheral lamin A/C immune-labeling) and in the nuclear interior (DEFA3, TCN1), or intra-nuclear localization only (ACTL7A) (Fig. 2B,C; Supplemental Fig. 2C,D). This suggests that LRDs exist not only at the nuclear periphery but also in the nuclear interior. (2) A gene enriched in LMNA and close to (<500 kb) an LRD (SCN10A) also shows more peripheral positioning (Fig. 2B,C); thus, localization in an LRD is not required for peri-nuclear localization. (3) Genes enriched in LMNA away from an LRD (>500 kb) only or predominantly display intra-nuclear localization (DNAL4, NANOG), or both peripheral and intra-nuclear localization (ATP5EP2) (Supplemental Fig. 2C,D). So, LMNA enrichment does not always entail peripheral localization. (4) A gene not bound by LMNA but localized in a “weak” LRD (LDHB) can also be peripheral and intra-nuclear (Supplemental Fig. 2C,D). Thus, absence of LMNA enrichment is compatible with localization at the nuclear periphery. (5) Lastly, a gene not enriched in LMNA and outside an LRD (HOXB9) is found only in the nuclear interior (Fig. 2B,C). We conclude that LMNA enrichment does not systematically imply peri-nuclear localization and that loci enriched in LMNA within or outside an LRD can be found at the nuclear periphery as well as in the nuclear interior. Moreover, our expression data indicate that these genes, except LDHB, are not expressed in ASCs; thus, for the LMNA-bound genes studied here (DEFA3, TCN1, DNAL4, NANOG, ATP5EP2), expression status is not necessarily related to peri-nuclear positioning.
LMNA association with spatially restricted promoter subregions is linked to distinct transcription outcomes
Given the wide genome distribution of LRDs, we next assessed the impact of LMNA enrichment on expression of genes associated with, or in proximity to, LMNA. We also mapped transcriptionally permissive (H3K4me3) and repressive (H3K9me3, H3K27me3) histone modifications to provide a chromatin context to LMNA enrichment. LMNA-bound genes are weakly or not expressed (P < 10−6, Wilcoxon rank sum test compared to RefSeq genes) (Fig. 3A), and accordingly, they are enriched in H3K9me3 and/or H3K27me3 (P < 10−4, χ2 with Yates' correction) (Fig. 3B). However, not all genes associated with LMNA are repressed, as illustrated by the wide range of expression levels of genes co-enriched in H3K4me3 in the absence of repressive marks (Fig. 3A). Thus, a fraction of LMNA-bound genes escapes repression, suggesting that LMNA association is by itself not conducive of a repressive state.
Figure 3.

LMNA associates with a repressive chromatin environment and with distinct promoter subregions. (A) Expression level of genes enriched in LMNA and indicated histone modification. (*) P < 10−6 relative to RefSeq genes; Wilcoxon rank sum test. (B) Percentage of LMNA-associated and RefSeq genes enriched in H3K4me3, H3K9me3, or H3K27me3. (*) P < 10−4 relative to RefSeq; χ2 with Yates' correction. (C) Heat map of LMNA peak position on promoters (scale, no. of genes with a LMNA peak at a given position). (D) Corresponding expression frequency heat map (scale, ratio of expressed genes/all genes for a given offset from TSS). (E) 2D heat maps of LMNA and H3K4me3 peak position on co-enriched promoters, and corresponding expression heat map; scales are as in C and D.
We next evaluated the impact of LMNA enrichment in a genomic “neighborhood” (defined as 1-Mb bins throughout the genome) on the expression of genes bound by LMNA or not bound by LMNA. We find that proportions of expressed LMNA-bound genes are negatively correlated with LMNA enrichment in 1-Mb bins (Supplemental Fig. 3). However, proportions of expressed genes not bound by LMNA do not correlate with LMNA enrichment of neighboring LMNA-bound genes (Supplemental Fig. 3). Thus, localization of a gene in an area rich in LMNA does not imply transcriptional repression, particularly if the gene is itself not tethered by LMNA.
Our findings that not all LMNA- and H3K4me3-marked genes are repressed suggest that an additional component may modulate expression of these genes, such as positioning of LMNA relative to the TSS. Mapping LMNA peak density across promoters (see Methods) shows that LMNA most frequently occupies “upstream-distal” (−1.4 kb and upstream) and “TSS/downstream” regions, and, less frequently, “upstream-proximal” regions (Fig. 3C; Supplemental Table 1). Moreover, median LMNA peak size within promoter regions is relatively short (1.5 ± 0.47 kb) (data not shown), suggesting that LMNA tends to associate with discrete and spatially restricted subregions.
A gene expression heat map corresponding to LMNA peak positioning, generated from gene expression ratios across promoter regions, shows that LMNA peak position corresponds to a distinct gene expression output. LMNA association at the TSS or upstream-proximal of the TSS coincides with essentially no expression (Fig. 3D). In contrast, upstream-distal association is compatible with gene expression (Fig. 3D), implying that these loci are marked by H3K4me3. Indeed, 2D maps of LMNA and H4K3me3 enrichment show that the most frequently expressed LMNA- and H3K4me3-enriched genes harbor H3K4me3 at the TSS/downstream and LMNA upstream-distal (Fig. 3E). However, genes with both LMNA and H3K4me3 at the TSS/downstream are not expressed. Altogether, these data suggest that LMNA association with promoters is overall spatially restricted and linked to distinct transcription outcomes in a manner dependent on local chromatin organization.
LMNA influences chromatin modifications at and beyond loci with which it interacts
Down-regulation of LMNA results in dissociation of LMNA from most promoters (Fig. 1C). Strikingly however, genes that lose LMNA are not transcriptionally activated (Fig. 4A), despite the low proportion marked by H3K9me3 or H3K27me3 (Fig. 4B). In fact, overall expression levels are not profoundly altered by loss of LMNA binding (cf. Figs. 3A, 4A, RefSeq), even though the extent of enrichment in repressive modifications globally decreases (P < 10−4) (Fig. 4C). In contrast, LMNA KD results in an increase in the proportion of genes enriched in H3K4me3 (Fig. 4C); this implies that, in addition to LMNA-bound genes, LMNA KD affects H3K4me3 on genes initially not associated with LMNA. Thus, LMNA down-regulation impacts chromatin organization by globally reducing the incidence of repressive marks and increasing the incidence of permissive marks. This occurs at loci beyond those that LMNA interacts with, mostly without affecting overall gene expression patterns.
Figure 4.

LMNA down-regulation results in chromatin rearrangement. (A) Expression level of genes that lose or retain LMNA after LMNA KD. (*) P < 10−6 relative to RefSeq genes; Wilcoxon ran sum test. (B) Proportion of H3K4me3-, H3K9me3-, or H3K27me3-marked genes that lose or retain LMNA after LMNA KD. (*) P < 10−4 compared to the percentage of genes bound by LMNA and enriched in the indicated histone modifications in ASCs; Fisher's exact test. (C) Proportion of RefSeq genes enriched in LMNA and H3K4me3, H3K9me3, or H3K27me3 in ASCs before (Native) and after LMNA KD. (*) P < 10−4 relative to native ASCs; Fisher's exact test. (D) LMNA peak density map on promoters retaining LMNA after LMNA KD. (E) H3K4me3 peak density map on all H3K4me3-enriched promoters before and after LMNA KD.
LMNA down-regulation also affects chromatin organization at the subpromoter level. Promoters retaining LMNA show preferential association upstream-distal of the TSS and much less frequently at the TSS/downstream (Fig. 4D). H3K4me3 distribution is also affected, with a marked increase upstream of the TSS, not only on promoters that retain LMNA but also on all H3K4me3 promoters (Fig. 4E). In contrast, profiles of H3K9me3 and H3K27me3 enrichment are not affected by LMNA loss (Supplemental Fig. 4). We conclude that alteration in the nuclear lamina by down-regulation of LMNA results in a remodeling of chromatin on promoters, particularly H3K4me3 marking.
Adipogenic differentiation remodels promoter interactions with LMNA and associated transcription outcomes
Our findings suggest thus far a view of LMNA positioning on a promoter linked to a given transcription outcome. To further test this possibility, we mapped LMNA-promoter interactions in ASCs differentiated into adipocytes. Adipogenic differentiation leads to a marked nuclear compaction (Fig. 5A, arrows), which is likely to affect lamin-genome interactions, particularly since levels of lamins A and C are similar (Supplemental Fig. 5A). Accordingly, adipogenic differentiation remodels LMNA-promoter interactions at several levels. (1) Loss and gain of LMNA occurs on, respectively, ∼4000 and 2000 genes (Fig. 5B; Supplemental Table 3). (2) LMNA loss affects entire LRDs; however, no de novo LRDs are detected in adipocytes (Supplemental Fig. 5B), suggesting that interactions with LMNA in adipocytes occur on stand-alone or weakly clustered loci. (3) Nearly 800 genes remain associated with LMNA (Fig. 5B). These genes are notably involved in bone morphogenic protein signaling and ectodermal and endodermal differentiation pathways (Supplemental Table S3), suggesting a selective retention of LMNA on developmentally important promoters whose function is no longer required in adipocytes. (4) LMNA-promoter interactions are also remodeled at the subpromoter level, with LMNA mainly occupying proximal promoter and TSS regions (cf. Figs. 5C and 3C). It appears, therefore, that remodeling of LMNA-promoter interactions at the genome-wide and subpromoter levels is part of the adipogenic program.
Figure 5.

Adipogenic differentiation resets LMNA-promoter interactions. (A) Differentiation of ASCs into adipocytes (21 d; lipids are stained with Oil Red-O). Arrows point to nuclei showing nuclear compaction in adipocytes. Bars, 50 μm. (B) Number of genes interacting with LMNA in ASCs and adipocytes. (C) LMNA peak density map on promoters in adipocytes. (D) Percent of genes that maintain or change expression in adipocytes relative to ASCs, as a function of retention, gain, or loss of LMNA. (Right) Proportions of up- and down-regulated genes that retain, lose, or gain LMNA. (E) Expression heat map for genes with a LMNA-bound promoter in adipocytes (scale, ratio of expressed genes/all genes for a given offset from TSS). (F) Adipogenic promoters lose LMNA association after adipogenic differentiation. Profiles show loss of LMNA from the PPARG P2 promoter and the FABP locus (green arrows), and significant gain of LMNA on the RUNX2 P1 promoter (red arrow). (G) Retention of LMNA on nonadipogenic, lineage-specific promoters (F,G) (log2 ChIP/input ratios).
Strikingly, ∼83% of genes losing or gaining LMNA after adipogenic differentiation retain their expression status of undifferentiated cells (Fig. 5D); thus, association with, and disengagement from, LMNA are largely uncoupled from changes in gene expression. Yet, ∼17% of genes escape this uncoupling and display expression changes as they lose or gain LMNA; among these, gain and loss of LMNA is, respectively, associated with transcriptional down- and up-regulation (Fig. 5D). These genes notably include genes essential for induction of adipogenesis (see below). Maintenance of expression status of genes that gain or lose LMNA after differentiation suggests that the relationship we identified between LMNA positioning and expression outcome may be altered. Indeed, in adipocytes, LMNA peak enrichment upstream-proximal or at the TSS/downstream is compatible with expression (Fig. 5E). Thus, in these cells, LMNA occupancy at the TSS or downstream appears to be no longer inhibitory for gene expression.
Collectively, these observations indicate that adipogenic differentiation results in a remodeling of subnuclear architecture. This is manifested by a readjustment of LMNA-promoter interactions at the genome-wide and subpromoter levels and by a resetting of the expression capacity of a subset of genes that interact with LMNA in adipocytes.
LMNA-promoter interaction dynamics on adipogenic control genes
A feature of LMNA-promoter interaction dynamics upon adipogenic differentiation is that it affects genes essential for induction of the adipogenic program. For instance, LMNA dissociates from the P2 promoter of the adipogenic master regulator PPARG and from the FABP locus (Fig. 5F). This disengagement from LMNA may prime their transcriptional induction, in line with the activation of these genes in adipocytes (Mikkelsen et al. 2010). Not all regulators of adipogenesis bind LMNA in ASCs, however (e.g., CEBPA, SREBF1 [also known as SREBP1]), suggesting that these may already be “primed” for activation. Additionally, genes essential for differentiation into nonadipogenic lineages are bound by LMNA in ASCs, and strikingly, most retain LMNA in adipocytes (Fig. 5G; Supplemental Fig. 5C). We also note the tethering of the RUNX2 P1 promoter after adipogenic differentiation (Fig. 5F). This promoter drives expression of the RUNX2 transcription factor to promote osteogenesis over adipogenesis (Long 2011); thus, LMNA interaction may reflect a loss of RUNX2 activation potential in adipocytes. Similarly, genes linked to pluripotency, such as POU5F1, NANOG, KLF4 and SOX2, associate with LMNA in ASCs and adipocytes (Supplemental Fig. 5D), suggesting that long-term repression may be associated with tethering to LMNA. These observations suggest that LMNA association of promoters important for lineage commitment is under developmental control and regulated in a locus-specific manner.
Discussion
Peripheral and intra-nuclear lamin-rich domains
We identify LMNA-associated promoters for over 25% of RefSeq genes in human adipose stem cells. A feature of lamins A and C is the existence of a nucleoplasmic detergent-soluble pool (Kolb et al. 2011), in addition to a peripheral pool, because they lack C-terminal farnesylation mediating attachment to the inner nuclear membrane (Burke and Stewart 2013). Under conditions used in our study, ChIP slightly enriches lamin C over lamin A, likely as a result of its greater solubility (Kolb et al. 2011). This enrichment may yield an underrepresentation of loci associated with peripheral, less soluble A-type lamins. Nonetheless, ChIP and 3D immuno-FISH data demonstrate interactions of LMNA with promoters and are consistent with interactions taking place at the nuclear periphery and in the nuclear interior. In fact, some LMNA-enriched loci are found exclusively in the nuclear interior (e.g., ACTL7A, DNAL4), and LMNA-interacting loci with alleles at the nuclear periphery also display alleles in the interior (e.g., DEFA3, SCN10A, TCN1, ATP5EP2).
Imaging of single cells based on tagging of sequences in proximity to the lamina reveals that only 38% of LADs are at the nuclear periphery (Kind et al. 2013). Similarly, in our study, only ∼30% of alleles of loci associated with LMNA and located within LRDs are detected at the nuclear periphery. This implies that a significant proportion of LRDs (or LADs) localize in the nuclear interior and that associations with the periphery are transient (Kind et al. 2013). One may speculate that some of the loci detected by FISH close to the periphery (e.g., DEFA3, SCN10A, TCN1, ACTL7A) could, at some other time point, locate at the periphery. In contrast, loci localized in the nuclear interior (e.g., DNAL4, NANOG) and associated with LMNA may be anchored to intra-nuclear LRDs (or LADs) because they may be too far from the periphery. It will be important to identify DNA sequences associated with nucleoplasmic and peripheral lamins, address whether lamin association with the genome is direct or mediated by transcription factors, and determine whether peripheral and intra-nuclear LRDs are functionally different.
Association of LMNA with distinct promoter subregions
LMNA interactions often appear to be confined to promoter subregions rather than to entire promoter regions. This suggests that even when LMNA-interacting promoters are contiguous, as within LRDs, interactions with the lamina may occur through multiple spatially restricted regions. This view is consistent with the interaction of nuclear lamins with short LASs (in the kb range) able to target sequences to the nuclear periphery (Zullo et al. 2012) and with focal genomic domains associating with the nuclear membrane in Caenorhabditis elegans (Ikegami et al. 2010). LMNA may also punctually directly or indirectly associate with loci outside LRDs through targeting DNA motifs (Ahmed et al. 2010; Brickner et al. 2012; Zullo et al. 2012). Of note, A/T-rich motifs may be contained within so-called scaffold/matrix attachment regions (S/MARs) that have previously been shown to directly bind lamins in vitro (Luderus et al. 1994; Baricheva et al. 1996; Zhao et al. 1996).
LMNA can be differentially positioned on promoters, and our data suggest that this is linked to distinct transcription outputs of the corresponding genes. Upstream-proximal and TSS/downstream LMNA interaction correlates with gene inactivity in undifferentiated ASCs, regardless of histone methylation mark. Repression of genes with LMNA and H3K4me3 at the TSS may be due to inhibition of nucleosome turnover (Henikoff 2008), facilitated recruitment of repressive chromatin modifiers, or inhibition of transcription by blocking access of the TSS for RNA polymerase II. Expansion of H3K4me3 upstream of the TSS on promoters after LMNA loss supports a view of LMNA hindering the targeting of factors to the TSS. RNA polymerase II and H3K4me2 have been observed at LAD borders, and some genes within LADs are transcribed (Guelen et al. 2008). Our data show co-enrichment in LMNA and H3K4me3 on genes that are expressed in undifferentiated ASCs, when these marks do not spatially coincide. We suggest, therefore, that lamin-promoter interactions, per se, do not have a causative role on gene repression but may be able to modulate transcription in a manner dependent on local chromatin marks.
The significance of LMNA-promoter interaction may also be cell type–dependent. LMNA association with the TSS region in ASCs is frequently coupled to transcriptional repression, whereas in adipocytes, it is more frequently coupled to expression. How may we reconcile this LMNA association with gene expression in adipocytes? Interestingly, although LMNA association with the TSS is still detected in adipocytes, the density of LMNA peaks in this subregion is significantly reduced, highlighting a dose-dependent effect of lamin binding. In addition, the majority of expressed genes bound to LMNA in adipocytes is already expressed in ASCs and thus may already be in a permissive state compatible with LMNA-TSS interaction. Upon differentiation, promoter-associated LMNA may also interact with a new set of regulatory partners enabling transcription or with chromatin remodelers with dual activator or repressor functions depending on subunit composition (Euskirchen et al. 2011).
LMNA neighborhoods are, per se, not transcriptionally repressive
LMNA enrichment level in a genomic “neighborhood” (which may contain one or several LRDs) correlates with transcriptional repression in that neighborhood. However, within a LMNA neighborhood, expression of genes not bound by LMNA is not affected by LMNA level in that neighborhood. Thus, a LMNA neighborhood is, in itself, not conducive of transcriptional repression. Accordingly, depletion of the H3K9 histone methyltransferase EHMT2 (also known as G9A) relieves repression of genes in the vicinity of the lamina without affecting their peri-nuclear location (Yokochi et al. 2009). So, LMNA may participate in genomic recruitment to, or stabilization within, a repressive compartment and not confer repression per se. This view is consistent with SET-domain methyltransferases mediating recruitment and silencing of loci at the lamina in C. elegans (Towbin et al. 2012) and in mammalian cells (Kind et al. 2013) and with peripheral targeting of the hunchbback locus in Drosophila neuroblasts after its inactivation (Kohwi et al. 2013). In addition, through chromatin looping in the nuclear space (McCord et al. 2012), intra-nuclear lamins may cluster linearly distant loci, and chromosomal interactions (Kind and van Steensel 2010) may bring a lamin-deprived locus to the nuclear periphery.
Cell lineage–specific interaction of LMNA with promoters
Interactions of the genome with the nuclear lamina are dynamic (Kind et al. 2013) and developmentally modulated (Pickersgill et al. 2006; Meister et al. 2010; Peric-Hupkes et al. 2010). Adipogenic differentiation relocalizes promoters from and to LMNA. Adipogenic differentiation requires a proliferation step during which mitotic disassembly and reassembly of the lamina likely provokes a redistribution of lamin-interacting domains (Kind et al. 2013). Nonetheless, the conservation of some LRDs after differentiation suggests the retention of an LRD “memory” on mitotic chromosomes, which would be consistent with a model of “constitutive LADs” maintained between cell types (Meuleman et al. 2012).
We detect a loss of LMNA from adipogenic promoters that are activated after induction of differentiation. This contrasts with promoters important for pluripotency or differentiation into nonadipogenic lineages which retain LMNA. We propose a model of cell type– and lineage-specific association of loci with LMNA and disengagement of these loci from LMNA in a lineage-specific manner (Fig. 6). This model is consistent with a locus-specific developmental regulation of lamin interactions with promoters important for differentiation and lineage commitment.
Figure 6.
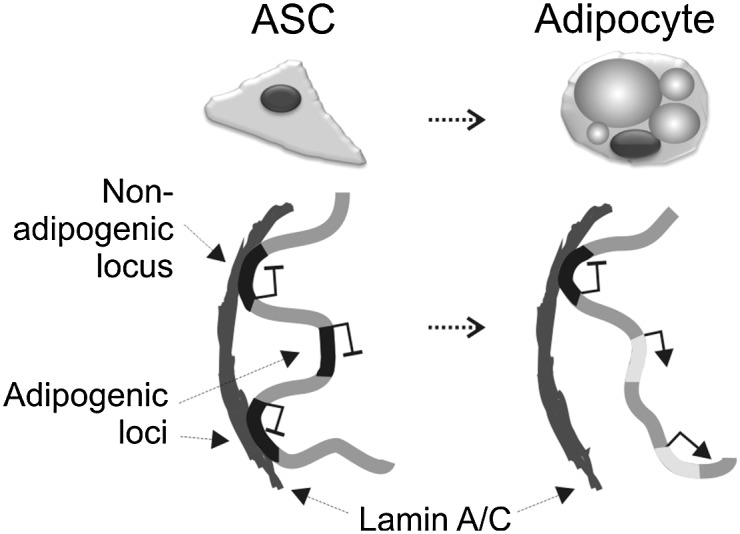
Developmental regulation of LMNA association of promoters important for lineage commitment. In undifferentiated adipocyte progenitors (ASCs), master regulator genes of differentiation into adipogenic and nonadipogenic lineages are tethered to LMNA and not expressed. Adipogenic differentiation results in disengagement of adipogenic loci from LMNA and their transcriptional activation. However, nonadipogenic loci remain associated with LMNA in adipocytes. These include genes important for differentiation into, e.g., osteogenic or myogenic pathways, endodermal and ectodermal lineages, as well as pluripotency-associated genes.
Methods
Adipose stem cells
ASCs were cultured as a pool from three donors and used at passages 8–9 as described (Boquest et al. 2005). Adipogenic differentiation was induced for 21 d with 1-methyl-3 isobutylxanthine, dexamethasone, insulin, and indomethacin, and lipid-stained with Oil red-O (Boquest et al. 2005).
LMNA silencing by shRNA
An shRNA targeting the 5′ UTR of LMNA transcripts and a control shRNA were designed with the following sequences (LMNA-specific and control sequences are underscored): shRNA-LMNA – 5′-tgctgttgacagtgagcgatccgagcagtctctgtccttctagtgaagccacagatgtagaaggacagagactgctcggagtgcctactgcctcgga-3′; control shRNA –5′-tgctgttgacagtgagcgggtgcttgactaccccctactttagtgaagccacagatgtaaagtagggggtagtcaagcacctgcctactgcctcgga-3′.
Sequences were cloned into BamHI/Mlu sites to a Lentiviral pGIPZ vector (ThermoFisher Scientific). Lentiviruses were produced in 293T cells. Cells were transduced and cultured with 1.5 μg/mL puromycin for 8 d to select shRNA-expressing cells, and maintained in culture with 0.1 μg/mL puromycin. shRNA expression was induced with 1 μg/mL doxycyclin in the presence of 0.1 μg/mL puromycin for 6 d.
Expression microarrays
Three replicate array experiments were done for ASCs, LMNA-KD ASCs, and adipocytes using Illumina HumanHT-12 v4 expression BeadChip arrays. The Gene Expression module from Illumina GenomeStudio was used to compute a detection P-value for each probe. Signal intensities between replicates were normalized using the lumi package (Du et al. 2008) and replicate signals combined by using median signal intensity. A gene was considered expressed when probe intensities were significantly stronger (P < 0.01) than background signals. Adipocyte gene expression data have been published earlier (Sørensen et al. 2010) and are available in NCBI GEO with accession code number GSE19773.
Chromatin immunoprecipitation
ChIP of modified histones (H3K9me3, Diagenode, pAb-056-050; H3K27me3, Millipore, 07-449; H3K4me3, Abcam, Ab8580) and processing for array hybridization were as described (Sørensen et al. 2010). For LMNA ChIP, cells were cross-linked for 8 min with 1% formaldehyde and chromatin prepared by lysis (5 min on ice) and sonication into 200- to 400-bp fragments for 4 × 10 min on a Bioruptor (Diagenode) in lysis buffer (10 mM Tris-HCl, pH 7.5, 10 mM KCl, 2 mM EDTA, 1% Triton X-100, and protease inhibitors). Chromatin (100 μl at 5 A260 units) was incubated on a rotator overnight at 4°C with 2.4 μg anti-lamin A/C antibody (Santa Cruz, sc-7292) coupled to Dynabeads Protein A (Invitrogen). ChIP material was washed three times in lysis buffer, the cross-link was reversed, and DNA was purified by phenol-chloroform isoamyl-alcohol extraction, RNAse-treated, and processed for microarray hybridization (Sørensen et al. 2010). For ChIP-qPCR, purified LMNA ChIP DNA was eluted in 30 μl H2O and 2.5 μl used as a template for qPCR. Duplicate qPCRs were run on a MyiQ Real-time machine with SYBR Green (BioRad) using primers listed in Supplemental Table 4. PCR conditions were 95°C for 3 min and 40 cycles of 95°C for 30 sec, 60°C for 30 sec, and 72°C for 30 sec.
Array hybridization and data preprocessing
ChIP and input DNA fragments were, respectively, labeled with Cy5 and Cy3 and hybridized to human HG18 RefSeq Promoter arrays (Roche) tiling 3.2 kb upstream of and 0.8 kb downstream from the TSS of 17,790 RefSeq genes. A promoter region was defined as the interval spanning −2200 bp to +500 bp of a TSS. Each probe was assigned an MA2C score (Song et al. 2007) to reflect normalized and window-averaged log2 ChIP/Input ratios, with peak calling at P < 0.01 using a 1-kb sliding window. Peaks within 500 bp of each other were merged.
LMNA-enriched domains and bins
Each chromosome was viewed as a sequence of genes, ordered by the position of their TSS. A sliding window of 31 genes (“size 31”) with step size 1 was used to count genes enriched in LMNA in the vicinity (+/− 15 genes) of the middle gene at each iteration. Repeating occurrences of the same gene were collapsed. We performed 10,000 trials in a Monte Carlo simulation to test whether LMNA enrichment clusters at the gene level. In each trial, the number of LMNA-enriched genes per chromosome was kept constant and identical to our experimental results, but the order of genes was shuffled. The sample set of the number of LMNA-enriched genes in the vicinity of more than 10 LMNA-enriched genes was fitted to a normal distribution.
Motif discovery
Motif discovery within sequences underlying LMNA peaks was done using the RSAT peak-motifs pipeline (Thomas-Chollier et al. 2011) with the oligo-analysis module.
Promoter density maps
The number of transcripts with a LMNA or modified histone peak at a given position as a function of distance from the TSS determined whether a mark had a nonuniform distribution of peaks in promoter regions, and if so, where. This was computed by the following equation:
where  equals 1 if transcript i has a peak of a given type at position x relative to the TSS and equals 0 otherwise.
The relationship between relative peak position and transcription can similarly be expressed as the ratio of expressed transcripts as a function of peak position relative to the TSS:
 |
where  equals 1 if transcript i is transcribed and equals 0 otherwise.
 is as defined above.
It is thus possible to examine the subset of promoters enriched by at least two marks to determine whether interplay between the two marks alters the typical distribution of peaks for at least one of the marks. To gain information on how peaks of two marks are positioned on the same promoter, analysis was extended into two dimensions as follows:
where x is the position of X peaks relative to the TSS, y is the position of Y peaks relative to the TSS, and  equals 1 if transcript i has a peak of type X at position x and a peak of type Y at position y relative to the TSS.
The transcription ratio as a function of peak position relative to the TSS can similarly be extended to two dimensions:
 |
where  and
and  are as above.
Immunolabeling and fluorescence in situ hybridization
ASCs cultured on glass slides were washed in PBS before fixation in 3% paraformaldehyde/PBS for 15 min. After three washes in PBS, cells were permeabilized for 30 min in 0.01% Tween/0.1% Triton X-100/2% BSA/PBS. Cells were incubated with anti-lamin A/C antibodies (1:400; Santa Cruz sc-7292) for 1 h in 0.01% Tween/ 2% BSA/PBS, washed 3× in PBS, and incubated with anti-mouse Cy3-conjugated antibodies (1:200; Jackson Immunoresearch) for 1 h in 0.01% Tween/2% BSA/PBS. Cells were washed and refixed in 4% paraformaldehyde/PBS for 10 min for FISH. Fosmid clones (Supplemental Table 5) from BACPAC (http://bacpac.chori.org/) were prepared and nick-translated with digoxigenin-11-dUTP. The HOXB9 clone was described previously (di Pietro et al. 2012). One hundred to 150 ng digoxigenin-labeled probes were used per slide with 8–12 μg human Cot-1 DNA and 12 μg herring sperm DNA. Slides were denatured in 70% (vol/vol) formamide/2×SSC at 80°C for 20 min. Probes were denatured at 80°C for 5 min, reannealed with Cot1 DNA for 15 min at 37°C, and hybridized to the slides overnight. Washes and detection were as described (Eskeland et al. 2010). DNA was stained with 0.5 μg/mL 4,6-diamidino-2-phenylindole (DAPI), mounted in Vectashield (Vector), and examined with a 100× oil objective (NA 1.4) on a PersonalDV (Delta Vision) wide-field imaging station (Applied Precision, auxiliary magnification of 1.6 and optical step size of 0.2 μm through the whole nucleus). Images were deconvoluted with the integrated software (softWoRx v04.1.2).
Image analysis
For measurements of FISH spots and of their distance to peripheral LMNA, we used ImageJ (http://imagej.nih.gov/ij/) (Schneider et al. 2012) with the Sync_Measure_3D plug-in (http://rsb.info.nih.gov/ij/), default threshold and line tool. Measurement of the shortest distance of each of the two FISH signals to the nuclear boundary in three dimensions was done by defining the outline of the LMNA stain in each frame of the z-stack and measuring the distance in the stack with the highest level of intensity from the center of each fluorescent spot to the inner boundary of LMNA (on the xy-axis). Nuclei with FISH signals near the top or bottom in the z-axis were not evaluated due to fuzziness of FISH signals and LMNA immunolabeling, making measurements inaccurate.
Immunofluorescence and immunoblotting
Immunofluorescence labeling of lamin A/C was done as described (Steen and Collas 2001) using anti-lamin A/C antibodies (Santa Cruz, sc-7292). Immunoblotting was done as described (Duband-Goulet et al. 2011) using antibodies to lamin A/C (1:2000 dilution; Santa Cruz, sc-7292), lamin B1 (1:1000; Santa Cruz, sc-6216), and γ-tubulin (1:10,000; Sigma, T5326), and horseradish peroxidase-conjugated secondary antibodies.
Data access
LMNA ChIP, histone ChIP, and ASC expression data have been deposited in the NCBI Gene Expression Omnibus (GEO; http://www.ncbi.nlm.nih.gov/geo/) under accession number GSE42560.
Acknowledgments
We thank K. Vekterud for technical assistance. This work was supported by the Centre National de la Recherche Scientifique-University Paris-Diderot Paris 7, and Association Française de lutte contre les Myopathies (B.B., I.D.-G.), and by the Research Council of Norway, South-East Health Norway, the Cancer Society (P.C.), and the University of Oslo (P.C., R.E.).
Footnotes
[Supplemental material is available for this article.]
Article published online before print. Article, supplemental material, and publication date are at http://www.genome.org/cgi/doi/10.1101/gr.159400.113.
References
- Ahmed S, Brickner DG, Light WH, Cajigas I, McDonough M, Froyshteter AB, Volpe T, Brickner JH 2010. DNA zip codes control an ancient mechanism for gene targeting to the nuclear periphery. Nat Cell Biol 12: 111–118 [DOI] [PMC free article] [PubMed] [Google Scholar]
- An G, Miner CA, Nixon JC, Kincade PW, Bryant J, Tucker PW, Webb CF 2010. Loss of Bright/ARID3a function promotes developmental plasticity. Stem Cells 28: 1560–1567 [DOI] [PMC free article] [PubMed] [Google Scholar]
- Baricheva EA, Berrios M, Bogachev SS, Borisevich IV, Lapik ER, Sharakhov IV, Stuurman N, Fisher PA 1996. DNA from Drosophila melanogaster β-heterochromatin binds specifically to nuclear lamins in vitro and the nuclear envelope in situ. Gene 171: 171–176 [DOI] [PubMed] [Google Scholar]
- Boquest AC, Shahdadfar A, Fronsdal K, Sigurjonsson O, Tunheim SH, Collas P, Brinchmann JE 2005. Isolation and transcription profiling of purified uncultured human stromal stem cells: Alteration of gene expression after in vitro cell culture. Mol Biol Cell 16: 1131–1141 [DOI] [PMC free article] [PubMed] [Google Scholar]
- Brickner DG, Ahmed S, Meldi L, Thompson A, Light W, Young M, Hickman TL, Chu F, Fabre E, Brickner JH 2012. Transcription factor binding to a DNA zip code controls interchromosomal clustering at the nuclear periphery. Dev Cell 22: 1234–1246 [DOI] [PMC free article] [PubMed] [Google Scholar]
- Burke B, Stewart CL 2013. The nuclear lamins: Flexibility in function. Nat Rev Mol Cell Biol 14: 13–24 [DOI] [PubMed] [Google Scholar]
- di Pietro M, Lao-Sirieix P, Boyle S, Cassidy A, Castillo D, Saadi A, Eskeland R, Fitzgerald RC 2012. Evidence for a functional role of epigenetically regulated midcluster HOXB genes in the development of Barrett esophagus. Proc Natl Acad Sci 109: 9077–9082 [DOI] [PMC free article] [PubMed] [Google Scholar]
- Du P, Kibbe WA, Lin SM 2008. lumi: A pipeline for processing Illumina microarray. Bioinformatics 24: 1547–1548 [DOI] [PubMed] [Google Scholar]
- Duband-Goulet I, Woerner S, Gasparini S, Attanda W, Konde E, Tellier-Lebegue C, Craescu CT, Gombault A, Roussel P, Vadrot N, et al. 2011. Subcellular localization of SREBP1 depends on its interaction with the C-terminal region of wild-type and disease related A-type lamins. Exp Cell Res 317: 2800–2813 [DOI] [PMC free article] [PubMed] [Google Scholar]
- Eskeland R, Leeb M, Grimes GR, Kress C, Boyle S, Sproul D, Gilbert N, Fan Y, Skoultchi AI, Wutz A, et al. 2010. Ring1B compacts chromatin structure and represses gene expression independent of histone ubiquitination. Mol Cell 38: 452–464 [DOI] [PMC free article] [PubMed] [Google Scholar]
- Euskirchen GM, Auerbach RK, Davidov E, Gianoulis TA, Zhong G, Rozowsky J, Bhardwaj N, Gerstein MB, Snyder M 2011. Diverse roles and interactions of the SWI/SNF chromatin remodeling complex revealed using global approaches. PLoS Genet 7: e1002008. [DOI] [PMC free article] [PubMed] [Google Scholar]
- Guelen L, Pagie L, Brasset E, Meuleman W, Faza MB, Talhout W, Eussen BH, de Klein A, Wessels L, de Laat W, et al. 2008. Domain organization of human chromosomes revealed by mapping of nuclear lamina interactions. Nature 453: 948–951 [DOI] [PubMed] [Google Scholar]
- Henikoff S 2008. Nucleosome destabilization in the epigenetic regulation of gene expression. Nat Rev Genet 9: 15–26 [DOI] [PubMed] [Google Scholar]
- Ikegami K, Egelhofer TA, Strome S, Lieb JD 2010. Caenorhabditis elegans chromosome arms are anchored to the nuclear membrane via discontinuous association with LEM-2. Genome Biol 11: R120. [DOI] [PMC free article] [PubMed] [Google Scholar]
- Kind J, van Steensel B 2010. Genome-nuclear lamina interactions and gene regulation. Curr Opin Cell Biol 22: 320–325 [DOI] [PubMed] [Google Scholar]
- Kind J, Pagie L, Ortabozkoyun H, Boyle S, de Vries SS, Janssen H, Amendola M, Nolen LD, Bickmore WA, van Steensel B 2013. Single-cell dynamics of genome-nuclear lamina interactions. Cell 153: 178–192 [DOI] [PubMed] [Google Scholar]
- Kohwi M, Lupton JR, Lai SL, Miller MR, Doe CQ 2013. Developmentally regulated subnuclear genome reorganization restricts neural progenitor competence in Drosophila. Cell 152: 97–108 [DOI] [PMC free article] [PubMed] [Google Scholar]
- Kolb T, Maass K, Hergt M, Aebi U, Herrmann H 2011. Lamin A and lamin C form homodimers and coexist in higher complex forms both in the nucleoplasmic fraction and in the lamina of cultured human cells. Nucleus 2: 425–433 [DOI] [PubMed] [Google Scholar]
- Kubben N, Adriaens M, Meuleman W, Voncken JW, van Steensel B, Misteli T 2012. Mapping of lamin A- and progerin-interacting genome regions. Chromosoma 121: 447–464 [DOI] [PMC free article] [PubMed] [Google Scholar]
- Long F 2011. Building strong bones: Molecular regulation of the osteoblast lineage. Nat Rev Mol Cell Biol 13: 27–38 [DOI] [PubMed] [Google Scholar]
- Luderus ME, den Blaauwen JL, de Smit OJ, Compton DA, van Driel R 1994. Binding of matrix attachment regions to lamin polymers involves single-stranded regions and the minor groove. Mol Cell Biol 14: 6297–6305 [DOI] [PMC free article] [PubMed] [Google Scholar]
- Mattout A, Pike BL, Towbin BD, Bank EM, Gonzalez-Sandoval A, Stadler MB, Meister P, Gruenbaum Y, Gasser SM 2011. An EDMD mutation in C. elegans lamin blocks muscle-specific gene relocation and compromises muscle integrity. Curr Biol 21: 1603–1614 [DOI] [PubMed] [Google Scholar]
- McCord R, Nazario-Toole A, Zhang H, Chines P, Zhan Y, Erdos M, Collins F, Dekker J, Cao K 2012. Correlated alterations in genome organization, histone methylation, and DNA-lamin A/C interactions in Hutchinson-Gilford progeria syndrome. Genome Res 23: 260–269 [DOI] [PMC free article] [PubMed] [Google Scholar]
- Meister P, Towbin BD, Pike BL, Ponti A, Gasser SM 2010. The spatial dynamics of tissue-specific promoters during C. elegans development. Genes Dev 24: 766–782 [DOI] [PMC free article] [PubMed] [Google Scholar]
- Meuleman W, Peric-Hupkes D, Kind J, Beaudry JB, Pagie L, Kellis M, Reinders M, Wessels L, van Steensel B 2012. Constitutive nuclear lamina-genome interactions are highly conserved and associated with A/T-rich sequence. Genome Res 23: 270–280 [DOI] [PMC free article] [PubMed] [Google Scholar]
- Mikkelsen TS, Xu Z, Zhang X, Wang L, Gimble JM, Lander ES, Rosen ED 2010. Comparative epigenomic analysis of murine and human adipogenesis. Cell 143: 156–169 [DOI] [PMC free article] [PubMed] [Google Scholar]
- Peric-Hupkes D, Meuleman W, Pagie L, Bruggeman SW, Solovei I, Brugman W, Graf S, Flicek P, Kerkhoven RM, van Lohuizen M, et al. 2010. Molecular maps of the reorganization of genome-nuclear lamina interactions during differentiation. Mol Cell 38: 603–613 [DOI] [PMC free article] [PubMed] [Google Scholar]
- Pickersgill H, Kalverda B, de Wit E, Talhout W, Fornerod M, van Steensel B 2006. Characterization of the Drosophila melanogaster genome at the nuclear lamina. Nat Genet 38: 1005–1014 [DOI] [PubMed] [Google Scholar]
- Reddy KL, Zullo JM, Bertolino E, Singh H 2008. Transcriptional repression mediated by repositioning of genes to the nuclear lamina. Nature 452: 243–247 [DOI] [PubMed] [Google Scholar]
- Schneider CA, Rasband WS, Eliceiri KW 2012. NIH Image to ImageJ: 25 years of image analysis. Nat Methods 9: 671–675 [DOI] [PMC free article] [PubMed] [Google Scholar]
- Schreiber KH, Kennedy BK 2013. When lamins go bad: Nuclear structure and disease. Cell 152: 1365–1375 [DOI] [PMC free article] [PubMed] [Google Scholar]
- Song JS, Johnson WE, Zhu X, Zhang X, Li W, Manrai AK, Liu JS, Chen R, Liu XS 2007. Model-based analysis of two-color arrays (MA2C). Genome Biol 8: R178. [DOI] [PMC free article] [PubMed] [Google Scholar]
- Sørensen AL, Jacobsen BM, Reiner AH, Andersen IS, Collas P 2010. Promoter DNA methylation patterns of differentiated cells are largely programmed at the progenitor stage. Mol Biol Cell 21: 2066–2077 [DOI] [PMC free article] [PubMed] [Google Scholar]
- Steen RL, Collas P 2001. Mistargeting of B-type lamins at the end of mitosis: Implications on cell survival and regulation of lamins A/C expression. J Cell Biol 153: 621–626 [DOI] [PMC free article] [PubMed] [Google Scholar]
- Stewart C, Burke B 1987. Teratocarcinoma stem cells and early mouse embryos contain only a single major lamin polypeptide closely resembling lamin B. Cell 51: 383–392 [DOI] [PubMed] [Google Scholar]
- Thomas-Chollier M, Defrance M, Medina-Rivera A, Sand O, Herrmann C, Thieffry D, van Helden J 2011. RSAT 2011: Regulatory sequence analysis tools. Nucleic Acids Res 39: e41. [DOI] [PMC free article] [PubMed] [Google Scholar]
- Towbin BD, Gonzalez-Aguilera C, Sack R, Gaidatzis D, Kalck V, Meister P, Askjaer P, Gasser SM 2012. Step-wise methylation of histone H3K9 positions heterochromatin at the nuclear periphery. Cell 150: 934–947 [DOI] [PubMed] [Google Scholar]
- Webb CF, Bryant J, Popowski M, Allred L, Kim D, Harriss J, Schmidt C, Miner CA, Rose K, Cheng HL, et al. 2011. The ARID family transcription factor bright is required for both hematopoietic stem cell and B lineage development. Mol Cell Biol 31: 1041–1053 [DOI] [PMC free article] [PubMed] [Google Scholar]
- Worman HJ, Lazaridis I, Georgatos SD 1988. Nuclear lamina heterogeneity in mammalian cells. Differential expression of the major lamins and variations in lamin B phosphorylation. J Biol Chem 263: 12135–12141 [PubMed] [Google Scholar]
- Yokochi T, Poduch K, Ryba T, Lu J, Hiratani I, Tachibana M, Shinkai Y, Gilbert DM 2009. G9a selectively represses a class of late-replicating genes at the nuclear periphery. Proc Natl Acad Sci 106: 19363–19368 [DOI] [PMC free article] [PubMed] [Google Scholar]
- Zhao K, Harel A, Stuurman N, Guedalia D, Gruenbaum Y 1996. Binding of matrix attachment regions to nuclear lamin is mediated by the rod domain and depends on the lamin polymerization state. FEBS Lett 380: 161–164 [DOI] [PubMed] [Google Scholar]
- Zuleger N, Robson MI, Schirmer EC 2011. The nuclear envelope as a chromatin organizer. Nucleus 2: 339–349 [DOI] [PMC free article] [PubMed] [Google Scholar]
- Zuleger N, Boyle S, Kelly DA, de las Heras JI, Lazou V, Korfali N, Batrakou DG, Randles KN, Morris GE, Harrison DJ, et al. 2013. Specific nuclear envelope transmembrane proteins can promote the location of chromosomes to and from the nuclear periphery. Genome Biol 14: R14. [DOI] [PMC free article] [PubMed] [Google Scholar]
- Zullo JM, Demarco IA, Pique-Regi R, Gaffney DJ, Epstein CB, Spooner CJ, Luperchio TR, Bernstein BE, Pritchard JK, Reddy KL, et al. 2012. DNA sequence-dependent compartmentalization and silencing of chromatin at the nuclear lamina. Cell 149: 1474–1487 [DOI] [PubMed] [Google Scholar]