

Abstract
Pairs of RNA molecules transcribed from partially or entirely complementary loci are called cis-natural antisense transcripts (cis-NATs), and they play key roles in the regulation of gene expression in many organisms. A promising experimental tool for profiling sense and antisense transcription is strand-specific RNA sequencing (ssRNA-seq). To identify cis-NATs using ssRNA-seq, we developed a new computational method based on a model comparison framework that incorporates the inherent variable efficiency of generating perfectly strand-specific libraries. Applying the method to new ssRNA-seq data from whole-root and cell-type–specific Arabidopsis libraries confirmed most of the known cis-NAT pairs and identified 918 additional cis-NAT pairs. Newly identified cis-NAT pairs are supported by polyadenylation data, alternative splicing patterns, and RT-PCR validation. We found 209 cis-NAT pairs that have opposite expression levels in neighboring cell types, implying cell-type–specific roles for cis-NATs. By integrating a genome-wide epigenetic profile of Arabidopsis, we identified a unique chromatin signature of cis-NATs, suggesting a connection between cis-NAT transcription and chromatin modification in plants. An analysis of small-RNA sequencing data showed that ∼4% of cis-NAT pairs produce putative cis-NAT–induced siRNAs. Taken together, our data and analyses illustrate the potential for multifaceted regulatory roles of plant cis-NATs.
Regulatory RNAs, such as microRNAs, small interfering RNAs (siRNAs), and long intergenic noncoding RNAs (lincRNAs), play fundamental roles in the control of gene expression in many organisms (Pasquinelli 2012; Rinn and Chang 2012). One particular type of RNA-mediated gene expression regulation involves cis-NATs (natural antisense transcripts), where pairs of antisense transcripts are generated from the same genomic locus. cis-NAT pairs are a widely occurring phenomenon in eukaryotic organisms; ∼20% of human genes and ∼9% of Arabidopsis genes have been predicted to form cis-NAT pairs (Wang et al. 2005; Sun et al. 2006). The most common type of cis-NAT pairs is formed by the overlapping 3′ ends of a pair of coding or noncoding RNA transcripts (Wang et al. 2005). Overlapping 5′ ends of a cis-NAT pair or complete inclusion of one antisense transcript in another sense transcript have also been found (Lapidot and Pilpel 2006).
cis-NATs regulate gene expression by a variety of mechanisms such as causing RNA polymerase II collision (Prescott and Proudfoot 2002), mediating chromatin modification (Pandey et al. 2008; Conley and Jordan 2012; Modarresi et al. 2012; Luo et al. 2013; Zhan and Lukens 2013), inducing siRNA (nat-siRNA) formation (Borsani et al. 2005; Zhang et al. 2012), and controlling translation (Carrieri et al. 2012). To date, nearly 100 pairs of functional natural antisense transcripts have been characterized in mammalian systems and in plants (Faghihi and Wahlestedt 2009). We are now seeing an acceleration in the discovery of functional NATs involved in human diseases, such as cancer (Morris et al. 2008; Yu et al. 2008) and neurodegenerative disorders (Faghihi et al. 2008; Carrieri et al. 2012), metabolic disorders (Li et al. 2012), as well as in plant stress responses (Borsani et al. 2005) and plant development (Ron et al. 2010).
Although sequencing of cDNA/EST libraries (Jen et al. 2005; Wang et al. 2005) and microarray experiments (Ge et al. 2008; Morrissy et al. 2011) have provided preliminary genome-wide assessments of cis-NATs (Henz et al. 2007; Jin et al. 2008; Chen et al. 2012), results from these early studies are less than ideal (Weber et al. 2007). In recent years, the advent of high-throughput sequencing has provided the opportunity to systematically characterize the transcriptome at higher coverage and better accuracy than conventional approaches (Mortazavi et al. 2008). In particular, a number of strand-specific RNA-seq (ssRNA-seq) protocols have been designed to characterize antisense transcripts (Levin et al. 2010; Passalacqua et al. 2012). Because the length of RNA-seq reads is still shorter than the length of coding or noncoding RNAs in the cis-NAT pairs, true cis-NAT pairs can only be identified by computational tools and statistical inference methods that integrate the information from many short reads. For example, a study in yeast found over 1000 “antisense units,” defined as regions where antisense reads cover 25% of the annotated sense gene regions (Yassour et al. 2010). In other studies, hundreds of antisense transcripts were identified by simply using minimal numbers of antisense reads, such as requiring the presence of at least two antisense reads in mouse brain libraries (Parkhomchuk et al. 2009) or three antisense reads in mouse intestine libraries (Klostermeier et al. 2011). The accuracy of these computational strategies using simple thresholds can be affected by the biological variation in the RNA-seq data (Glaus et al. 2012), library size differences (Bullard et al. 2010), and the efficiency of producing perfectly strand-specific libraries (Levin et al. 2010).
The power of statistical modeling to analyze read count data has been demonstrated for many applications, including identification of differentially expressed genes (Anders and Huber 2010; Robinson et al. 2010) or quantification of alternative splice isoforms (Trapnell et al. 2010; Li and Dewey 2011). However, most existing statistical methods for RNA-seq quantification assume that the RNA-seq protocol is either perfectly nonstrand-specific or perfectly strand-specific. In the perfectly strand-specific case, a sense strand gene is assumed to generate reads that only map to the sense strand; the reads that map to the antisense stand are discarded (Trapnell et al. 2010). However, a recent comprehensive study found that ssRNA-seq protocols have variable error rates (Levin et al. 2010), defined as the fraction of antisense reads generated by the sense gene. Depending on the protocol, from 1% to 12% of all reads that result from the expression of a sense strand gene are mapped to the reverse strand of that gene. This variable error rate of strand-specific protocols is the result of complex biochemical reactions that occur during library preparation and thus may never be completely eliminated. Moreover, the error rate of the same protocol could change from one library to another, causing additional variability between libraries and lowering the accuracy of expression quantification. To accurately identify cis-NAT pairs using ssRNA-seq data and to further characterize the mechanism by which cis-NAT pairs regulate gene expression, we introduce a probabilistic method called natural antisense transcripts identification using RNA-seq (NASTI-seq). NASTI-seq incorporates the variable error rate of a strand-specific protocol in a read count model, and therefore outperforms other computational approaches in identifying cis-NAT pairs.
To systematically characterize cis-NATs in Arabidopsis, we generated strand-specific RNA libraries from the Arabidopsis root, which is an excellent model system for studying spatial and temporal gene expression patterns (Brady et al. 2007; Petricka et al. 2012). Since little is known about the cell-type–specific expression of cis-NATs in any plant species, we chose to look for cis-NATs in the endodermis (ENDO) and cortex (CORT), two cell types that are derived from the same stem cell precursor and are the product of an asymmetric cell division. By using NASTI-seq and over 120 million mapped reads, we not only confirmed approximately 1500 annotated cis-NAT pairs but also identified an additional 918 candidate cis-NAT pairs, which increases the total known cis-NAT pairs in Arabidopsis by >60%. We also identified more than 200 cis-NAT pairs that show opposite expression patterns in the endodermis and cortex, suggesting potential cell-type–specific roles of cis-NATs. From previously acquired cell-type–specific small RNA sequencing data (Breakfield et al. 2012), we identified dozens of loci of cis-NAT–induced siRNAs (nat-siRNA). By analyzing the chromatin marks of the cis-NAT pairs (Roudier et al. 2011), we found a signature in the density of activating chromatin marks in the promoter region of the sense gene, suggesting a connection between antisense transcription and chromatin modification. Our statistical model is very flexible, can be applied to any strand-specific protocol to identify cis-NAT pairs in other biological systems, and provides a general framework to incorporate protocol error rate (PE) in the analysis of deep sequencing data sets.
Results
Strand-specific RNA-seq of Arabidopsis roots
We generated replicate ssRNA-seq data from total RNA isolated from Arabidopsis whole roots (sample names: unWR1, unWR2, unWR3; generated from unsorted cells), mock-sorted whole roots (WR1, WR2, WR3), as well as cell populations enriched for two individual cell types: ENDO (ENDO1, ENDO2, ENDO3; generated from sorted cells) and CORT (CORT1, CORT2, CORT3; generated from sorted cells). All 12 libraries were made using a modified SOLiD Total RNA-Seq (Applied Biosystems) protocol. A linear and strand-specific amplification step was used for all 12 libraries except for the unWR1 sample (see Methods; Supplemental Fig. 1; for details of all libraries, see Supplemental Table 1). Approximately 120 million 50-bp reads (on average 10 million reads per library) were uniquely mapped to the Arabidopsis genome and transcriptome (Methods; Supplemental Table 2). We found our experimental method faithfully retains relative gene expression levels at the genome scale and provides high reproducibility of the gene expression levels compared with previous data using microarrays (Supplemental Methods).
We calculated the strand-specific protocol error rate (PE), which is defined as the fraction of reads mapping to the unexpected strand (Levin et al. 2010) of each annotated Arabidopsis gene. We found that our strand-specific protocol is highly specific (average PE for each library ranges from 2.4% to 3.5%) (Supplemental Table 1). As expected, the protocol is not perfectly strand-specific, and the PE varies across different libraries.
A statistical model to discover natural antisense transcripts
One simple way to identify antisense transcripts is to count the number of reads that map to the unexpected strand (denoted N0) (Fig. 1A). Due to the imperfect efficiency of protocols, ssRNA-seq usually produces a small number of reads from the unexpected strand. In most cases (Fig. 1A, e.g., gene 1), one can expect that N0 is small, which is due to the fact that most genes in the genome do not show significant antisense transcription. A high number of reads from the unexpected strand (i.e., a high N0) (Fig. 1A, gene 3) suggests potential antisense transcription. In the case of a cis-NAT pair, some of the unexpected reads could come from a nearby gene. For instance, a fraction of the unexpected reads found in gene 3 can be explained as coming from the extended 3′ UTR of gene 2 (Fig. 1A).
Figure 1.

Statistical framework for the identification of cis-NAT gene pairs. (A) Illustration showing read distribution for a strand-specific protocol. Reads that are mapped to the forward and reverse strands of the genome are colored in blue and red, respectively. (Blue arrows) Gene models (including UTRs). Summary statistics used in the comparisons are shown in the table. (N0) Number of reads from the unexpected strand. For gene 1 and gene 2, N0 equals the number of red reads that mapped within the annotated gene boundaries. For gene 3, N0 equals the number of blue reads that mapped within the annotated gene boundaries. (N1) Number of reads from the expected strand. (PE) Strand-specific protocol error rate. (Neg Count) Number of reads from the unexpected strand. (Neg RPKM) Read per kilobase per million reads (RPKM) for the reads from the unexpected strand. To calculate RPKM, all genes are assumed to be 2000 base pairs in length, and the library size is assumed to be one million reads. (Count Ratio) The ratio of N0 and N1. (Logistic Regression) Log probability was used to rank genes. (NASTI [BIC score]) The BIC score was used to rank genes. (B) Receiver operating characteristic (ROC) curves for the comparison of different classification methods. (FPR) False positive rate. (TRP) True positive rate. (Inset) The same curves with FPR between 0 and 0.2. (C) Area under the ROC curve (auROC) comparison of different methods. For both logistic regression and NASTI-seq, standard deviations of the auROC from 10-fold cross-validation are shown. (WR) Whole-root sample. (ENDO) Endodermis sample. (CORT) Cortex sample. Cross-validation is not available for simple methods (Neg Count, Neg RPKM, Count Ratio).
To account for the efficiency of strand-specific protocols, our method (NASTI-seq) models the probability of seeing unexpected reads using a binomial distribution and identifies cis-NATs under a model comparison framework. Our method takes two consecutive steps. First, we calculate a score (NASTI score) based on Bayesian information criterion (BIC), which represents the evidence of antisense transcription for each locus in the genome. In the second step, we identify candidate cis-NAT pairs that have small intergenic distances and are on opposite strands in the genome. The NASTI scores of the two genes in each candidate pair are combined into one score, which is used to identify cis-NAT pairs. The threshold applied to the combined score is determined using training data. A detailed description of the statistical method is provided in Supplemental Methods.
To evaluate the performance of NASTI-seq, we performed 10-fold cross-validation. cis-NAT pairs supported by existing annotations (Wang et al. 2005) were used as a positive training set and gene pairs that are unlikely to form natural antisense pairs were used as a negative training set (Methods; Supplemental Table 3). We first tested NASTI-seq on the whole-root sample (WR1-3), and we found that the performance was remarkably high, with an average area under the receiver operating characteristic (ROC) curve (auROC) of 0.974 (Fig. 1B,C). We then compared NASTI-seq with several recently published methods using read counts or ratios (negCount or Count Ratio) (Fig. 1A). The negCount method is equivalent to the decision rules based on read count (Klostermeier et al. 2011); Count Ratio (Ni et al. 2010) and an equivalent method of Count Ratio (Passalacqua et al. 2012) have been used to identify antisense transcription. Both negCount and Count Ratio used in our comparison are more flexible compared with their original description because the thresholds are determined by the training data. Additionally, reads per kilobase per million of unexpected reads (negRPKM) were also calculated and were used to decide cis-NAT pairs. To compare NASTI-seq to a more elaborate statistical model, we trained a logistic regression model using the expected read counts and unexpected read counts as features to predict cis-NAT pairs (Supplemental Methods). The logistic regression performs better than the count- or ratio-based methods, but did not perform as well as NASTI-seq (Fig. 1B,C).
Our training sets were derived from analysis of an EST database, which is enriched with ubiquitously and highly expressed genes. We would expect that cell-type–specific cis-NATs are less likely to be represented in the training set. However, we found that the auROC value of the WR library is indistinguishable from that of the ENDO and CORT libraries, suggesting that the power of our method is not affected by the type of biological sample used (Fig. 1C). The performance of the statistical methods for RNA-seq data may be affected by the sequencing depth (Tarazona et al. 2011). To evaluate this effect, we performed subsampling experiments (Ramskold et al. 2009). We found that the number of NAT pairs identified by our approach starts to plateau at 15 million reads (three replicates with 5 million reads in each replicate) (Supplemental Fig. 2). Overall, these results show that NASTI-seq is very accurate and performs consistently better than the other methods tested.
NASTI-seq identifies hundreds of new cis-NAT pairs
For each biological sample, we selected a threshold in the combined BIC score such that the false-discovery rate (FDR) was below 0.05, and identified cis-NAT pairs across all genes in the genome. In all three samples, we were able to validate approximately 600 cis-NAT pairs, accounting for ∼80% of gene pairs from the positive training sets (Fig. 2A, positive training). In each sample, we found more than 600 additional gene pairs supported by the current Arabidopsis genome annotation (Fig. 2A, TAIR10), demonstrating the effectiveness of the NASTI-seq algorithm. More importantly, in each sample we identified over 500 cis-NAT pairs involving known genes that are not currently annotated as overlapping (Fig. 2A, novel). Finally, we also identified over 400 “orphan” genes in each sample, i.e., individual known genes that do not have a candidate partner gene annotated within 500 bp. These “orphan genes” may be due to the misalignment of ESTs during genome annotation or due to incomplete annotations of the loci (see Discussion; Supplemental Fig. 3A).
Figure 2.

Types of newly identified cis-NAT pairs and their tissue distribution. (A) Numbers of cis-NAT gene pairs from the training set, TAIR10 annotation, and novel predictions are plotted and color-coded according to sample types. cis-NAT gene pairs from the training set and from TAIR10 annotation are combined as known cis-NAT pairs. (B) Distribution of known cis-NAT pairs in different samples. (C) Distribution of novel cis-NAT pairs in different samples.
Next, we analyzed the tissue distribution of cis-NAT pairs identified by the NASTI-seq algorithm. The cis-NAT pairs from the training set and the pairs that are supported by TAIR10 were combined as “known cis-NAT pairs” (Fig. 2B). Other cis-NAT pairs identified by NASTI-seq were denoted as “novel cis-NAT pairs” (Fig. 2C). We found 1490 known cis-NAT pairs across all samples, with >73% (1085) of these pairs identified in each of the three samples. This large number of known cis-NATs that are common among all samples is not surprising as the existing annotation is largely based on cDNA and EST evidence derived primarily from whole roots or whole seedlings. Among the known cis-NAT pairs (Fig. 2B), 85.1% of the pairs are formed by overlapping 3′ ends of two transcripts, whereas 6.5% of pairs are formed by overlapping 5′ ends. There are also 8.4% of the pairs formed by complete inclusion of one transcript in another transcript. Of the 918 novel cis-NAT pairs identified across all three samples, only 31% (288 pairs) were found in all three samples, suggesting potential cell-type–specific regulation of cis-NAT pairs in Arabidopsis (Fig. 2C). Among the novel cis-NAT pairs, 91.1% are formed by overlapping 3′ ends, and 8.9% of the pairs are formed by overlapping 5′ ends. We did not find any novel transcript pair in which one transcript is located within the other transcript. However, the read distribution in some of the orphan antisense genes suggests that some of these loci annotated with a single gene may in fact contain a pair of antisense transcripts of which one transcript is completely embedded within another transcript.
Genomic evidence supports the set of novel cis-NAT pairs
Because the majority of known natural antisense pairs was found to have overlapping 3′ ends (Jen et al. 2005), it is possible that one gene in a newly identified cis-NAT pair is utilizing an alternative polyadenylation site located in the transcribed region of the other gene. To test this hypothesis, we analyzed recently published polyA-seq data from Arabidopsis seeds and leaves (Wu et al. 2011). For each novel cis-NAT pair (Fig. 2C) that has potentially overlapping 3′ ends, we examined whether a polyA cluster (PAC) on the same strand of one gene is actually located in the annotated region of the other gene, thus supporting an overlapping gene pair. We found that, in each sample type, >80% of the novel cis-NAT pairs are supported by one or more PACs (Table 1A). We contrasted these findings with distribution of PACs in known cis-NAT pairs and a negative control set of gene pairs that are not predicted as cis-NATs by the NASTI-seq algorithm. The negative control set (see Supplemental Table 3) was required to have the same genomic features as the novel cis-NAT pairs; i.e., the intergenic region between genes in each pair was <500 bp, and genes in each pair were located on opposite strands. Less than 60% of the negative control pairs were found to harbor PACs in the antisense genes, while close to 90% of known cis-NAT pairs were supported by PACs (Table 1A),. For gene pairs that contain antisense PACs, we also analyzed the expression levels of the PACs as measured by reads per million (RPM) (Supplemental Fig. 4). In all samples, we found that the average RPM of antisense PACs for the novel cis-NAT pairs and the known cis-NAT pairs were both higher than that of the negative controls (P < 0.01, Wilcoxon test), suggesting a quantitative difference in the PAC signals.
Table 1.
PolyA statistics for cis-NAT pairs and control pairs
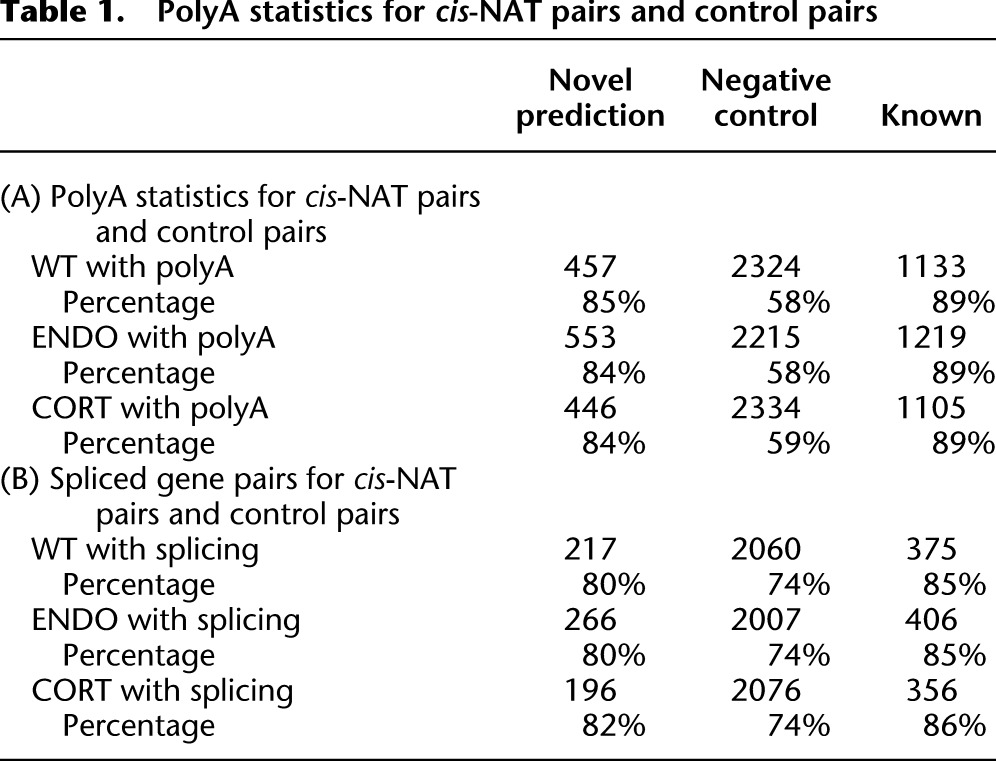
cis-NAT pairs have been implicated in the process of mRNA splicing in both plants and mammals (Chen et al. 2005; Jen et al. 2005; Morrissy et al. 2011). In Arabidopsis, genes with multiple exons are more likely to be found in cis-NAT pairs than randomly selected gene pairs. We asked whether the same trend is found in the newly identified cis-NAT pairs (Table 1B). More multi-exon genes were found in the known cis-NAT pairs than in the control pairs, confirming previous observations. We also found that the novel cis-NAT pairs contain more multi-exon genes than the control pairs (P < 1 × 10⁻⁵, for each of the three samples, χ2 test). In humans, NATs tend to have slightly shorter introns. For each pair of NATs, we designated the gene that has higher expression (as measured by RPKM) as the major gene, and the other gene as the minor gene. We calculated the intron length distribution of major and minor genes in all the cis-NAT pairs identified in our analysis (see Methods) and found a small but significant trend for minor genes to have shorter introns compared with control genes.
To experimentally validate novel cis-NATs, we carried out RT-PCR on five pairs of novel natural antisense genes (Fig. 3; Supplemental Fig. 5). For instance, AT2G46020 and AT2G46030 are predicted as cis-NAT pairs by NASTI-seq. The two genes are encoded on the opposite strands of genomic DNA but are not annotated as overlapping in their 3′ UTR (see gene models in Fig. 3B). For each whole-root sample (WR1, WR2 and WR3), we plotted the cumulative frequency of reads from the forward strand (Fig. 3A,B, dashed lines) and from the reverse strand (Fig. 3A,B, solid lines). The prediction of the NASTI-seq algorithm is supported by the cumulative distribution of reads, with the 3′ UTRs of the two genes overlapping in a 1.5-kb region (Fig. 3B). The overlapping transcripts were further validated using gene-specific primers (L1, R1 for AT2G46020 and L2, R2 for AT2G46030) (Fig. 3C). All five pairs of novel natural antisense genes were successfully validated (Supplemental Fig. 5).
Figure 3.

Experimental validation of novel predicted cis-NAT pairs. (A) Cumulative distribution of reads adjacent to the overlapping region of AT2G46020 and AT2G46030. (x-axis) Genomic location of chromosome 2 of Arabidopsis. Reads from different biological replicates are in different colors. (Solid lines) Cumulative percentage of reads that are mapped to the reverse strand. (Dashed lines) One minus cumulative percentage of reads that are mapped to forward strand. (B) Same as A, except that the cumulative distribution curves <3% are shown. Gene models are shown below the distribution curves. Arrow heads indicate the direction of the genes. Thick lines represent the exons; thin lines between thicker lines are introns. The locations of primer pairs (L1/R1 and L2/R2) are shown as black arrows. (C) Reverse transcription (RT)-PCR validation of the predicted overlapping genes. No RT reaction was used as negative control. Genomic DNA (gDNA) was used as positive control.
cis-NAT pairs display unique expression patterns and cell-type–specific expression
One advantage of the proposed statistical model is that the true gene expression levels of natural antisense pairs can be estimated by statistically un-mixing sense and antisense read count data (Methods). We hypothesized that this would improve the correlation of the gene expression levels between biological replicates. Using genes that are predicted to form natural antisense pairs, we calculated the pairwise Pearson correlation coefficient (PCC) between biological replicates. Only cis-NAT pairs were used to calculate PCC in this analysis, since the expression of genes that do not form cis-NAT pairs will not be changed by the statistical unmixing method. To evaluate the overall improvement, we calculated R2 of multiple linear regressions using one replicate as response and two other replicates as predictors. We found in two of three biological samples, R2 improved after adjustment for antisense reads, suggesting that our approach improves the accuracy of the expression estimation for cis-NAT genes (Fig. 4).
Figure 4.

Expression quantification of cis-NAT genes. (A) Scatter plot of gene expression levels of cis-NAT genes before and after adjustment for the protocol error rate. (PCC) Pearson correlation coefficient. (B) R2 of the multiple linear regressions between three biological replicates for each sample. This R2 is the multivariate equivalent of the R2 for simple pairwise comparison.
To further characterize the expression pattern of natural antisense genes, we compared the expression levels of cis-NAT pairs to genes that are not predicted to form cis-NAT pairs. For each pair of genes, we designated a major gene and a minor gene based on their expression levels. We calculated the fraction of the minor gene expression (Ψ) as the ratio of the minor gene expression level to the sum of the expression levels of both major and minor genes (Methods). More genes in the known and novel cis-NAT pairs have smaller Ψ compared with the gene pairs in the complete negative training set and with the gene pairs in the negative control (Fig. 5), and results were qualitatively similar for the two cell-type–specific samples (Supplemental Fig. 6). We also found that 42% of gene pairs in the negative training set and 18% of gene pairs in the negative control set have Ψ ≃ 0.5 (Fig. 5), which suggests that both genes in a pair are expressed at similar levels. Overall, the similarity of the cumulative frequency of Ψ between known cis-NAT pairs and predicted cis-NAT pairs supports the hypothesis that the novel cis-NAT pairs are true cis-NAT pairs.
Figure 5.

Cumulative frequency of minor gene fraction (Ψ). Numbers next to the green and blue curve show the percentage of gene pairs with Ψ less than 0.5.
Because ENDO and CORT are two cell types derived from the same stem cell precursor, these two samples provide an ideal model to study cell-type–specific expression of cis-NAT pairs. We searched for cis-NAT pairs that display opposite expression levels in these two cell types; i.e., the minor gene expression fraction changes from above 0.5 in one cell type to below 0.5 in another cell type. For instance, AT1G07250, a UDP-glucosyl transferase, and AT1G07260, a GTP binding protein, are predicted to form cis-NAT pairs. The cumulative distributions of the reads from the expected strand of both AT1G07250 and AT1G07260 are clearly overlapping in the CORT samples, but less overlap is evident in the ENDO samples (Fig. 6A). Intriguingly, AT1G07260 is expressed significantly lower in CORT samples than in ENDO samples, implying that cis-NATs may be regulating gene expression levels of AT1G07260. Overall, we identified 152 pairs of known cis-NATs (Supplemental Table 4) and 57 pairs of novel cis-NATs (Supplemental Table 5) that display opposite expression levels in the two cell types.
Figure 6.

Example of cell-type–specific expression of cis-NAT pairs. (A) Cumulative distribution of reads from the predicted cis-NAT pair of AT1G07250 and AT1G07260. The two annotated genes have an intergenic distance of 60 bp. Expression from cortex (CORT) and endodermis (ENDO) samples are both shown. The cumulative distributions show a visible overlapping between two genes in the CORT sample but not in the ENDO sample. (B) Gene expression levels of the two genes in two cell types. Bar plot shows the RPKM ± SEs of three biological replicates.
A functional analysis reveals chromatin signatures of cis-NAT pairs
Epigenetic modification of chromatin states has been implicated in the regulatory role of cis-NAT pairs in mammals (Conley and Jordan 2012; Magistri et al. 2012) and in plants (Luo et al. 2013; Zhan and Lukens 2013). To characterize the relationship between the chromatin marks and cis-NAT pairs in plants, we examined recently published genome-wide epigenetic profiles of two chromatin marks representing activation and repression, H3K4me3 and H3K27me3, in Arabidopsis roots (Roudier et al. 2011). We calculated the average enrichment levels for H3K4me3 and H3K27me3 in the proximal region of the transcription start sites (±1000 bp) for all major and minor genes in three sets of gene pairs: the predicted cis-NAT pairs, the known cis-NAT pairs, and the negative control pairs (Supplemental Table 3). Because genes that are not expressed tend to lack both H3K4me3 and H3K27me3 chromatin marks (see Discussion), we analyzed the chromatin marks for gene pairs that are expressed (RPKM > 0.01) in all three biological samples (WR, ENDO, and CORT). cis-NAT pairs that are inversely expressed between ENDO and CORT samples were excluded because these pairs may have different chromatin marks in different cell types. In all three sets of gene pairs, H3K4me3 marks peak right after the transcription start sites, consistent with the known genomic distribution of H3K4me3 (Zhang et al. 2009). Both known cis-NAT genes and predicted cis-NAT genes show preferential depletion of the activation chromatin mark, H3K4me3, just upstream of the transcription start site of the major gene (Fig. 7, left). This result is consistent with a recent finding that the antisense gene can affect the epigenetic marks of the 5′ end and the promoter region of the sense gene, even though the antisense transcript does not extend to the 5′ end of the sense gene (Modarresi et al. 2012). The cumulative distribution of the expression of major genes in all three sets of gene pairs is near identical (Supplemental Fig. 7A), suggesting that the observed difference in chromatin mark density is not due to differences in gene expression levels. In contrast, the H3K4me3 peak of the minor gene is higher in the negative control gene pairs than both the predicted cis-NAT pairs and known cis-NAT pairs (Fig. 7, right). This can be explained as the expression levels of the minor gene tend to be higher in the control gene pairs than both the predicted cis-NAT pairs and known cis-NAT pairs (Supplemental Fig. 7B). In contrast to the activation mark, we did not find differences in the density of H3K27me3, a repression mark, in the three sets of gene pairs analyzed (Supplemental Fig. 7C,D). Overall, these observations support a unique chromatin signature of the activation mark, H3K4me3, in the cis-NAT gene pairs in plants.
Figure 7.

Distribution of activating chromatin mark. The distribution of H3K4me3 around the transcription start sites of major and minor genes in predicted cis-NAT pairs, known cis-NAT pairs, and negative control pairs.
Many small RNAs are mapped to cis-NAT pairs
Natural antisense genes have been shown to generate siRNAs that regulate downstream gene expression under stress conditions in plants (Borsani et al. 2005). To study the potential of cis-NAT mediated siRNA (nat-siRNA) formation, we analyzed small RNA libraries from the same cell types (Breakfield et al. 2012). We searched for small RNA reads that map to the genomic regions of both newly discovered and known natural antisense RNAs (aRNAs). We found 85 cis-NAT pairs in the whole-root sample, 93 pairs in the CORT sample, and 43 pairs in the ENDO sample that generate small RNA reads at a rate of at least 10 RPM (Supplemental Table 6). Using the same threshold, a comparable number of nat-siRNAs was identified in Arabidopsis seedlings under biotic and abiotic stress conditions (Zhang et al. 2012), suggesting the fraction of cis-NATs that induce siRNA is relatively similar across conditions. As reported, both 21-bp and 24-bp small RNAs are mapped to cis-NAT pairs (Zhang et al. 2012). However, only a small fraction of these nat-siRNAs are overlapping between this study and the published study under stress conditions, suggesting differential regulation of nat-siRNA during development and under stress conditions.
Discussion
Using new strand-specific RNA-seq data and a statistical model, we have identified an additional 918 cis-NAT pairs in the annotated Arabidopsis genes. This significantly increased number of cis-NATs is due to the power of the NASTI-seq model, which accounts for biological variability, library size variations, and the strand specificity of the RNA-seq protocol. The statistical model not only performs better than simple count-based or ratio-based methods but also outperforms the widely used logistic regression model, indicating the importance of tailoring the statistical model to the specific protocols. Several types of independent genomic evidence support the predicted cis-NAT pairs. For instance, more antisense PACs and multi-exon genes were found in both novel cis-NAT pairs and known cis-NAT pairs than in negative control pairs, indicating that genomic features of the novel cis-NAT pairs are consistent with known cis-NAT pairs. However, these genomic features alone are not sufficient to accurately predict cis-NAT pairs. For example, >50% of genes that do not form cis-NAT pairs also contain antisense PACs. Because the PACs (Wu et al. 2011) were identified by extensively sequencing polyA tags from whole leaf and seeds—organs that contain many cell types—many subtle polyA signals are expected to be identified at low abundance. Indeed, the average expression levels (RPM) for the polyA signals in the non-cis-NAT pairs are smaller than the average RPM of the predicted cis-NAT pairs and the known cis-NAT pairs (Supplemental Fig. 4), suggesting the PACs found in non-cis-NAT pairs may represent rare events. Direct sequencing of polyadenylated RNA using novel instruments may provide an alternative method to identify new polyA signals that play a role in the formation of cis-NATs (Sherstnev et al. 2012).
The high performance of NASTI-seq is due to the incorporation of the strand-specific efficiency, an important feature that is not explicitly modeled by any other published methods. The efficiency of biochemical assays is a well-known problem in high-throughput experiments. For instance, bisulfite sequencing is a protocol for analyzing DNA methylation. The C-to-T conversion caused by bisulfite treatment can vary depending on the sample and protocol (Bock et al. 2010). PAR-CLIP, a protocol for identifying RNA-binding protein specificity, also shows site dependent T-to-C conversion (Hafner et al. 2010). Our statistical framework can be easily applied to model the efficiency in any RNA-seq protocol to help improve the accuracy of existing methods.
Approximately 4% of cis-NAT pairs in each sample can potentially generate nat-siRNAs with expression levels above 10 RPM. At a less stringent cutoff of 1 RPM, 40% of cis-NAT pairs in each sample coincide with small RNAs. Among the 4% nat-siRNAs that passed the stringent threshold, the distribution of small RNA reads along the cis-NAT pairs varies from case to case. In some cases, the reads mapped exclusively and evenly to one gene in a pair of cis-NATs (Supplemental Fig. 8A), consistent with the model that one gene induces the degradation of the other gene. In other cases, the reads clustered to a small region, usually at the extreme end of one gene model (Supplemental Fig. 8B), consistent with a model of stalled Pol II polymerase, which generates small RNAs at the 5′ end of the target gene (Core et al. 2008). There are six cis-NAT pairs where the nat-siRNAs were also predicted as microRNAs (Breakfield et al. 2012), suggesting that some microRNA genes are part of cis-NAT pairs. The heterogeneity in the read distribution of the small RNAs suggests different underlying mechanisms that generate the observed small RNA reads. Further computational and experimental analyses are required to establish these yet unknown mechanisms and to identify true nat-siRNAs in plants.
By using NASTI-seq, we identified more than 500 orphan antisense transcripts, i.e., those without nearby candidate genes to form cis-NAT pairs. We found at least two types of orphan antisense transcript. Some appear to be misannotations of the gene orientation: >95% of reads map to the unexpected strand along the whole-gene model (Supplemental Fig. 3B) and may be due to EST-based annotations in which ESTs aligned to the reverse strand. The more interesting orphan genes are those that have sense reads or antisense reads mapped to different segments of an annotated gene model, such as cases in which the sense reads clustered together on one side of the annotation, whereas the antisense reads clustered on the other side (Supplemental Fig. 3C). These genes are consistent with a model of a cis-NAT pair, except that the antisense gene is not yet annotated. In such cases, more evidence from sequence data or from gene predictors of noncoding genes is required to further support the cis-NAT pair.
Connections between chromatin modifications and cis-NAT pairs have been observed in mammals (Modarresi et al. 2012) and in plants (Luo et al. 2013; Zhan and Lukens 2013). Chromatin modification data from plant ChIP-chip has previously been summarized at the gene level; e.g., a chromatin mark is based on signals of all probes in that gene (Roudier et al. 2011). While the gene level summary is useful in differentiating genes into groups with predominant chromatin states, the interpretation of cis-NAT pairs is confounded by the closeness of genes in each pair and the gene expression levels. By carefully using genes with matching expression distributions as controls (Supplemental Fig. 7A), we found a depleted H3K4me3 distribution around the transcription start site of the major genes in cis-NAT pairs (Fig. 7), suggesting a signature for cis-NAT genes in Arabidopsis roots. Further experimental analysis using targeted knockdown of one gene in a cis-NAT pair may provide new insights into a mechanistic model of the inter-regulation of cis-NAT pairs and chromatin marks.
In conclusion, our methods demonstrated the power of combining strand-specific RNA-seq, cell-type–specific gene expression, and statistical modeling to discover novel cis-NAT pairs. We increased the known cis-NAT pairs in Arabidopsis by >60% and found many cis-NAT pairs for which the expression levels of the two genes in a pair switch between cell types, providing an important resource for further functional validation of cis-NAT pairs in Arabidopsis. Our statistical framework is general; it can be applied to any strand-specific protocol to facilitate the identification of natural antisense transcription in many biological systems.
Methods
Strand-specific RNA-seq protocol
The A. thaliana Columbia-0 ecotype was used for the WR libraries. All seeds were sterilized with 50% bleach and 0.1% Tween for 7 min and rinsed five times in sterile water. Seeds were then plated on sterile mesh on 1 × MS agar with 1% sucrose. Plates were vernalized 48 h at 4°C and grown under standard conditions for 6 d. For the whole-root unamplified library, roots were harvested from the plates and frozen on dry ice. Total RNA was extracted using the RNeasy Mini Kit (Qiagen) according to the manufacturer's instructions. Poly-adenylated (Poly-A) mRNA was isolated from the total RNA sample by Dynabeads Oligo (dT) (Invitrogen).
Fluorescence activated cell-sorting was used to isolate GFP-marked cell populations to enrich for cells in the ENDO and CORT. The same protocol was used to mock sort all of the cells (WR) according to the method described previously (Birnbaum et al. 2003). Three biological replicates of the two cell-type–specific (ENDO and CORT) and the mock sorted samples were isolated. Total RNA was extracted using the RNeasy Micro Kit (Qiagen). T7-RNA polymerase-mediated amplification was used to generate aRNA and preserve strand specificity using the TargetAmp 1-Round aRNA Amplification kit (Epicentre/Illumina). To assess the amplification protocol, we prepared total RNA from whole roots. Ten micrograms of this RNA was used to prepare one library (unWR1) with poly-A selected mRNA using the standard protocol. The same total RNA was diluted as input for two libraries that were amplified from 10 ng (unWR2) and 100 ng (unWR3) of total RNA. All three mock-sorted samples and the ENDO and CORT samples were amplified using the same protocol.
All samples were treated with Tabacco Acid Phosphatase (Epicentre/Illumina) to remove 5′ caps of the WR mRNA and to remove the triphosphate from the amplified RNA. Products were purified and used as input for the fragmentation reaction using the SOLiD Total RNA-Seq Kit (Applied Biosystems). Libraries were constructed according to the manufacturer's protocol; fragmentation was assessed by Bioanalyzer Chip (Agilent). Libraries were sequenced on the SOLiD 4 platform.
Read alignment and quality assessment
Read alignment was carried out using TopHat 1.4.0 (Trapnell et al. 2009) with default parameters, except the parameter for the maximal intron length is set to 2000 bp (99% of the known Arabidopsis introns are shorter than this threshold). From 4%–10% of reads were aligned to more than one location (Supplemental Table 2), most of which were found to be aligned to two duplicated rRNA loci in chromosome 2 and chromosome 3. Because the dual aligned reads fall in very specific loci, the effect of multiple aligned read on the quantification of other genes is minimal. We choose to use only reads that are uniquely aligned to a single location in our analysis. For the initial analysis (Results section one, ssRNA-seq of Arabidopsis roots), gene expression levels were summarized using Cufflinks (Trapnell et al. 2010) with the TAIR10 GTF file. For other analyses that involve cis-NATs, read counts were obtained using R scripts with rsamtools package (http://bioconductor.org/packages/release/bioc/html/Rsamtools.html), and RPKM were calculated using customized R script. For genes with multiple isoforms, the expression levels were calculated using the length of the longest isoform.
Statistical model of antisense transcription
We employ a model comparison framework to identify cis-NAT pairs. We denote the number of mapped reads in replicates i, locus j, and strand k as Nijk, where i = 1…I, j = 1…J, and k = 0 or 1. We use k = 0 to indicate that the reads are mapped to the expected strand, whereas k = 1 indicates the reads are mapped to the unexpected strand. We denote the  as the total number of reads mapped to locus j. For each locus in the genome, we first calculate the probability of the observed data under a sense only model (M0), assuming only the sense gene is expressed at this Φlocus.
In Equation 1, the total read count is modeled by a negative binomial distribution (NB), and the number of reads from the unexpected strand is modeled by a binomial distribution (B). pei denotes PE and is estimated from all genes in the genome. The parameters ( ) of negative binomial distribution are estimated in the same way as in DESeq (Anders and Huber 2010).
When a pair of antisense genes is transcribed in one locus, all the reads that map to the sense strand are generated from two sources. Some of the sense reads are from the sense strand gene; others are from the antisense strand gene but map to the sense strand due to the imperfect protocol efficiency. We introduce Nijks to denote the unobserved true read counts, with s as an indicator variable for the strand of the underlying gene that generates the read counts. If the read counts are from the sense strand gene, then s equals zero, otherwise, s equals one. The full calculation of the conditional probability of the observed data given the antisense model requires integrating over all the possible values of the missing data. To reduce the computational complexity, we choose to approximate the probability of the observed data under an antisense model using maximum likelihood estimation of the missing data (Equation 2; for details of the model, see Supplemental Method):
We find parameters that maximize the posterior probability of data given each model separately and then calculate the NASTI score (similar to a BIC).
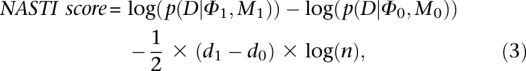 |
where d1 and d0 represent the number of free parameters in Φ1 and Φ0, and n is the sample size.
The model was first trained on data from all genes to calculate the NASTI score for each gene, and then the maximum of both scores for each pair of genes was used as a score to classify positive training pairs against the negative training pairs (for details, see Supplemental Method). Ten-fold cross validation was carried out, and the model was evaluated by an ROC curve (Fig. 1B) and auROC (Fig. 1C).
Epigenetic data and small RNA data
The epigenetic profiles of all Arabidopsis genes were obtained from Roudier et al. (2011). Only data from the full genome tiling array was used for this analysis. ChIP-chip data were downloaded from the GEO database (http://www.ncbi.nlm.nih.gov/geo/, accession GSE24710). For each set of genes, the log2 ratio of IP over input signals was averaged in each of 100-bp nonoverlapping windows upstream of and downstream from annotated transcription start sites. Small RNA alignment was carried out according to the method previously described (Breakfield et al. 2012). Four biological replicates of whole-root samples and two biological replicates of each of the ENDO and the CORT samples were used. Reads from biological replicates were pooled and only reads that aligned with no mismatches were used in the analysis.
Data access
The raw data files have been deposited at the NCBI Sequence Read Archive (SRA; http://www.ncbi.nlm.nih.gov/sra) under accession number SRA057956. The predicted cis-NAT pairs can be found in Supplemental Table 8. The NASTI-seq software can be found at http://www.genome.duke.edu/labs/ohler/research/NASTIseq/.
Acknowledgments
We thank Molly Megraw for contributing RNA samples and for her comments on the manuscript. We thank the Benfey laboratory for comments on the manuscript. We thank Lisa Bukovnik and Xiaoxia Qing at the Institute for Genome Science and Policy Core Sequencing Facility for sequencing the libraries. This work was funded by a grant to P.N.B. and U.O. from the NSF Arabidopsis 2010 project (IOS-1021619).
Footnotes
[Supplemental material is available for this article.]
Article published online before print. Article, supplemental material, and publication date are at http://www.genome.org/cgi/doi/10.1101/gr.149310.112.
References
- Anders S, Huber W 2010. Differential expression analysis for sequence count data. Genome Biol 11: R106. [DOI] [PMC free article] [PubMed] [Google Scholar]
- Birnbaum K, Shasha DE, Wang JY, Jung JW, Lambert GM, Galbraith DW, Benfey PN 2003. A gene expression map of the Arabidopsis root. Science 302: 1956–1960 [DOI] [PubMed] [Google Scholar]
- Bock C, Tomazou EM, Brinkman AB, Muller F, Simmer F, Gu H, Jager N, Gnirke A, Stunnenberg HG, Meissner A 2010. Quantitative comparison of genome-wide DNA methylation mapping technologies. Nat Biotechnol 28: 1106–1114 [DOI] [PMC free article] [PubMed] [Google Scholar]
- Borsani O, Zhu J, Verslues PE, Sunkar R, Zhu JK 2005. Endogenous siRNAs derived from a pair of natural cis-antisense transcripts regulate salt tolerance in Arabidopsis. Cell 123: 1279–1291 [DOI] [PMC free article] [PubMed] [Google Scholar]
- Brady SM, Orlando DA, Lee JY, Wang JY, Koch J, Dinneny JR, Mace D, Ohler U, Benfey PN 2007. A high-resolution root spatiotemporal map reveals dominant expression patterns. Science 318: 801–806 [DOI] [PubMed] [Google Scholar]
- Breakfield NW, Corcoran DL, Petricka JJ, Shen J, Sae-Seaw J, Rubio-Somoza I, Weigel D, Ohler U, Benfey PN 2012. High-resolution experimental and computational profiling of tissue-specific known and novel miRNAs in Arabidopsis. Genome Res 22: 163–176 [DOI] [PMC free article] [PubMed] [Google Scholar]
- Bullard JH, Purdom E, Hansen KD, Dudoit S 2010. Evaluation of statistical methods for normalization and differential expression in mRNA-Seq experiments. BMC Bioinformatics 11: 94. [DOI] [PMC free article] [PubMed] [Google Scholar]
- Carrieri C, Cimatti L, Biagioli M, Beugnet A, Zucchelli S, Fedele S, Pesce E, Ferrer I, Collavin L, Santoro C, et al. 2012. Long non-coding antisense RNA controls Uchl1 translation through an embedded SINEB2 repeat. Nature 491: 454–457 [DOI] [PubMed] [Google Scholar]
- Chen J, Sun M, Hurst LD, Carmichael GG, Rowley JD 2005. Human antisense genes have unusually short introns: Evidence for selection for rapid transcription. Trends Genet 21: 203–207 [DOI] [PubMed] [Google Scholar]
- Chen D, Yuan C, Zhang J, Zhang Z, Bai L, Meng Y, Chen LL, Chen M 2012. PlantNATsDB: A comprehensive database of plant natural antisense transcripts. Nucleic Acids Res 40: D1187–D1193 [DOI] [PMC free article] [PubMed] [Google Scholar]
- Conley AB, Jordan IK 2012. Epigenetic regulation of human cis-natural antisense transcripts. Nucleic Acids Res 40: 1438–1445 [DOI] [PMC free article] [PubMed] [Google Scholar]
- Core LJ, Waterfall JJ, Lis JT 2008. Nascent RNA sequencing reveals widespread pausing and divergent initiation at human promoters. Science 322: 1845–1848 [DOI] [PMC free article] [PubMed] [Google Scholar]
- Faghihi MA, Wahlestedt C 2009. Regulatory roles of natural antisense transcripts. Nat Rev Mol Cell Biol 10: 637–643 [DOI] [PMC free article] [PubMed] [Google Scholar]
- Faghihi MA, Modarresi F, Khalil AM, Wood DE, Sahagan BG, Morgan TE, Finch CE, St Laurent G 3rd, Kenny PJ, Wahlestedt C 2008. Expression of a noncoding RNA is elevated in Alzheimer's disease and drives rapid feed-forward regulation of β-secretase. Nat Med 14: 723–730 [DOI] [PMC free article] [PubMed] [Google Scholar]
- Ge X, Rubinstein WS, Jung YC, Wu Q 2008. Genome-wide analysis of antisense transcription with Affymetrix exon array. BMC Genomics 9: 27. [DOI] [PMC free article] [PubMed] [Google Scholar]
- Glaus P, Honkela A, Rattray M 2012. Identifying differentially expressed transcripts from RNA-seq data with biological variation. Bioinformatics 28: 1721–1728 [DOI] [PMC free article] [PubMed] [Google Scholar]
- Hafner M, Landthaler M, Burger L, Khorshid M, Hausser J, Berninger P, Rothballer A, Ascano M Jr, Jungkamp AC, Munschauer M, et al. 2010. Transcriptome-wide identification of RNA-binding protein and microRNA target sites by PAR-CLIP. Cell 141: 129–141 [DOI] [PMC free article] [PubMed] [Google Scholar]
- Henz SR, Cumbie JS, Kasschau KD, Lohmann JU, Carrington JC, Weigel D, Schmid M 2007. Distinct expression patterns of natural antisense transcripts in Arabidopsis. Plant Physiol 144: 1247–1255 [DOI] [PMC free article] [PubMed] [Google Scholar]
- Jen CH, Michalopoulos I, Westhead DR, Meyer P 2005. Natural antisense transcripts with coding capacity in Arabidopsis may have a regulatory role that is not linked to double-stranded RNA degradation. Genome Biol 6: R51. [DOI] [PMC free article] [PubMed] [Google Scholar]
- Jin H, Vacic V, Girke T, Lonardi S, Zhu JK 2008. Small RNAs and the regulation of cis-natural antisense transcripts in Arabidopsis. BMC Mol Biol 9: 6. [DOI] [PMC free article] [PubMed] [Google Scholar]
- Klostermeier UC, Barann M, Wittig M, Hasler R, Franke A, Gavrilova O, Kreck B, Sina C, Schilhabel MB, Schreiber S, et al. 2011. A tissue-specific landscape of sense/antisense transcription in the mouse intestine. BMC Genomics 12: 305. [DOI] [PMC free article] [PubMed] [Google Scholar]
- Lapidot M, Pilpel Y 2006. Genome-wide natural antisense transcription: Coupling its regulation to its different regulatory mechanisms. EMBO Rep 7: 1216–1222 [DOI] [PMC free article] [PubMed] [Google Scholar]
- Levin JZ, Yassour M, Adiconis X, Nusbaum C, Thompson DA, Friedman N, Gnirke A, Regev A 2010. Comprehensive comparative analysis of strand-specific RNA sequencing methods. Nat Methods 7: 709–715 [DOI] [PMC free article] [PubMed] [Google Scholar]
- Li B, Dewey CN 2011. RSEM: Accurate transcript quantification from RNA-Seq data with or without a reference genome. BMC Bioinformatics 12: 323. [DOI] [PMC free article] [PubMed] [Google Scholar]
- Li Q, Su Z, Xu X, Liu G, Song X, Wang R, Sui X, Liu T, Chang X, Huang D 2012. AS1DHRS4, a head-to-head natural antisense transcript, silences the DHRS4 gene cluster in cis and trans. Proc Natl Acad Sci 109: 14110–14115 [DOI] [PMC free article] [PubMed] [Google Scholar]
- Luo C, Sidote DJ, Zhang Y, Kerstetter RA, Michael TP, Lam E 2013. Integrative analysis of chromatin states in Arabidopsis identified potential regulatory mechanisms for natural antisense transcript production. Plant J 73: 77–90 [DOI] [PubMed] [Google Scholar]
- Magistri M, Faghihi MA, St Laurent G 3rd, Wahlestedt C 2012. Regulation of chromatin structure by long noncoding RNAs: Focus on natural antisense transcripts. Trends Genetics 28: 389–396 [DOI] [PMC free article] [PubMed] [Google Scholar]
- Modarresi F, Faghihi MA, Lopez-Toledano MA, Fatemi RP, Magistri M, Brothers SP, van der Brug MP, Wahlestedt C 2012. Inhibition of natural antisense transcripts in vivo results in gene-specific transcriptional upregulation. Nat Biotechnol 30: 453–459 [DOI] [PMC free article] [PubMed] [Google Scholar]
- Morris KV, Santoso S, Turner AM, Pastori C, Hawkins PG 2008. Bidirectional transcription directs both transcriptional gene activation and suppression in human cells. PLoS Genet 4: e1000258. [DOI] [PMC free article] [PubMed] [Google Scholar]
- Morrissy AS, Griffith M, Marra MA 2011. Extensive relationship between antisense transcription and alternative splicing in the human genome. Genome Res 21: 1203–1212 [DOI] [PMC free article] [PubMed] [Google Scholar]
- Mortazavi A, Williams BA, McCue K, Schaeffer L, Wold B 2008. Mapping and quantifying mammalian transcriptomes by RNA-Seq. Nat Methods 5: 621–628 [DOI] [PubMed] [Google Scholar]
- Ni T, Tu K, Wang Z, Song S, Wu H, Xie B, Scott KC, Grewal SI, Gao Y, Zhu J 2010. The prevalence and regulation of antisense transcripts in Schizosaccharomyces pombe. PLoS ONE 5: e15271. [DOI] [PMC free article] [PubMed] [Google Scholar]
- Pandey RR, Mondal T, Mohammad F, Enroth S, Redrup L, Komorowski J, Nagano T, Mancini-Dinardo D, Kanduri C 2008. Kcnq1ot1 antisense noncoding RNA mediates lineage-specific transcriptional silencing through chromatin-level regulation. Mol Cell 32: 232–246 [DOI] [PubMed] [Google Scholar]
- Parkhomchuk D, Borodina T, Amstislavskiy V, Banaru M, Hallen L, Krobitsch S, Lehrach H, Soldatov A 2009. Transcriptome analysis by strand-specific sequencing of complementary DNA. Nucleic Acids Res 37: e123. [DOI] [PMC free article] [PubMed] [Google Scholar]
- Pasquinelli AE 2012. MicroRNAs and their targets: Recognition, regulation and an emerging reciprocal relationship. Nat Rev Genet 13: 271–282 [DOI] [PubMed] [Google Scholar]
- Passalacqua KD, Varadarajan A, Weist C, Ondov BD, Byrd B, Read TD, Bergman NH 2012. Strand-specific RNA-seq reveals ordered patterns of sense and antisense transcription in Bacillus anthracis. PLoS ONE 7: e43350. [DOI] [PMC free article] [PubMed] [Google Scholar]
- Petricka JJ, Schauer MA, Megraw M, Breakfield NW, Thompson JW, Georgiev S, Soderblom EJ, Ohler U, Moseley MA, Grossniklaus U, et al. 2012. The protein expression landscape of the Arabidopsis root. Proc Natl Acad Sci 109: 6811–6818 [DOI] [PMC free article] [PubMed] [Google Scholar]
- Prescott EM, Proudfoot NJ 2002. Transcriptional collision between convergent genes in budding yeast. Proc Natl Acad Sci 99: 8796–8801 [DOI] [PMC free article] [PubMed] [Google Scholar]
- Ramskold D, Wang ET, Burge CB, Sandberg R 2009. An abundance of ubiquitously expressed genes revealed by tissue transcriptome sequence data. PLoS Comput Biol 5: e1000598. [DOI] [PMC free article] [PubMed] [Google Scholar]
- Rinn JL, Chang HY 2012. Genome regulation by long noncoding RNAs. Annu Rev Biochem 81: 145–166 [DOI] [PMC free article] [PubMed] [Google Scholar]
- Robinson MD, McCarthy DJ, Smyth GK 2010. edgeR: A Bioconductor package for differential expression analysis of digital gene expression data. Bioinformatics 26: 139–140 [DOI] [PMC free article] [PubMed] [Google Scholar]
- Ron M, Alandete Saez M, Eshed Williams L, Fletcher JC, McCormick S 2010. Proper regulation of a sperm-specific cis-nat-siRNA is essential for double fertilization in Arabidopsis. Genes Dev 24: 1010–1021 [DOI] [PMC free article] [PubMed] [Google Scholar]
- Roudier F, Ahmed I, Berard C, Sarazin A, Mary-Huard T, Cortijo S, Bouyer D, Caillieux E, Duvernois-Berthet E, Al-Shikhley L, et al. 2011. Integrative epigenomic mapping defines four main chromatin states in Arabidopsis. EMBO J 30: 1928–1938 [DOI] [PMC free article] [PubMed] [Google Scholar]
- Sherstnev A, Duc C, Cole C, Zacharaki V, Hornyik C, Ozsolak F, Milos PM, Barton GJ, Simpson GG 2012. Direct sequencing of Arabidopsis thaliana RNA reveals patterns of cleavage and polyadenylation. Nat Struct Mol Biol 19: 845–852 [DOI] [PMC free article] [PubMed] [Google Scholar]
- Sun M, Hurst LD, Carmichael GG, Chen J 2006. Evidence for variation in abundance of antisense transcripts between multicellular animals but no relationship between antisense transcription and organismic complexity. Genome Res 16: 922–933 [DOI] [PMC free article] [PubMed] [Google Scholar]
- Tarazona S, Garcia-Alcalde F, Dopazo J, Ferrer A, Conesa A 2011. Differential expression in RNA-seq: A matter of depth. Genome Res 21: 2213–2223 [DOI] [PMC free article] [PubMed] [Google Scholar]
- Trapnell C, Pachter L, Salzberg SL 2009. TopHat: Discovering splice junctions with RNA-Seq. Bioinformatics 25: 1105–1111 [DOI] [PMC free article] [PubMed] [Google Scholar]
- Trapnell C, Williams BA, Pertea G, Mortazavi A, Kwan G, van Baren MJ, Salzberg SL, Wold BJ, Pachter L 2010. Transcript assembly and quantification by RNA-Seq reveals unannotated transcripts and isoform switching during cell differentiation. Nat Biotechnol 28: 511–515 [DOI] [PMC free article] [PubMed] [Google Scholar]
- Wang XJ, Gaasterland T, Chua NH 2005. Genome-wide prediction and identification of cis-natural antisense transcripts in Arabidopsis thaliana. Genome Biol 6: R30. [DOI] [PMC free article] [PubMed] [Google Scholar]
- Weber AP, Weber KL, Carr K, Wilkerson C, Ohlrogge JB 2007. Sampling the Arabidopsis transcriptome with massively parallel pyrosequencing. Plant Physiol 144: 32–42 [DOI] [PMC free article] [PubMed] [Google Scholar]
- Wu X, Liu M, Downie B, Liang C, Ji G, Li QQ, Hunt AG 2011. Genome-wide landscape of polyadenylation in Arabidopsis provides evidence for extensive alternative polyadenylation. Proc Natl Acad Sci 108: 12533–12538 [DOI] [PMC free article] [PubMed] [Google Scholar]
- Yassour M, Pfiffner J, Levin JZ, Adiconis X, Gnirke A, Nusbaum C, Thompson DA, Friedman N, Regev A 2010. Strand-specific RNA sequencing reveals extensive regulated long antisense transcripts that are conserved across yeast species. Genome Biol 11: R87. [DOI] [PMC free article] [PubMed] [Google Scholar]
- Yu W, Gius D, Onyango P, Muldoon-Jacobs K, Karp J, Feinberg AP, Cui H 2008. Epigenetic silencing of tumour suppressor gene p15 by its antisense RNA. Nature 451: 202–206 [DOI] [PMC free article] [PubMed] [Google Scholar]
- Zhan S, Lukens L 2013. Protein-coding cis-natural antisense transcripts have high and broad expression in Arabidopsis. Plant Physiology 161: 2171–2180 [DOI] [PMC free article] [PubMed] [Google Scholar]
- Zhang X, Bernatavichute YV, Cokus S, Pellegrini M, Jacobsen SE 2009. Genome-wide analysis of mono-, di- and trimethylation of histone H3 lysine 4 in Arabidopsis thaliana. Genome Biol 10: R62. [DOI] [PMC free article] [PubMed] [Google Scholar]
- Zhang X, Xia J, Lii YE, Barrera-Figueroa BE, Zhou X, Gao S, Lu L, Niu D, Chen Z, Leung C, et al. 2012. Genome-wide analysis of plant nat-siRNAs reveals insights into their distribution, biogenesis and function. Genome Biol 13: R20. [DOI] [PMC free article] [PubMed] [Google Scholar]