

Abstract
Coelacanths are known as “living fossils,” as they show remarkable morphological resemblance to the fossil record and belong to the most primitive lineage of living Sarcopterygii (lobe-finned fishes and tetrapods). Coelacanths may be key to elucidating the tempo and mode of evolution from fish to tetrapods. Here, we report the genome sequences of five coelacanths, including four Latimeria chalumnae individuals (three specimens from Tanzania and one from Comoros) and one L. menadoensis individual from Indonesia. These sequences cover two African breeding populations and two known extant coelacanth species. The genome is ∼2.74 Gbp and contains a high proportion (∼60%) of repetitive elements. The genetic diversity among the individuals was extremely low, suggesting a small population size and/or a slow rate of evolution. We found a substantial number of genes that encode olfactory and pheromone receptors with features characteristic of tetrapod receptors for the detection of airborne ligands. We also found that limb enhancers of bmp7 and gli3, both of which are essential for limb formation, are conserved between coelacanth and tetrapods, but not ray-finned fishes. We expect that some tetrapod-like genes may have existed early in the evolution of primitive Sarcopterygii and were later co-opted to adapt to terrestrial environments. These coelacanth genomes will provide a cornerstone for studies to elucidate how ancestral aquatic vertebrates evolved into terrestrial animals.
Since Agassiz (1844) first described the coelacanths, their fossils have been found frequently in sediments from the Early Devonian to the Late Cretaceous periods, implying that they were successfully diversified in the past. However, the disappearance of coelacanths in the fossil record after the Late Cretaceous period led biologists to believe that coelacanths had died out during the mass extinction event around that period (65 million years ago [Ma]). Therefore, the discovery of the first living coelacanth, Latimeria chalumnae, off the coast of South Africa in 1938, created a sensation not only within the scientific community but also within the general public (Smith 1939). At present, coelacanths are called an “evolutionary relic” or a “living fossil” because their morphology is basically unchanged from that of the fossil record (Smith 1939). After the discovery of a second living coelacanth in the Comoros archipelagos (Smith 1953), the existence of a viable coelacanth population was confirmed in this area. In addition to the Comoros archipelagos, several coelacanths have been captured off the coasts of Mozambique (Schliewen et al. 1993), Madagascar (Heemstra et al. 1996), Kenya (De Vos and Oyugi 2002), and Tanzania (Sasaki et al. 2007). Nikaido et al. (2011) recently demonstrated that a coelacanth population off the northern coastal region of Tanzania is genetically distinct from that of Comoros, indicating that the northern coastal region of Tanzania is the second habitat of coelacanths in the western Indian Ocean. Furthermore, two coelacanth individuals (L. menadoensis) were also captured off the coast of Manado, Sulawesi, Indonesia (Erdmann et al. 1998), on the opposite side of the Indian Ocean (the locations of the captured and observed coelacanths are summarized in Fig. 1; see also Supplemental Fig. 1).
Figure 1.

Captured or observed coelacanth individuals. The location numbers indicate the order of the captures. The location names and the dates are summarized at the right of the map. Although most of the coelacanths were recorded in the western Indian Ocean, some coelacanths were also captured and observed off the coast of Manado, Sulawesi. The names of the key African and Indonesian countries are indicated as follows: Kenya (Ken.), Tanzania (Tan.), Mozambique (Moz.), Madagascar (Mad.), South Africa (SAf.), Indonesia (Ind.), and the Philippines (Phi.).
The availability of coelacanth specimens enabled us to carry out genomic studies on these exceptional species (Supplemental Table 1). Coelacanths belong to the Sarcopterygii (lobe-finned fishes and tetrapods) (Forey 1988; Supplemental Fig. 2), in which lungfishes are also included. Indeed, molecular phylogenetic studies clearly indicate that coelacanths and lungfishes are more closely related to tetrapods than to teleost fishes (e.g., Zardoya and Meyer 1996), whereas the branching order of coelacanths, lungfishes, and tetrapods is still controversial (Takezaki et al. 2004). The karyotype of L. chalumnae, which was reported to be 48 chromosomes including microchromosomes, is similar to that of frogs and other species such as turtles or birds, further supporting the phylogenetic closeness of the coelacanth with tetrapods (Bogart et al. 1994). Accordingly, the coelacanths may fill an evolutionary gap between fish and tetrapods. Considering that the lungfishes are not suitable for comparative genomic analysis because of their extremely large genomes (Gregory et al. 2007), the coelacanth is a practical choice for genome-wide analysis.
One of the most conspicuous evolutionary events of Sarcopterygii is the transition from water to land, during which a variety of organs were subject to change due to adaptation to a novel environment. For example, the olfactory organ of the extant land vertebrates detects airborne chemicals, whereas that of fish primarily detects water-soluble chemicals. Thus, an innovative change occurred in the olfactory organ of vertebrates during the habitat transition from water to land. Similarly, the robust endoskeletal structures observed in land vertebrates are believed to be a result of adaptation to terrestrial life (Coates et al. 2002). Investigation of such phenotypic alterations is quite important to elucidate how adaptation to terrestrial life was accomplished during evolution. However, the molecular mechanisms underlying such transitions are unknown. To elucidate at the molecular level the evolutionary trajectories of vertebrates from water to land, we determined the whole-genome sequences of five coelacanths and performed an extensive comparative genomic analysis from various perspectives.
Results
Assembling the coelacanth genome
First, we constructed the reference coelacanth draft genome from one of the Tanzanian specimens (TCC041-004, gender unknown) (Nikaido et al. 2011), which was recovered from the body cavity of its mother (coelacanths give birth to fully formed offspring) (Fig. 2). A micro-computed tomography (micro-CT) scanning image was taken before sampling (Fig. 2; Supplemental Fig. 3). In total, we generated 884.8 Gbp of raw sequence data, from which ∼780 Gbp (∼300× coverage) was used for the assembly using the newly developed assembler PLATANUS (Supplemental Information 2.3, 2.4, 2.5). The genome size was estimated to be 2.74 Gbp from the k-mer analysis (Supplemental Fig. 5; Supplemental Table 3).
Figure 2.

Overview of the Tanzanian coelacanth (L. chalumnae). (A) Photograph of the whole body of the juvenile individual (ID: TCC041-004). (B) Micro-CT image of the pelvic fin of the juvenile coelacanth specimen before the dissection.
Unique features of the coelacanth genome
Compared with the typical teleost fish, which has a genome size of ∼1 Gbp (Hinegardner and Rosen 1972) (1 pg in C-values), the coelacanth genome is large (2.74 Gbp). We found that ∼60% of the coelacanth genome consists of repetitive elements—including simple repeats, low-complexity regions, and small RNAs—which is higher than the corresponding percentage in frog (35%), chicken (9%), and mammalian (40%–50%) genomes (Supplemental Fig. 17). Thus, the abundance of repetitive elements may explain the relatively large genome in coelacanths. Transposable elements (TEs) also have a considerable impact on the nucleotide composition of the coelacanth genome. The GC content of the entire coelacanth genome is 42%, which is comparable to that of other terrestrial vertebrate genomes (41% in human, 42% in chicken, and 40% in frog). However, it is the TE regions in coelacanths that have a high GC content (average of 45%), whereas the non-TE regions have only a 37% GC content, in contrast to 40% or higher in other vertebrate genomes. The number of CpG islands (CGIs) is extremely high (>90,000) because CGI-containing TEs are spread throughout the coelacanth genome. The number of CGIs in non-TE regions of the coelacanth genome was only 13,319, which is lower than that of human and chicken (23,000–28,000) but comparable to that of frog (15,000) and zebrafish (13,000).
TEs in the coelacanth genome
Most of the repetitive sequences that account for ∼60% of the coelacanth genome were characterized as TEs and classified according to their types. Within coelacanths, 23% of the genome is made up of DNA transposons, and 26% is made up of retroposons comprising SINEs (13.6%), LINEs (10.6%), and LTR retrotransposons (2.2%) (Table 1; Supplemental Fig. 17). The age distribution of TEs reveals that all the TE classes contain both highly divergent copies (>35% sequence divergence from the consensus) and copies that have low divergence (considered young; <5% divergence), suggesting that they have transposed or retrotransposed during both early and recent evolution (Fig. 3). In mammalian genomes, TEs that transposed or retrotransposed >100–150 Ma have been detected (International Human Genome Sequencing Consortium 2001). Because the substitution rate in coelacanths is considerably lower than the rates in other vertebrates (see below) (Amemiya et al. 2010; Higasa et al. 2012), it is likely that we could find TEs that were inserted even earlier, possibly >250 Ma.
Table 1.
Composition of TEs in the coelacanth genome
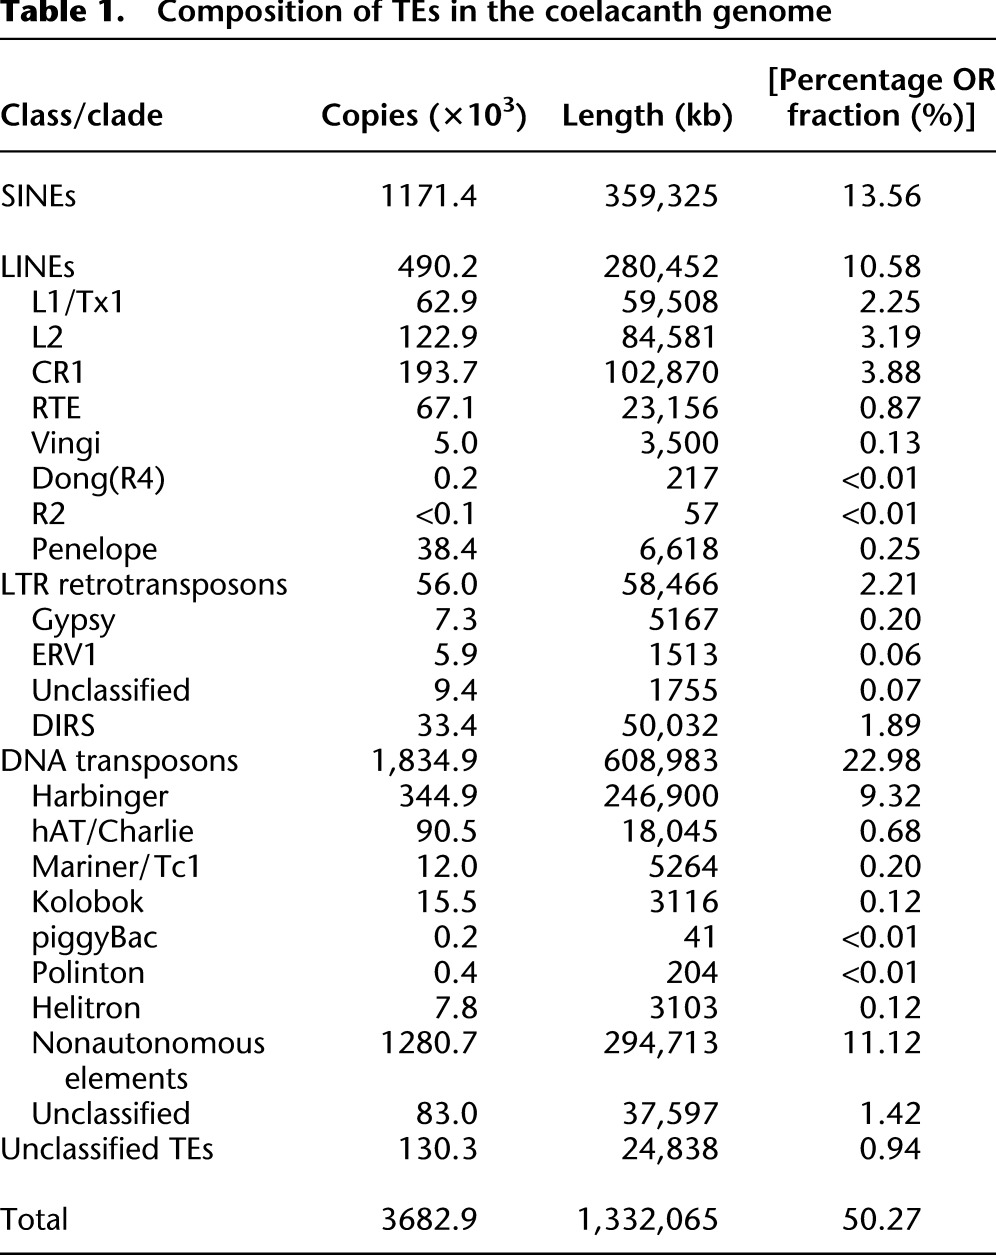
Figure 3.

Age distribution of TEs in the coelacanth genome. The total length of each TE class is shown against the sequence divergence (%) from the consensus sequence.
The coelacanth LINEs comprise at least 10% of the genome. Some copies of CR1, as well as those of L2, diverge from their respective consensus sequences by as little as 1% to >35%, which suggests that both families of LINEs have been retrotranspositionally active for hundreds of millions of years. In addition to CR1 and L2, seven LINE clades (Penelope, L1, Tx1, RTE, Vingi, Dong [R4], and R2) are present in the coelacanth genome (Fig. 4). The number of LINE clades in coelacanths is higher than that in tetrapods such as mammals (at most five clades), birds (one clade), anole lizard (seven clades), and frogs (five clades).
Figure 4.

Distribution of LINE clades among vertebrates. The presence and absence of the representative LINE clades are shown with a plus and minus sign, respectively. (a) These mammalian LINEs are not active at present, and only fossil sequences are found. (b) RTE and Vingi are distributed only in restricted eutherian groups, possibly because of horizontal transfer events. (c) R2 elements are not reported in anole lizard but are known in turtle and bird genomes.
Autonomous and nonautonomous DNA transposons constitute 23% of the coelacanth genome, and, notably, Harbinger elements (LatiHarb1) (Smith et al. 2012) occupy 9.3% of the genome. There are dozens of diverse families and subfamilies as well as nonautonomous elements related to the Harbinger superfamily. Although Harbinger elements are also found in other vertebrates such as fishes and frogs (Kapitonov and Jurka 2004; Hellsten et al. 2010), their high level of diversity, as well as their high number in the coelacanth genome is unique (see Supplemental Information 5 for details).
Estimation of the substitution rate
The evolutionary rate of the coelacanth genome has been debated for many years (Noonan et al. 2004; Amemiya et al. 2010; Higasa et al. 2012). With the entire genome available, we first compared a set of 5247 orthologous genes for coelacanth and four other vertebrates—human, chicken, frog, and zebrafish—and then constructed a maximum-likelihood tree to evaluate the difference in evolutionary rates among vertebrates (Fig. 5A). We found that the branch length of the coelacanth lineage is significantly shorter than the other branches in all substitution models applied (Supplemental Table 15). In addition, the likelihood-ratio test confirmed that the branch length for coelacanths is significantly shorter than those of the three other vertebrates (P < 0.01; Supplemental Information 6.1). Our data provide genome-wide confirmation of previous studies that used a small number of selected gene sets (Noonan et al. 2004; Amemiya et al. 2010; Higasa et al. 2012).
Figure 5.

The evolutionary rate is significantly slow in the coelacanth lineage. (A) Phylogenetic tree of euteleostomes constructed with 5247 orthologous genes using the maximum-likelihood method. (B) Genetic divergence between L. chalumnae individuals as well as between L. chalumnae (TCC041-004) and L. menadoensis (20080806) individuals estimated using SNVs. Homozygous rates indicate the proportion of homozygotic SNVs among total SNVs. In total, 1,673,302,134 bp were used for the analysis.
We further determined the entire genome sequence of L. menadoensis and mapped the sequence reads to the reference genome to compare the whole-genome sequences between the two coelacanth species (L. chalumnae and L. menadoensis). Surprisingly, the genetic divergence of the nuclear genome between them was estimated to be only 0.18% (Fig. 5B), which is at the subpopulation level. Although the slow rate of substitution was also recently reported elsewhere (Amemiya et al. 2013), the previous investigators compared the transcriptomes from only two tissues and partial genome sequences of L. menadoensis to the L. chalumnae genome. In the present study, we report the significantly slower rate of nucleotide substitution in the nuclear genome, which was determined by a whole-genome comparison of the two coelacanth species. In addition, we calculated the Ka/Ks ratio between the two coelacanth species using a total of 4531 coding DNA sequences. The resulting Ka/Ks ratio was estimated to be 0.38 (Supplemental Information 6.2), which is even higher than that for the other vertebrate species. Therefore, the low rate of amino acid substitution in coelacanths cannot be explained by purifying selection (smaller Ka as compared with Ks). Thus, the present result suggests that both the Ka and Ks were small, indicating a slow rate of nucleotide substitution in the coelacanth genome.
It is worth noting that the nuclear genetic divergence of 0.0018 shown here is 23-fold smaller than that of the L. menadoensis and L. chalumnae mitochondrial genomes (0.0428) (Inoue et al. 2005; Saitoh et al. 2011). The difference between the nuclear and mitochondrial genomes could be of primary importance in discussing the evolution of the coelacanth genome. If we simply integrate the divergence time of 20–30 Ma, which was estimated by the mitochondrial genome analyses (Inoue et al. 2005; Saitoh et al. 2011), the nuclear substitution rate was calculated to be 0.03–0.045 × 10⁻⁹ per year. This value is lower than that of other vertebrates (e.g., 1.2 × 10⁻⁹ per year in the human–chimp pair, as calculated by their genetic distance and divergence time of 0.0144 from Watanabe et al. 2004 and 6 Ma, respectively). Thus, several lines of evidence suggest that the nucleotide substitution rate in the nuclear genome of the coelacanths was unexpectedly slow.
Heterozygosity rate
To investigate the genetic diversity of coelacanths, we additionally determined the entire genome sequences of three individuals (two from Tanzania and one from Comoro). We then estimated the rate of heterozygosity for each individual. The rates of heterozygosity of the coelacanth individuals from Tanzania, Comoro, and Indonesia were estimated to be 0.0023%–0.0024%, 0.0019%, and 0.0061%, respectively (Supplemental Table 20). Thus, the heterozygosity rates in the coelacanth individuals from the western Indian Ocean were significantly lower than that in the Indonesian individual. Furthermore, the heterozygosity rate was the lowest in the Comoro individual (Supplemental Tables 20, 21). The lower heterozygosity rates in coelacanth individuals, as compared with those in human (0.069%) (Wang et al. 2008) and gorilla (0.076 to 0.189%) (Scally et al. 2012), are also consistent with the idea of a lower nucleotide substitution rate in coelacanths.
Genes for limb development
Because terrestrialization was an important event during the evolution of vertebrates, and because coelacanths have been historically regarded as a missing link to that event, we looked for genes that are expected to be associated with terrestrialization. First, we looked at genes related to lobed fins. The lobed fins of the coelacanth exhibit structures that are intermediate between fish and tetrapods, as represented by the presence of ray-like dermal bones (lepidotrichia), as well as a tetrapod-like robust endochondral internal skeleton, which are the ancestral characteristics of primitive sarcopterygians (Figs. 2, 6A; Coates et al. 2002; Friedman et al. 2007). The and genes encode actinoidin proteins, which are essential for the formation of lepidotrichia in teleost fishes and are absent in tetrapods (Zhang et al. 2010). Gene-knockdown experiments in zebrafish suggest that the loss of and genes in the tetrapod lineage led to the fin-to-limb transition (Zhang et al. 2010). We found two intact putative and genes (and_a and and_b) in the coelacanth genome. Both genes possess the conserved domain at the N-terminal region (Fig. 6B) and the repeat regions (Supplemental Fig. 28), both of which are characteristic of and gene family members. This discovery is consistent with the presence of actinotrichia (fiber-like proteins that are observed when the lepidotrichia first form) in coelacanths according to the anatomical description (Geraudie and Meunier 1980), and it demonstrates at the DNA level the retention of plesiomorphic fish-like characteristics (see Supplemental Information 7.2 for details).
Figure 6.

Genetic signature of fin-to-limb transition inferred from a genome comparison among vertebrate species. (A) Model of fin-to-limb transition based on morphological and molecular features. Red and blue bars indicate the molecular and morphological evolutionary events, respectively. The black and gray areas of the drawings depict the internal skeletons and lepidotrichia, respectively. The skeletons of the pectoral fins or limbs of zebrafish, Tiktaalik, Acanthostega, and mouse (extant tetrapods) were modified from Schneider et al. (2011). The skeleton of the pectoral fin of the coelacanth was drawn according to Millot and Anthony (1958). (B) Alignment of the N-terminal conserved domain of and genes showing two and genes in the coelacanth genome (arrowheads). Completely and mostly conserved (three or fewer amino acid substitution events during evolution) sites are shown with black and gray backgrounds, respectively. The species are indicated as follows: five teleost fishes, zebrafish (Dre: Danio rerio), stickleback (Gac: Gasterosteus aculeatus), fugu (Tru: Takifugu rubripes), pufferfish (Tni: Tetraodon nigroviridis), and medaka (Ola: Oryzias latipes); spotted gar (Loc: Lepisosteus oculatus); coelacanth (Lch: L. chalumnae); and elephant shark (Cmi: Callorhinchus milii). (C–E) VISTA plots of cis-regulatory elements in six vertebrate species using mouse as the reference for the following loci: (C) bmp7 intron 1 enhancer; (D) CNE11 in intron 10 of gli3; and (E) HMCO1 in the grem1-fmn1 locus. Lines indicate the degree of conservation from 50%–100%. The genomic regions estimated to be CNEs are shown by pink.
We also explored conserved noncoding elements (CNEs) that act as enhancers of key genes for limb development such as bmp7, grem1, shh, and gli3. These CNEs participate in gene regulatory networks for axial formation, outgrowth, and chondrogenic differentiation in limb development (Zeller et al. 2009). We found apparent sequence similarity in CNEs for the limb enhancer of bmp7 (Adams et al. 2007) and the limb enhancer (CNE11) of gli3 (Abbasi et al. 2010) between tetrapods and coelacanth, whereas such similarities were not observed in the corresponding genomic regions of ray-finned fishes (Fig. 6C,D). The grem1 limb enhancer is also specifically conserved between tetrapods and coelacanth (Fig. 6E), as was previously reported (Zuniga et al. 2012).
Chemoreceptor genes
Finally, we looked at olfactory receptor (OR) genes and pheromone receptor (V1R) genes (see Supplemental Information 7.1 for detailed strategy). Aquatic vertebrates such as teleost fishes and primitive sarcopterygians may sense nonvolatile (water soluble) chemicals, whereas terrestrial vertebrates such as mammals, reptiles, birds, and frogs mainly sense volatile (airborne) chemicals. In accordance with this expected functional transition, previous studies indicate that the repertoires of OR and V1R genes are highly differentiated between fishes and tetrapods (Niimura and Nei 2005; Saraiva and Korsching 2007; Nei et al. 2008). Figure 7A shows the neighbor-joining tree of V1R genes from a broad range of vertebrates including coelacanths. Most teleost fishes possess six distantly related V1R genes (fish-V1R1 to fish-V1R6, in blue), whereas tetrapods possess more than 20 genes of closely related V1Rs (designated as tetrapod type; t-V1Rs), which are nested within the clades of fish-V1R1 and fish-V1R2 (Saraiva and Korsching 2007). This suggests that tetrapods have increased the V1R copy number through lineage-specific gene expansion, which might facilitate the adaptation to sense airborne chemicals. In the coelacanth genome, we found almost all of the fish-type V1R genes, which have been retained by the constraint of an underwater environment. Interestingly, however, multiple t-V1R genes (represented by the red triangle in Fig. 7A) were also discovered. The maximum-likelihood tree showed a similar result (Supplemental Fig. 25). Accordingly, lineage-specific expansion of the t-V1R genes possibly occurred in a common ancestor of Sarcopterygii, as represented by the gene numbers in Supplemental Figure 26. Furthermore, the coelacanth OR genes underwent similar gene expansion. The α and γ subfamilies of OR genes are preferentially increased in tetrapod genomes, implying that these receptors detect volatile chemicals in the terrestrial environment (Niimura and Nei 2005; Nei et al. 2008). Interestingly, in coelacanths, there was a substantial amplification in the number of OR genes belonging to subfamily γ (more than 20 copies) (Fig. 7B; Supplemental Fig. 27). Furthermore, OR genes belonging to subfamily α were also amplified in coelacanths (Fig. 7B; Supplemental Fig. 27).
Figure 7.

The evolution of chemoreceptor genes in coelacanths. (A) The neighbor-joining tree of vertebrate V1R genes. The evolutionary distances were computed using the JTT matrix-based method and are presented in amino acid substitutions per site as shown by the scale bar. Bootstrap values (10,000 replicates) >60 are shown in the tree. The species are indicated as follows: gray, cow (Bos taurus); green, frog (Xenopus tropicalis); red, coelacanth (L. chalumnae); blue, five teleost fishes—zebrafish (D. rerio), stickleback (G. aculeatus), fugu (T. rubripes), pufferfish (T. nigroviridis), and medaka (O. latipes). (B) Comparison of the copy numbers of the OR genes belonging to subfamilies α and γ among vertebrates. Blue, yellow, and red bars indicate the genes that were annotated as intact, truncated (because of the incompleteness of the draft genome), and pseudogenes, respectively.
Discussion
Comparison of TEs among vertebrates
The proportions of coelacanth TEs were compared with those of other vertebrates (Supplemental Fig. 17; International Human Genome Sequencing Consortium 2001; Hillier et al. 2004; Mikkelsen et al. 2007; Piskurek et al. 2009; Hellsten et al. 2010; UCSC Genome Bioinformatics, http://genome.ucsc.edu/). Interestingly, a comparison of LINE distribution among vertebrates reveals the loss of diversity of LINE families in tetrapods (Fig. 4). For example, whereas Nimb clade LINEs are known in teleost fishes (e.g., zebrafish) and insects (e.g., silkworm and mosquito), no obvious copy of Nimb exists in coelacanths or tetrapods (Fig. 4), which may suggest a shared loss of the Nimb family in the common ancestral lineage of Sarcopterygii. Thus, coelacanth LINEs show an intermediate feature in terms of their distribution among vertebrates (see Supplemental Information 5 for details).
Figure 3 shows the amplification waves of TEs in the coelacanth genome, the oldest of which can be traced to >35% divergence from the consensus. This amount of divergence corresponds to about 150 Ma in the cases of mammalian TEs (International Human Genome Sequencing Consortium 2001). As demonstrated in the present study, however, the coelacanth genomes exhibit a slow rate of substitution. Accordingly, 35% divergence in the coelacanth genome may correspond to an insertion event that occurred over 400 Ma. This suggests the very interesting possibility that we can elucidate phylogenetic relationships among tetrapods, coelacanths, and lungfish using the retroposon method (Shedlock and Okada 2000). Because the divergence time among tetrapods, coelacanths, and lungfish is assumed to be around 400 Ma, these times fall within the scope of the estimation determined by the retroposon method. In this regard, it will be interesting to search the lungfish genome for the presence of coelacanth retroposon families that have been described here. If we discover the old retroposons in the lungfish genome that were amplified 400 Ma, the application of the retroposon method to these interesting phylogenetic relationships may be feasible.
The significantly slow rate of substitution in the coelacanth genome
The present finding of the slow rate of nucleotide substitution in the coelacanth genome possibly offers insights into why the morphology of coelacanths has evolved so slowly over the past 400 million years (Smith 1939; Forey 1988). Namely, slower nucleotide substitutions in coelacanth genes and/or enhancers may reduce the potential to alter the phenotypic traits. Although it is widely accepted that phenotypic evolution and neutral DNA evolution are decoupled (Hay et al. 2008), the slow rate of evolution in morphology and DNA appears to be coupled in coelacanths. However, because the inbreeding or the bottleneck in each of the coelacanth populations of Tanzania, Comoro, and Indonesia could possibly lead to an inaccurate estimation of the genetic distances, we should still be cautious about conclusions in this regard.
Difference in heterozygosity rates
We have shown that the rates of heterozygosity are significantly different according to the coelacanth locality. Because the mutation rates are expected to be similar among extant coelacanth individuals, the difference in heterozygosity rates could result from the demographic history of their populations (i.e., a reduction in population size or inbreeding). In particular, the lowest heterozygosity rate, which was found for the Comoro individual, implies the possibility of a population bottleneck. At present, the coelacanth populations in the Comoros archipelagos are threatened because of past overexploitation (Hissmann et al. 1998). Our previous mitochondrial analysis also showed a lower genetic diversity in the Comoros population than in the Tanzanian population (Nikaido et al. 2011). Thus, our present results prompt us to investigate the population structures of coelacanths more comprehensively by adding specimens currently available for molecular research.
Apparent similarities observed in genes and enhancers of Sarcopterygian genomes
In the present study, we found an apparent sequence similarity in CNEs for the limb enhancer between tetrapods and coelacanth. From an evolutionary viewpoint, it is likely that these CNEs that emerged in the primitive sarcopterygians are essential for shaping tetrapod-like robust internal skeletons (Fig. 6A). Importantly, the emergence of these novel CNEs and the resulting robust internal skeletons in the primitive sarcopterygians could have been used initially for effective underwater swimming rather than for locomotion on land. It is likely that these CNEs were co-opted later during the water-to-land transition in primitive tetrapods, which was coupled to the loss of and genes. Furthermore, we revealed the amplification of tetrapod-type chemoreceptor genes (t-V1Rs, α and γ ORs) in the coelacanth genome (Fig. 7). Because primitive sarcopterygians inhabited an underwater environment, it is unlikely that t-V1Rs or α and γ ORs of those groups received airborne chemicals. Thus, we further speculate that the initial gene expansion of these genes was not directly related to terrestrial adaptation but was subsequently co-opted in tetrapods. It is possible that the ancestral coelacanth lineage(s) once inhabited shallow water and then returned to open marine water. In that case, the presence of the robust internal skeleton as well as t-V1Rs in coelacanths may be the signature of adaptation for spending time above the surface and crawling near the shore. However, this scenario is unlikely for three reasons. First, the bodies of both extant and extinct coelacanths are very heavy, and it would be very difficult for them to lift their body against gravity. Second, their bodies are covered by armor scales, which are expected to be unfit for dryness. Third, if the expansion of t-V1Rs occurred because of the adaptation to detect airborne chemicals in the ancestral coelacanth, these genes would have subsequently been pseudonized in extant coelacanths, which inhabited a deep marine environment. These genes are, however, still intact.
It is proposed that some genes utilized for adaptation already existed before the emergence of novel fauna such as multicellular organisms (Miyata and Suga 2001). We expect that some tetrapod-like genes already existed in the genomes of ancestral Sarcopterygii before the terrestrial adaptation in spite of the fact that these genes were not originally related to the terrestrial adaptation. Other examples of genes that are expected to be critical for the water-to-land transition, such as those for hemoglobins, urea synthesis, ovoviviparity, and the swim bladder, are discussed in Section 7 of the Supplemental Information.
Highlights in the present study
Recently, Amemiya et al. (2013) published the L. chalumnae genome sequence. Here, we highlight several novel findings that were not provided in their analyses.
(1) This is the first example of the application of PLATANUS, a newly developed assembler, to the determination of an entire large eukaryotic genome using next-generation sequencing data. A detailed explanation of the advantage of this application is provided in Supplemental Information 2.3.
(2) The complete picture of the TEs in the coelacanth genome is presented, which might shed light on the long-debated issue regarding the phylogenetic position of the coelacanths among vertebrates using the retroposon method.
(3) The whole-genome sequences of multiple coelacanth individuals from Tanzania, Comoro, and Indonesia, which were determined in the present study, enabled us to establish the extremely low value of genetic divergence among individuals and to estimate an unexpectedly slow rate of nucleotide substitution. In addition, these data enabled us to determine the significant differences in the genetic diversities among each population.
(4) The possibility of co-option in the timing of terrestrial adaptation was presented. This phenomenon could be quite important for understanding the genetic origins of key innovations in natural history, providing the seed for discussions regarding the process of macro-evolution, including the fin-to-limb transition.
(5) As an example of such discussions, the chemoreceptor genes in the coelacanth genome were completely analyzed, which provides novel insight into the evolution of olfaction during the water-to-land transition.
In summary, the coelacanth genome sequences provide a cornerstone to answer, at the DNA level, the long-debated and scientifically important questions regarding how vertebrates successfully adapted to terrestrial life. Another unexpected discovery derived from the whole-genome data is the extremely slow substitution rate found within the coelacanth genome. In addition, our finding of the significantly lower heterozygosity rates of the coelacanths in the western Indian Ocean, compared to those of the Indonesian coelacanth, should promote conservation-related genetic studies (Fricke et al. 2011) to protect this “priceless heritage from the past” (Smith 1963) from extinction.
Methods
Coelacanth specimens and tissue samples
All of the coelacanth specimens described in this study were accidentally caught by local fisherman and transferred later either to The Tokyo Institute of Technology; The University of Tokyo; or Aquamarine Fukushima, Marine Science Museum, under the regulation of the Convention on International Trade in Endangered species of Wild Fauna and Flora. Detailed information about each specimen is provided in the Supplemental Material. L. chalumnae (TCC041-004, TCC025, and S2) were transferred from the Tanzania Fisheries Research Institute to the Tokyo Institute of Technology under the Memorandum of Understanding (M.O.U.) between the two institutions. Similarly, the Comoran specimen was obtained from the Center National de Documentation et de Recherche Scientifique, Musee National des Comores (CNDRS) to Aquamarine Fukushima, Marine Science Museum. Frozen muscle tissue from the Indonesian coelacanth L. menadoensis was given by Sam Ratulangi University to the University of Tokyo under the Cooperative Research Agreement between the two universities. Detailed information about the specimens is listed in Supplemental Table 1.
Genome sequencing and assembly
Sequencing libraries were prepared using the Illumina TruSeq DNA Sample Prep kit (300 bp, 500 bp, and 1.0 kb) and the SOLiD Mate-Paired Library Construction kit (2.5 and 5.0 kb; Applied Biosystems) according to the manufacturers' instructions. All libraries were sequenced on the Illumina HiSeq2000 sequencers. The raw sequence reads were filtered for the trimming of adapter sequences in reads and for the removal of paired reads with low-quality or extremely short insert sizes. Whole-genome assembly was performed with the newly developed assembler PLATANUS, which is optimized for short-read data from high-throughput sequencers. See Supplemental Information 2.3 for details.
Genome browser
The Coelacanth Genome Browser has been established using the assembled genome sequence and RNA-seq data, and genomic data sets used in this study are freely available online (http://coelacanth.nig.ac.jp/; Supplemental Fig. 16). This browser shows the SNV density of each individual, gene models, expression, repeats, comparative analysis, fosmid clone map, and coelacanth/human alignment using the Generic Genome Browser (GBrowser) (Stein et al. 2002). In addition, the browser provides a sequence similarity search function against the coelacanth assembled genome and the gene model sequences with blast/BLAT programs, and a keyword search function against gene symbols and definitions. Users can also download the entire data set described in this study, including the genome sequence, LatCha_J1.0, as well as predicted gene sequences CDS, CDS+UTR, protein sequences, gene structures, rRNAs, and ncRNAs. See Supplemental Information 4.7 for details.
More details about the genome sequencing and assembly, RNA-seq, gene annotation, data mining, bioinformatic analyses, phylogenetic analyses, and micro-CT imaging are described in the Supplemental Methods and Supplemental Information.
Data access
All nucleotide sequence reads and the genome assembly have been deposited in the DDBJ SRA under BioProject PRJDB500 and LatCha_J1.0. (http://trace.ddbj.nig.ac.jp/dra/index.shtml). The fosmid sequences have been submitted to NCBI GenBank (http://www.ncbi.nlm.nih.gov/genbank/) under accession nos. DH994576–DH995329, GA605430–GA720357, AP012980–AP012984, AP012992–AP012996.
Acknowledgments
We thank all the members of the laboratories involved in this project for discussions. Faissoil Mahamoud and Muradabi Mahamoud helped us handle the Indonesian specimen. We also thank Mihoko Imada, Tomoyuki Aizu, Hinako Ishizaki, and Yohei Minakuchi for technical and computational assistance. The late Jun-ichi Watanabe started the collection of Indonesian and Comoran specimens used in this study. This work was supported in part by a KAKENHI (Grant-in-Aid for Scientific Research) for Priority Areas “Comparative Genomics” from the Ministry of Education, Culture, Sports, Science and Technology of Japan (No. 16064101), a KAKENHI to N.O. (No. 21227002), and a KAKENHI for Innovative Areas “Genome Science” (No. 221S0002).
Author contributions: Project design and coordination: N.O., A.F., Y.K., S.S., and T.I. Genome assembly and annotation: A.F., T.I., H.N., A.T., Y.S., R.K., and M.O. Comparative genomic analyses: M.N., H.N., H.S., K.F., M.O., T.A., and T.S. Management and dissection: M.A., B.P.N., S.I.M., H.W.J.K., K.W.A.M., J.T., S.N., R.M., M.I., and Y.A. CT imaging: A.M., T.S. Writing: N.O., A.F., T.S., R.K., T.I., K.F., T.O., H.N., and M.N.
Footnotes
[Supplemental material is available for this article.]
Article published online before print. Article, supplemental material, and publication date are at http://www.genome.org/cgi/doi/10.1101/gr.158105.113.
Freely available online through the Genome Research Open Access option.
References
- Abbasi AA, Paparidis Z, Malik S, Bangs F, Schmidt A, Koch S, Lopez-Rios J, Grzeschik KH 2010. Human intronic enhancers control distinct sub-domains of Gli3 expression during mouse CNS and limb development. BMC Dev Biol 10: 44. [DOI] [PMC free article] [PubMed] [Google Scholar]
- Adams D, Karolak M, Robertson E, Oxburgh L 2007. Control of kidney, eye and limb expression of Bmp7 by an enhancer element highly conserved between species. Dev Biol 311: 679–690 [DOI] [PMC free article] [PubMed] [Google Scholar]
- Agassiz L. 1844. Recherches sur les Poissons Fossiles, Vol. 2. Imprimerie de Petitpierre, Neuchâtel. [Google Scholar]
- Amemiya CT, Powers TP, Prohaska SJ, Grimwood J, Schmutz J, Dickson M, Miyake T, Schoenborn MA, Myers RM, Ruddle FH, et al. 2010. Complete HOX cluster characterization of the coelacanth provides further evidence for slow evolution of its genome. Proc Natl Acad Sci 107: 3622–3627 [DOI] [PMC free article] [PubMed] [Google Scholar]
- Amemiya CT, Alföldi J, Lee AP, Fan S, Philippe H, MacCallum I, Braasch I, Manousaki T, Schneider I, Rohner N, et al. 2013. The African coelacanth genome provides insights into tetrapod evolution. Nature 496: 311–316 [DOI] [PMC free article] [PubMed] [Google Scholar]
- Bogart JP, Balon EK, Bruton MN 1994. The chromosomes of the living coelacanth and their remarkable similarity to those of one of the most ancient frogs. J Hered 85: 322–325 [DOI] [PubMed] [Google Scholar]
- Coates MI, Jeffery JE, Rut M 2002. Fins to limbs: What the fossils say. Evol Dev 4: 390–401 [DOI] [PubMed] [Google Scholar]
- De Vos L, Oyugi D 2002. First capture of a coelacanth, Latimeria chalumnae Smith, 1939 (Pisces: Latimeriidae), off Kenya. S Afr J Sci 98: 345–347 [Google Scholar]
- Erdmann MV, Caldwell RL, Moosa MK 1998. Indonesian king of the sea discovered. Nature 395: 335 [Google Scholar]
- Forey PL 1988. Golden jubilee for the coelacanth Latimeria chalumnae. Nature 336: 727–732 [Google Scholar]
- Fricke H, Hissmann K, Froese R, Schauer J, Plante R, Fricke S 2011. The population biology of the living coelacanth studied over 21 years. Mar Biol 158: 1511–1522 [Google Scholar]
- Friedman M, Coates MI, Anderson P 2007. First discovery of a primitive coelacanth fin fills a major gap in the evolution of lobed fins and limbs. Evol Dev 9: 329–337 [DOI] [PubMed] [Google Scholar]
- Geraudie J, Meunier FJ 1980. Elastoidin actinotrichia in Coelacanth fins: A comparison with teleosts. Tissue Cell 12: 637–645 [DOI] [PubMed] [Google Scholar]
- Gregory TR, Nicol JA, Tamm H, Kullman B, Kullman K, Leitch IJ, Murray BG, Kapraun DF, Greilhuber J, Bennett MD 2007. Eukaryotic genome size databases. Nucleic Acids Res 35: D332–D338 [DOI] [PMC free article] [PubMed] [Google Scholar]
- Hay JM, Subramanian S, Millar CD, Mohandesan E, Lambert DM 2008. Rapid molecular evolution in a living fossil. Trends Genet 24: 106–109 [DOI] [PubMed] [Google Scholar]
- Heemstra PC, Freeman AL, Wong HY, Hensley DA, Rabesandratana HD 1996. First authentic capture of a coelacanth, Latimeria chalumnae (Pisces: Latimeriidae), off Madagascar. S Afr J Sci 92: 150–151 [Google Scholar]
- Hellsten U, Harland RM, Gilchrist MJ, Hendrix D, Jurka J, Kapitonov V, Ovcharenko I, Putnam NH, Shu S, Taher L, et al. 2010. The genome of the Western clawed frog Xenopus tropicalis. Science 328: 633–636 [DOI] [PMC free article] [PubMed] [Google Scholar]
- Higasa K, Nikaido M, Saito TL, Yoshimura J, Suzuki Y, Suzuki H, Nishihara H, Aibara M, Ngatunga BP, Kalombo HW, et al. 2012. Extremely slow rate of evolution in the HOX cluster revealed by comparison between Tanzanian and Indonesian coelacanths. Gene 505: 324–332 [DOI] [PubMed] [Google Scholar]
- Hillier LW, Miller W, Birney E, Warren W, Hardison RC, Ponting CP, Bork P, Burt DW, Groenen MA, Delany ME, et al. 2004. Sequence and comparative analysis of the chicken genome provide unique perspectives on vertebrate evolution. Nature 432: 695–716 [DOI] [PubMed] [Google Scholar]
- Hinegardner R, Rosen DE 1972. Cellular DNA content and the evolution of teleostean fishes. Am Nat 106: 621–644 [Google Scholar]
- Hissmann K, Fricke H, Schauer J 1998. Population monitoring of the coelacanth (Latimeria chalumnae). Conserv Biol 12: 759–765 [Google Scholar]
- Inoue JG, Miya M, Venkatesh B, Nishida M 2005. The mitochondrial genome of Indonesian coelacanth Latimeria menadoensis (Sarcopterygii: Coelacanthiformes) and divergence time estimation between the two coelacanths. Gene 349: 227–235 [DOI] [PubMed] [Google Scholar]
- International Human Genome Sequencing Consortium 2001. Initial sequencing and analysis of the human genome Nature 409: 806–921 [Google Scholar]
- Kapitonov VV, Jurka J 2004. Harbinger transposons and an ancient HARBI1 gene derived from a transposase. DNA Cell Biol 23: 311–324 [DOI] [PubMed] [Google Scholar]
- Mikkelsen TS, Wakefield MJ, Aken B, Amemiya CT, Chang JL, Duke S, Garber M, Gentles AJ, Goodstadt L, Heger A, et al. 2007. Genome of the marsupial Monodelphis domestica reveals innovation in non-coding sequences. Nature 447: 167–177 [DOI] [PubMed] [Google Scholar]
- Millot J, Anthony J 1958. Anatomie de Latimeria chalumnae. Tome I. Squelette, Muscles, et Formations du Soutien. Éditions du Centre National de la Recherche Scientifique, Paris, France [PubMed] [Google Scholar]
- Miyata T, Suga H 2001. Divergence pattern of animal gene families and relationship with the Cambrian explosion. Bioessays 23: 1018–1027 [DOI] [PubMed] [Google Scholar]
- Nei M, Niimura Y, Nozawa M 2008. The evolution of animal chemosensory receptor gene repertoires: roles of chance and necessity. Nat Rev Genet 9: 951–963 [DOI] [PubMed] [Google Scholar]
- Niimura Y, Nei M 2005. Evolutionary dynamics of olfactory receptor genes in fishes and tetrapods. Proc Natl Acad Sci 102: 6039–6044 [DOI] [PMC free article] [PubMed] [Google Scholar]
- Nikaido M, Sasaki T, Emerson JJ, Aibara M, Mzighani SI, Budeba YL, Ngatunga BP, Iwata M, Abe Y, Li WH, et al. 2011. Genetically distinct coelacanth population off the northern Tanzanian coast. Proc Natl Acad Sci 108: 18009–18013 [DOI] [PMC free article] [PubMed] [Google Scholar]
- Noonan JP, Grimwood J, Danke J, Schmutz J, Dickson M, Amemiya CT, Myers RM 2004. Coelacanth genome sequence reveals the evolutionary history of vertebrate genes. Genome Res 14: 2397–2405 [DOI] [PMC free article] [PubMed] [Google Scholar]
- Piskurek O, Nishihara H, Okada N 2009. The evolution of two partner LINE/SINE families and a full-length chromodomain-containing Ty3/Gypsy LTR element in the first reptilian genome of Anolis carolinensis. Gene 441: 111–118 [DOI] [PubMed] [Google Scholar]
- Saitoh K, Sado T, Doosey MH, Bart HLJ, Inoue JG, Nishida M, Mayden RL, Nishida M, Miya M 2011. Evidence from mitochondrial genomics supports the lower Mesozoic of South Asia as the time and place of basal divergence of cypriniform fishes (Actinopterygii: Ostariophysi). Zool J Linn Soc 161: 633–662 [Google Scholar]
- Saraiva LR, Korsching SI 2007. A novel olfactory receptor gene family in teleost fish. Genome Res 17: 1448–1457 [DOI] [PMC free article] [PubMed] [Google Scholar]
- Sasaki T, Sato T, Miura S, Bwathondi PO, Ngatunga BP, Okada N 2007. Mitogenomic analysis for coelacanths (Latimeria chalumnae) caught in Tanzania. Gene 389: 73–79 [DOI] [PubMed] [Google Scholar]
- Scally A, Dutheil JY, Hillier LW, Jordan GE, Goodhead I, Herrero J, Hobolth A, Lappalainen T, Mailund T, Marques-Bonet T, et al. 2012. Insights into hominid evolution from the gorilla genome sequence. Nature 483: 169–175 [DOI] [PMC free article] [PubMed] [Google Scholar]
- Schliewen U, Fricke H, Schartl M, Epplen JT, Pääbo S 1993. Which home for coelacanth? Nature 363: 405 [Google Scholar]
- Schneider I, Aneas I, Gehrke AR, Dahn RD, Nobrega MA, Shubin NH 2011. Appendage expression driven by the Hoxd Global Control Region is an ancient gnathostome feature. Proc Natl Acad Sci 108: 12782–12786 [DOI] [PMC free article] [PubMed] [Google Scholar]
- Shedlock AM, Okada N 2000. SINE insertions: Powerful tools for molecular systematics. Bioessays 22: 148–160 [DOI] [PubMed] [Google Scholar]
- Smith JLB 1939. A living fish of Mesozonic type. Nature 143: 455–456 [Google Scholar]
- Smith JLB 1953. The second Coelacanth. Nature 171: 99–101 [DOI] [PubMed] [Google Scholar]
- Smith JLB. 1963. The atomic bomb and the coelacanth. The Daily Dispatch, 10 Dec.
- Smith JJ, Sumiyama K, Amemiya CT 2012. A living fossil in the genome of a living fossil: Harbinger transposons in the coelacanth genome. Mol Biol Evol 29: 985–993 [DOI] [PMC free article] [PubMed] [Google Scholar]
- Stein LD, Mungall C, Shu S, Caudy M, Mangone M, Day A, Nickerson E, Stajich JE, Harris TW, Arva A, et al. 2002. The generic genome browser: A building block for a model organism system database. Genome Res 12: 1599–1610 [DOI] [PMC free article] [PubMed] [Google Scholar]
- Takezaki N, Figueroa F, Zaleska-Rutczynska Z, Takahata N, Klein J 2004. The phylogenetic relationship of tetrapod, coelacanth, and lungfish revealed by the sequences of forty-four nuclear genes. Mol Biol Evol 21: 1512–1524 [DOI] [PubMed] [Google Scholar]
- Wang J, Wang W, Li R, Li Y, Tian G, Goodman L, Fan W, Zhang J, Li J, Guo Y, et al. 2008. The diploid genome sequence of an Asian individual. Nature 456: 60–65 [DOI] [PMC free article] [PubMed] [Google Scholar]
- Watanabe H, Fujiyama A, Hattori M, Taylor TD, Toyoda A, Kuroki Y, Noguchi H, BenKahla A, Lehrach H, Sudbrak R, et al. 2004. DNA sequence and comparative analysis of chimpanzee chromosome 22. Nature 429: 382–388 [DOI] [PubMed] [Google Scholar]
- Zardoya R, Meyer A 1996. Evolutionary relationships of the coelacanth, lungfishes, and tetrapods based on the 28S ribosomal RNA gene. Proc Natl Acad Sci 93: 5449–5454 [DOI] [PMC free article] [PubMed] [Google Scholar]
- Zeller R, López-Ríos J, Zuniga A 2009. Vertebrate limb bud development: Moving towards integrative analysis of organogenesis. Nat Rev Genet 10: 845–858 [DOI] [PubMed] [Google Scholar]
- Zhang J, Wagh P, Guay D, Sanchez-Pulido L, Padhi BK, Korzh V, Andrade-Navarro MA, Akimenko MA 2010. Loss of fish actinotrichia proteins and the fin-to-limb transition. Nature 466: 234–237 [DOI] [PubMed] [Google Scholar]
- Zuniga A, Laurent F, Lopez-Rios J, Klasen C, Matt N, Zeller R 2012. Conserved cis-regulatory regions in a large genomic landscape control SHH and BMP-regulated Gremlin1 expression in mouse limb buds. BMC Dev Biol 12: 23. [DOI] [PMC free article] [PubMed] [Google Scholar]