

Abstract
We have created a library of 2007 mutagenized Caenorhabditis elegans strains, each sequenced to a target depth of 15-fold coverage, to provide the research community with mutant alleles for each of the worm's more than 20,000 genes. The library contains over 800,000 unique single nucleotide variants (SNVs) with an average of eight nonsynonymous changes per gene and more than 16,000 insertion/deletion (indel) and copy number changes, providing an unprecedented genetic resource for this multicellular organism. To supplement this collection, we also sequenced 40 wild isolates, identifying more than 630,000 unique SNVs and 220,000 indels. Comparison of the two sets demonstrates that the mutant collection has a much richer array of both nonsense and missense mutations than the wild isolate set. We also find a wide range of rDNA and telomere repeat copy number in both sets. Scanning the mutant collection for molecular phenotypes reveals a nonsense suppressor as well as strains with higher levels of indels that harbor mutations in DNA repair genes and strains with abundant males associated with him mutations. All the strains are available through the Caenorhabditis Genetics Center and all the sequence changes have been deposited in WormBase and are available through an interactive website.
A powerful approach to understanding the function of a genome has been to alter it and observe the effects on the organism. Classical genetics achieves this by generating a random collection of variants, often enhanced by the use of mutagens, and then selecting for organisms with the desired alterations in phenotype. Although this approach has led to fundamental discoveries about many biological processes, one limitation is that loss-of-function alleles of an estimated 60%–80% of genes result in no readily detectable change of phenotype under normal growth conditions in a wide variety of organisms (see, for example, Hillenmeyer et al. 2008). This problem was dramatically illustrated with the sequencing of the genome of the baker's yeast, Saccharomyces cerevisiae (Goffeau et al. 1996), where only a fraction of the resulting 6000 annotated open reading frames was already known, even after decades of intensive investigation by geneticists.
As an alternative approach to classical genetics, investigators have exploited advances in molecular–genetic techniques and available genome sequences to alter selected sequences and examine the resultant organisms for phenotypic changes. This approach has been particularly powerful in organisms where homologous recombination can be used readily and specifically to alter genomic sequences. In yeast, these approaches have been used to create catalogs in which all known genes are deleted or tagged to facilitate exploration of their function (Winzeler et al. 1999; Giaever et al. 2002). In particular, the deletion collection has allowed the systematic construction of double mutants, with the resultant synthetic genetic interactions revealing functions for most genes in the yeast genome (Tong et al. 2001, 2004). A companion approach, placing individual deletion strains under chemical or environmental stress, has revealed a role in optimal growth for 97% of the genes in yeast (Hillenmeyer et al. 2008).
Creating complete collections of mutated genes in multicellular organisms has been more challenging because effective methods to specifically and efficiently manipulate their genomes are lacking. Instead, investigators have relied on random mutagenesis followed by molecular screening. For example, large transposon collections have been generated in Drosophila melanogaster, Arabidopsis thaliana, and Caenorhabditis elegans (Kuromori et al. 2004; Bellen et al. 2011; Vallin et al. 2012). These impressive collections are still incomplete and involve the storage of large numbers of strains. In most cases they also require, as a second step, the mobilization of the transposon to generate a loss-of-function mutation (see, for example, Robert and Bessereau 2007; Frokjaer-Jensen et al. 2010). Alternatively, large collections of mutagenized animals can be screened for mutations in desired genes (for review, see Moerman and Barstead 2008). Tilling has been a particularly useful implementation in Arabidopsis and has also been used to a limited extent in other organisms (McCallum et al. 2000; Till et al. 2003; Gilchrist et al. 2006; Till et al. 2007). In C. elegans, PCR/deletion screening of mutagenized populations for deletions in specific genes has been carried out both by individual labs and systematically by The C. elegans Deletion Mutant Consortium to create a collection of more than 6841 deletions in 6013 genes (The C. elegans Deletion Mutant Consortium 2012). These strains have been widely used by the community, but after more than a decade the collection covers only about one-third of the 20,377 protein-coding genes of this organism. Engineered zinc-finger containing DNA-binding proteins (Urnov et al. 2010) and transcription activator-like effector domain nucleases (TALEN) (Boch 2011; Bogdanove and Voytas 2011; Li et al. 2011) extend these genome-wide approaches to additional organisms, albeit with lower efficiency. Successful application of these two technologies was recently reported for C. elegans (Wood et al. 2011). The use of RNAi technology can circumvent some of these limitations as evidenced by gal-4 regulated tissue-specific RNAi in D. melanogaster and genome-wide whole animal RNAi screens in the nematode (Fraser et al. 2000; Kamath et al. 2003; Dietzl et al. 2007; Ni et al. 2008). However, RNAi often fails to yield a null state, to provide other variant alleles, or to determine complex epistastic interactions.
The advent of inexpensive whole genome resequencing provides a new path to genome-wide collections of mutated genes by identifying a wide variety of mutations across the genome using random mutagenesis. In pilot experiments we and others have shown that after standard ethyl methanesulfonate (EMS) mutagenesis a C. elegans strain contains several hundred point mutations and that these can be identified in a cost-effective manner through whole-genome sequencing (Sarin et al. 2008; Flibotte et al. 2010; Sarin et al. 2010). Based on these experiments we reasoned that systematic sequence characterization of a collection of 2000 mutagenized strains would identify multiple mutations in virtually every gene. This would provide the community with a resource where obtaining mutations in a gene of interest would be as simple as ordering a few strains from the stock center. Mutations of interest could then be placed in a reference background through simple outcrossing that takes only a week or two in C. elegans. At the same time, the large number of mutations in each strain allows comprehensive coverage of the genome in a relatively small number of strains, simplifying phenotypic screening and other manipulations. For example, the collection as a whole might also be screened using secondary treatments such as pharmaceutical reagents or RNAi to look for interacting genes.
We present here the results of our 2-yr project, in which we obtained the genome sequences for 2007 mutagenized strains. These contain more than 800,000 single nucleotide variants (SNV), 14,800 insertions and deletions (indels), and 1400 larger chromosomal rearrangements. In addition, we sequenced 40 different wild isolates, with a distinct mutational spectrum. Combined, the collection contains more than 1,450,000 substituted bases, as well as deletions that remove more than 5 million bases (Mb).
Results
Mutagenesis, sequencing, and variant detection
To generate a stable set of mutagenized strains, wild-type animals (VC2010, a derivative of the N2 strain of Brenner; Brenner 1974) were exposed to mutagen, and independent clonal lines were allowed to self-fertilize over 10 generations, driving the diploid genome to homozygosity (Fig. 1). This clonal growth may allow the fixation of modifier mutations that improve growth or even mask phenotypic effects of other mutations. Each F10 clone was expanded and used both to create a frozen stock and to prepare DNA for whole-genome sequencing.
Figure 1.

Experimental design. Standard mutagenesis protocols were modified by (1) selecting for unc-22/+ animals (twitching in 1% nicotine) in the F1 generation to ensure that the gametes had been effectively exposed to the mutagen; (2) counter-selecting in the F2 generation to generate an unc-22(+) background for the mutant strains; and (3) clonally propagating independent lines for 10 generations, driving strains to homozygosity to simplify variant calling and to create uniform, stable strains for further manipulations.
The mutagen was predominantly either ethyl methanesulfonate (EMS) (737 strains), N-ethyl-N-nitrosourea (ENU) (260 strains), or a combination of both (1000 strains) (Supplemental Table 1). EMS alone produced more SNVs on average than ENU, but with a highly biased distribution (90% GC→AT) that limited the range of amino acid substitutions. The combination of EMS and ENU yielded a higher number of SNVs than either mutagen alone and a less biased distribution of substitutions (80% GC→AT; Supplemental Table 2).
Each genome was sequenced to a target depth of 15-fold redundancy using paired end reads and massively parallel (Illumina) sequencing (MPS) (Supplemental Table 3; Supplemental Fig. 1). The resultant sequence reads were aligned with phaster (P Green, pers. comm.), which yielded slightly higher fractions of aligned reads than BWA (Supplemental Table 4; Li and Durbin 2009), and importantly also provided gapped and split reads flanking candidate deletion and insertion sites (see Methods). Homozygous SNVs were called from mpileup files generated by SAMtools (Li et al. 2009), requiring high-quality base calls and mapping alignments. Regions consisting of identical repeated sequences yielded only low mapping quality reads, an inevitable consequence of the short-insert/short-read strategy associated with MPS. Regions of apparently collapsed repeats with an excess of coverage also failed to yield variants. This effectively excluded regions covering ∼5% of the genome (see Methods for details; also Supplemental Fig. 2) from variant detection (false negatives). To reduce false positives we removed sites from consideration (see Methods for details) where (1) the called sequence differed consistently from the reference across all strains (suggestive of either errors in the reference or differences between the starting strain and the reference) (Supplemental Table 5); or (2) there was a high background of high-quality non-reference base calls (>1%) across our first 1546 completed strains, suggestive either of collapsed repeats within the reference or other alignment problems (Supplemental Fig. 3; Supplemental Table 6). These 111,866 broadly distributed sites, predominantly in intergenic and intronic regions (Supplemental Table 7), had the potential to yield apparent (false positive) SNV calls, presumably because by chance a strain might contain reads predominantly reflecting the non-reference base. After removing these “blacklisted” sites from consideration, the number of multiply hit sites was in much closer agreement with a Poisson distribution (Supplemental Fig. 4), and the percentage of GC→AT changes with EMS mutagenesis was close to the expected 90% (Supplemental Table 2; Coulondre and Miller 1977). This agreement with the expected suggests that the false positive rate is low, since false positives would not be expected to have this strong GC→AT bias.
We next created custom tools to analyze the phaster alignment data in order to identify insertions, deletions, and rearrangements from single base to chromosomal scale events. We used three different approaches that allowed detection of the full size range of indels (See Methods for details). In the first, we exploited the gapped read feature of phaster to detect small indels (one to 200 bases), again removing sites where the parent differed from the reference (Supplemental Table 8) and other frequently occurring events (Supplemental Table 9). In the second, we used the split read feature of phaster combined with read coverage to detect a larger class of indel events as well as densely clustered substitution events (See Methods for details). We combined these with the first class to produce a list of indels with defined end points. Finally, in a third approach, we used predominantly variation in read coverage as has been done in other studies (Bailey et al. 2002; Alkan et al. 2011) to detect large copy number variants (CNVs) (>5 kb) and likely chromosomal rearrangements.
For comparison, 40 wild isolates from around the world (Supplemental Table 10) were sequenced to a depth of >25-fold redundancy (Supplemental Table 3) and analyzed using the same tools.
By several tests, the alignment and filtering steps described resulted in a false positive rate of <1% and a false negative rate of ∼7% for SNV calls (Table 1). To examine the false positive rate we exploited available random Sanger sequence reads from the Hawaiian isolate CB4856 to see if SNV calls were validated by the Sanger reads (Wicks et al. 2001; DG Moerman, unpubl.). Of the SNVs identified in this strain by our pipeline, 25,902 have at least one long read with a high-quality alignment and base call; for 25,658 sites (99.1%), all the Sanger reads supported the SNV call. Only for 106 sites (0.4%) did all of the Sanger reads fail to support the SNV call. A similar analysis of short indels confirmed 3189 of 3212 called indels (99.2%). These results suggested a false positive rate of <1% for both SNVs and short indels. We also tested a sample of SNVs and indels by PCR and Sanger sequencing with results consistent with these low rates of false positives (see Methods and Supplemental Material for additional detail).
Table 1.
Validation
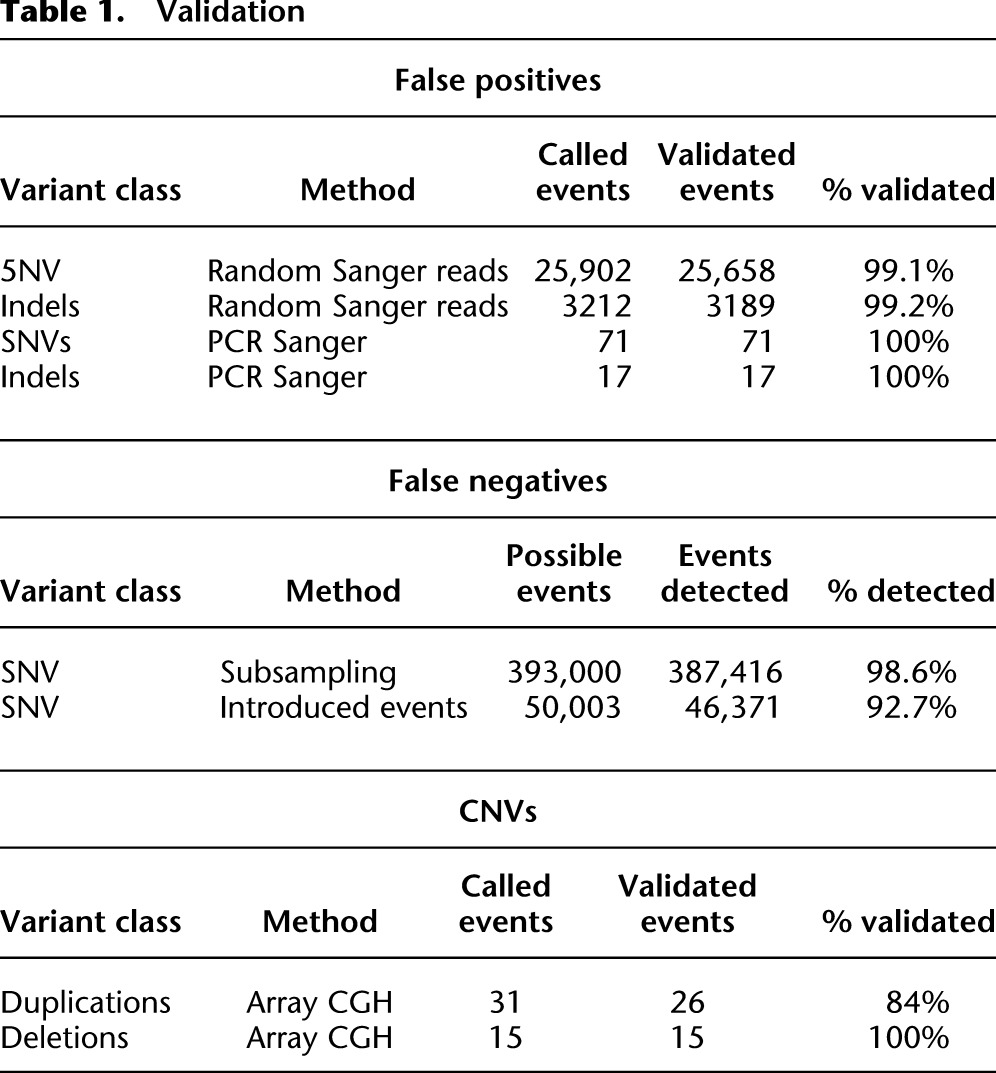
To determine a false negative rate we used two different approaches. To examine the impact of coverage on variant detection, we randomly subsampled reads from 10 strains with very high coverage (38 to 79×) and compared the detected SNVs at 15× coverage, iterating the procedure 100 times for each strain. The 15× subsampled projects detected on average 1.4% fewer SNVs than the full projects (Table 1; see Supplemental Table 11 for details), indicating that false negatives due to insufficient coverage were <2%. Examining the effects of different levels of coverage also suggests that there is little fall off in detection of SNVs at 12× coverage (Supplemental Fig. 5).
The above approach only measures the loss of SNVs detectable by the short reads of MPS. To look more broadly at false negatives we simulated 10 sets of mutated genomes containing a total of 5003 simulated SNVs (Table 1). Mapping reads from 10 random projects against each of the mutated genomes, we detected 46,371 of the 50,003 simulated SNVs (92.7%). Of the SNVs not detected, two-thirds fell in duplicated regions, where the MPS approach failed to yield high mapping quality reads. Most of the remaining 1032 events (2% overall) were not detected because of low coverage, in good agreement with the subsampling approach.
To evaluate the large CNVs detected by variation in read depth, we compared our calls with results from array-CGH for 16 deletions and 35 duplications in 24 strains (Table 1). The array data were in agreement with 15/15 of deletions (the array lacked probes in the region of one deletion), and 26/31 duplications were supported (four regions lacked probes). Some of the duplications not supported by the array-CGH data do have other supporting evidence. Further experiments will be required to resolve these few discrepancies.
The final result is a comprehensive description of each genome, within the limits of the technology, for 2007 mutant strains and 40 wild isolates (see Supplemental Table 12 for full description of events in each strain).
Observed changes in the nuclear genome
In toto the 2007 mutagenized strains contain 840,429 SNVs, representing 826,810 different mutational events, with an estimated false positive rate of <1% (Table 2A; Supplemental Material). These sites were almost uniformly distributed across the genome with a base change on average about every 120 bases (Fig. 2A). The only regions lacking SNVs were those repeated regions with only low mapping quality reads or no read coverage. Thus, the 2007 mutagenized strains harbor an average of more than 400 SNV mutations per strain, with a range from seven to 982 (strains treated with ultra-violet/trimethylpsoralen had a much lower mutation rate compared with EMS or ENU; Supplemental Fig. 6).
Table 2A.
SNV coding genes
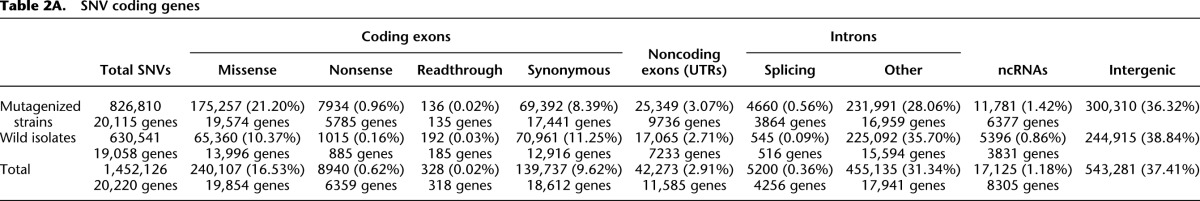
Figure 2.

Distribution of mutations along chromosomes. (A) SNV density is plotted across chromosomes I and X for the aggregate variants for mutant strains (Mu) and the wild isolates (WI). The SNV density is essentially uniform along the length of both the autosome and X chromosome in the mutant strains. In contrast, for the wild isolates SNV density on chromosome I is much higher on the arms, where recombination is high and gene density is in general lower than in the centers, where recombination is low and gene density is higher. SNV density along the wild isolates' X chromosome is more uniform. (B) Similar density plots for all short indels and (C) only those outside of homopolymer runs. There is enrichment for short indels on the autosomal arms of both the WI and mutant strains, although this is much more pronounced for the WI. However, the distribution in the mutant strains is much more uniform when only considering the small indel events that do not involve homopolymer runs. The bias toward higher density on the autosomal arms remains for the WI.
The distribution along the chromosomes of naturally occurring SNVs from the wild isolates differs dramatically from the induced mutations. We detected 3,789,728 SNVs in toto across the 40 wild isolates, but these consist of only 630,541 unique events, presumably reflecting the shared ancestry of these strains and selective sweeps (Table 2A; Andersen et al. 2012). These SNVs are up to 10-fold more frequent on the chromosome arms compared with the centers (Fig. 2B). This bias was not seen for the X chromosome. The very different distribution between mutagenized strains and wild isolates likely results in part from background selection (Cutter and Payseur 2003; Rockman et al. 2010), but also may reflect elevated rates of mutation associated with higher recombination, difficulties in alignments on the arms, and selective sweeps. These data provide a rich source for analysis of population genetics in C. elegans.
In addition to SNVs in the mutagenized strains, we identified (1) 17,333 total indels with defined end points (12,321 deletions, 5012 insertions), reflecting 14,881 unique changes (10,420 deletions, 4461 insertions) (Table 2B; see also Supplemental Fig. 7 for length distribution); (2) 1483 large CNVs, of which 1222 are distinct, in 887 strains. (Supplemental Table 1; see Fig. 3 for an example). The indels were distributed throughout the genome but with an overrepresentation on the autosome arms (Fig. 2B). A large fraction of the indel events involved homopolymer runs, which are overrepresented on the arms in the reference sequence. If these are removed, the remaining indels show a more uniform distribution (Fig. 2C). Similarly, normalizing for the number of target homopolymer runs removes the bias (data not shown). The large CNVs also showed a relatively uniform distribution (Supplemental Fig. 8). We also detected several strains with underrepresentation of the X chromosome relative to autosomes, which proved to result from an abundance of male (XO) animals in the populations (see details below). The homozygous indels remove a total of >2 Mb across the 2007 mutagenized strains. The large CNVs impact even more of the genome—more than 300 Mb were duplicated and >35 Mb deleted, although many of the deletions are not homozygous (see below: Heterozygous Regions).
Table 2B.
Indel coding genes
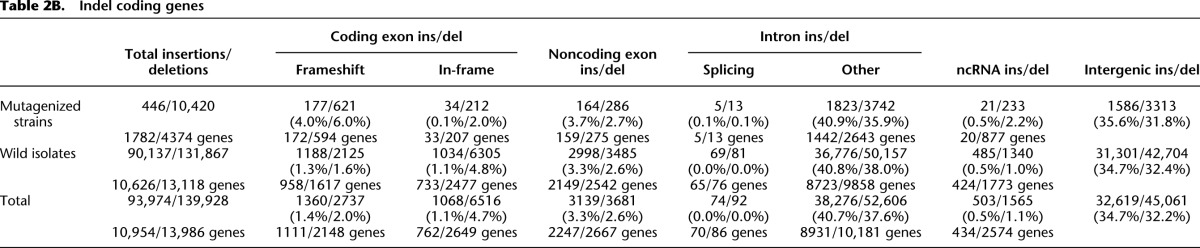
Figure 3.

Large duplication and deletion events. (A) A large duplication of the right half of chromosome II and a deletion within that region (red circles) were detected by increased (duplication) or decreased (deletion) read depth (see Methods for details). Dashed vertical lines demark the change from normal copy number. The boundaries of the arms are indicated by the asterisks along the x-axis. (B) The fraction of reads containing a variant base is plotted across chromosome II for the same strain. Although on the left half of the chromosome, SNVs show essentially 100% of the reads with the variant base, in the region of the duplication the fraction drops <80% for most sites, reflecting the heterogeneity of the sites. The underlying event may represent a translocation event (the right end of chromosome I in this strain is also duplicated) maintained because it provides a function lost from a lethal mutation on the normal diploid chromosome. (C) Distribution of duplication (blue) and deletion (red) events on chromosome II in the 2007 mutant strains. Each segment represents a distinct event present in one or more of the strains. The duplication events predominate and both duplications and deletions are broadly distributed across the chromosomes (see Supplemental Fig. 8 for similar plots for all chromosomes).
The indel and large CNV events were much more extensive in the wild isolates. Each of the 40 wild isolates had thousands of indels relative to the reference sequence, totaling >1.2 M events. However, reflecting the common origins, this represented just 222,004 distinct indels, and even these were often overlapping, with slightly different end points. Accounting for this redundancy, the deletions removed a total of 3.7 M in 107,417 blocks. As with the SNVs, these were most frequent on the arms, removing >40% of some 1-Mb windows on chromosomes I and V.
Inferred effects of the variants in the mutant set
We mapped the observed mutagen-induced events to the annotations of the worm genome derived from WormBase (version 230) (Yook et al. 2012) to infer their likely effects. Of the 826,810 unique SNVs, 257,379 (31.0%) fall in protein-coding sequence with 175,257 (21.2%) of these altering the encoded amino acid (Table 2A; Fig. 4). Notably, 7934 (0.96%) mutations represent chain-terminating (nonsense) mutations and 4660 (0.56%) affect the canonical GT/AG splice junction sites, together providing potential null alleles in a total of 8150 protein-coding genes. Altogether, 20,115 genes have at least one SNV. Of this total, 19,666 genes contain one or more nonsynonymous (NS) changes or an altered splice site across the 2007 strains, and 18,644 genes have two or more such events. On average, there are more than eight nonsynonymous SNVs per gene.
Figure 4.

Mutation effects (SNVs) in mutant strains and wild isolates. The inferred effects of the SNVs in the mutant strains and wild isolates are plotted, showing the disparity in the fraction of mutations affecting coding sequence. Mutations resulting in nonsynonymous, nonsense, and splice site changes are three to 10-fold less frequent in the wild isolates, whereas synonymous changes are similar in number between the two. In addition, the number of mutations in intronic regions is similar between mutant and WI collections, but both UTR and intergenic sites are less abundant in the WI strains.
To determine which classes of mutational events may have been selected against in our mutation protocol, we compared the frequency of observed events to a model of expected events. For our model of expected events we focused on GC→AT changes, because these comprise ∼80% of all SNVs and the effects are readily determined. Most obviously, the frequency of observed nonsense mutations was depressed compared with expected (Fig. 5A). This depression (∼45%) is greater than predicted based on essential genes (∼15%–25% of all genes), perhaps reflecting the fact that we avoided animals with obvious visible phenotypes, e.g., strong Uncs or Dpys, in our mutagenesis protocol, or the deleterious effects of nonsense mutants in additional genes in these mutagenized backgrounds. In agreement with this we see a small decrease in the fraction of highly conserved genes with nonsense alleles compared with genes overall, but no difference at other levels (see Supplemental Fig. 9). Remarkably, there is little difference from expected in the other categories of events, suggesting that only rarely are mutations of these classes incompatible with life.
Figure 5.

Relative fractions of SNVs in different annotated features in the mutants and wild isolates. (A) The fraction of events observed in different annotated features compared with expected is shown for the mutant collection and the wild isolates. To facilitate comparison, the events have been normalized to synonymous mutations in both sets. In the mutant strains only the nonsense mutants are appreciably depressed as a fraction of expected. In contrast, in the wild isolates, nonsense SNVs are even more severely depressed and missense, splice junction, and to some extent even intergenic SNVs are depressed relative to the expected. (B) The fraction of events in different annotated features for a set of essential and nonessential genes is shown for the mutant set and wild isolates. Genes with deletion alleles produced by the The C. elegans Deletion Mutant Consortium (The C. elegans Deletion Mutant Consortium 2012) were divided into essential (lethal) and nonessential (viable) groups. The fractions of events in essential and nonessential genes within the mutant set are quite similar for all features but nonsense SNVs. The same is true for the wild isolates, but as expected from A the overall proportions are reduced.
The indels in the mutant strains, although much less common than the SNVs, also impact the protein-coding genes. Of the 14,881 indels, 1062 overlap protein-coding genes, with 869 (5.8%) altering the reading frame, deleting a splice junction, introducing a stop codon, or removing a large portion (≥20 amino acids) of the gene (Table 1).
Inferred effects of the variants in the wild isolates
The naturally occurring SNVs have a distinct spectrum when compared with the mutagen-induced spectrum. Of the 630,541 different events, 137,528 (21.8%) fall in protein-coding sequence, but only 65,360 (10.37%) change the encoded amino acids (Table 2A; Fig. 4). Only 1015 (0.16%) result in nonsense mutations and 545 (0.09%) alter splice junction sequences. In turn, only 14,602 genes have at least one NS change or an altered splice site and 9735 have two or more events. The distribution of NS mutations across the chromosomes in the wild isolates mirrors that of the total mutations, as does that of synonymous sites. Since alignment to genes is generally more reliable, these results suggest that alignment problems are not a major contributor to the overrepresentation of SNVs on the arms in the wild isolates.
Comparing the wild isolates to the expected set highlights the differences with the mutant set (Fig. 5A). Nonsense mutations are depressed by 90%, suggesting that nonsense alleles in most genes, while compatible with life in the lab, are strongly selected against over evolutionary time. This difference may be even greater than shown here since inspection of several of the nonsense alleles in the wild isolates reveals that they fall toward the ends of genes, in alternatively spliced exons or exonic portions of WormBase models that are not supported by RNA-seq data (Gerstein et al. 2010; L Hillier and RH Waterston, unpubl.). Concordant with this observation, genes with nonsense alleles in the wild isolates are strongly biased toward genes without conservation and away from conserved genes (see Supplemental Fig. 9a). This does not result only from the overall biased distribution of SNVs, since the bias is observed in comparison of just genes on the arms (see Supplemental Fig. 9b). Also in contrast to the mutant set, splicing variants are strongly depressed and missense changes are only ∼60% of expected, reflecting the selective importance of these features. Both UTR and intergenic sequences also show mild depressions, presumably reflecting the presence of important regulatory signals and other functions in these features.
The wild isolate indels are relatively more abundant compared to their counterparts in the mutant strains (Table 2B). They change the reading frame, disrupt splice junctions, introduce stop codons, or remove large portions or all of 2466 genes. Given their distribution, these affect primarily genes on the chromosome arms, with many members of the 7-TM families, math, bath, and other rapidly evolving gene families heavily impacted.
Essential and nonessential genes
The failure to find a reduction in the frequencies of classes of events other than nonsense mutations in the mutant set could reflect the high proportion of nonessential genes, effectively masking signals from essential genes. To examine this we compared the frequencies of classes in essential versus nonessential genes. We used known deletion alleles as the source of both essential and nonessential genes, reasoning that this set, although small, was less likely to contain spurious results (The C. elegans Deletion Mutant Consortium 2012). Surprisingly, the proportion of missense and splice site mutations was very similar for essential and nonessential genes in both the mutant collection and wild isolates (Fig. 5B). However, nonsense alleles were more prevalent in the nonessential genes in both sets. Thus, the large differences in proportions of different kinds of mutations seen between sets were found almost equally in essential and nonessential gene sets.
To examine these biases in a specific set of nonessential genes, we chose the twk gene family (four transmembrane potassium channels) with 45 members in WormBase. RNAi for any of these genes fails to produce a phenotype, although missense alleles of some family members are known that create movement defects (these revert to wild type through loss-of-function mutations) (Salkoff et al. 2005). The mutant strains have 599 nonsynonymous mutations in the 45 genes, representing 580 distinct sites, including 35 nonsense alleles (29 distinct sites) across the 45 genes. In contrast, the wild isolates contain just 92 nonsynonymous alleles with a single nonsense change. Thus even in this nonessential gene set the variability present in the mutant collection greatly exceeds that available in the wild isolates, presumably reflecting the effects of selection in the wild populations.
Heterozygous regions
Despite the extensive inbreeding after mutagenesis, we found evidence for heterozygous mutations. These regions were characterized by multiple nearby sites with intermediate levels (20%–80%) of reads supporting a non-reference base and few or no intervening sites with >80% of the bases disagreeing with the reference (nominally homozygous sites). Altogether we identified 550 blocks of 10 or more SNVs across 450 strains, containing 24,596 sites in toto (Supplemental Table 13). Although a few such regions might persist by chance despite the extensive selfing, their frequency made us look for other causes. Some of the heterozygous regions fell in segments that contained large duplications, and presumably represented a change in one copy but not in others (Fig. 3). In addition, other regions contained pairs of loss-of-function mutations associated with essential genes that might be on opposite homologs and might thus act as balancing mutations, preventing the emergence of homozygotes in the absence of recombination. Altogether these regions contained an additional 608 nonsense and 227 splice site-altering mutations. Generally, we do not know the phase of different SNVs in the heterozygous regions, although for some regions associated with candidate translocations the proportional representation of SNVs can suggest phase. Inspection of the progeny of 22 strains representative of the different types of heterozygous regions showed that the strains were segregating different variants, confirming the presence of heterozygous regions.
Tandem repeat copy number
Long tandem direct repeats have long been considered unstable due to unequal crossing over, a phenomenon that might be enhanced by double stranded breaks induced by mutagens. The largest tandem repeat in the C. elegans genome is the 7.2-kb rDNA gene cluster on the right arm of chromosome I, just inside the telomere and containing an estimated 80–100 copies (Sulston and Brenner 1974; The C. elegans Sequencing Consortium 1998). We used normalized read counts as a measure of copy number and found that while most strains had between 55 and 130 copies, some strains were inferred to have as few as 33 copies and others as many as 245 copies (Fig. 6). Similarly, the 110-copy 1-kb 5S repeat cluster on chromosome V (Nelson and Honda 1985) showed a wide range in copy number. Most strains had between 130 and 210 copies but the range extended from 39 to 438 copies (Fig. 6). Using similar methods to estimate telomere copy number, we found most strains contained between 60 and 300 copies of the hexamer repeat per telomere, but the range was from 22 to about 1400 copies (Supplemental Fig. 10). The wild isolates showed even greater variations in rDNA (Supplemental Fig. 11) and telomere copy number. Fluctuations in telomere copy number in C. elegans have previously been described but not to this extent (Ahmed and Hodgkin 2000). We found a weak correlation in rDNA and 5S repeat number, but no correlation for either of these repeats to the telomere repeat number. We also failed to find any mutant genes overrepresented in the extreme strains.
Figure 6.

rDNA copy number varies between strains. The number of copies of the 18S–28S repeat and the 5S repeat is illustrated as estimated by the fraction of reads mapping to the regions. Ninety-two percent of the strains have between 55 and 130 copies of the 18S–28S repeat and 93% have between 130 and 210 copies of the 5S repeat, with extreme outliers for both regions (33–245 and 39–438, respectively).
Alterations in the mitochondria encoded genome
The mitochondrial genome in C. elegans is 13,794 nucleotides (nt) in length (Okimoto et al. 1992) with an estimated average of 40–80 copies per cell (Tsang and Lemire 2003). This high copy number makes it much less likely that induced changes have become fixed in the population so that detection is complicated by the continued presence of the wild-type allele. Nonetheless, we have identified several fixed changes in the mitochondrial genome in this study—at least two SNPs and 13 (three mutant and 12 wild-isolate) small indels. In addition, we identified at least 17 larger indels (179 bp–4185 bp) in the mutant strains where the wild-type sequence was also present. Several examples of heteroplasmic deleted and duplicated regions from the mutant set are illustrated in Figure 7. All are accompanied by the reference version, but in a few cases the reference version forms only a small proportion of the overall population.
Figure 7.

Deletions and duplications in the mitochondrial genome. The coverage of the mitochondrial genome in five mutant strains is shown in a UCSC Genome Browser display, along with the gene content below. Although there are hundreds of copies of the mitochondrial genome in the zygote, both deletions (red bars) and duplications (green bars) were detected in the mutant strains. None of these were fixed in the strains, with both normal and altered length molecules detected in all cases.
Phenotypes
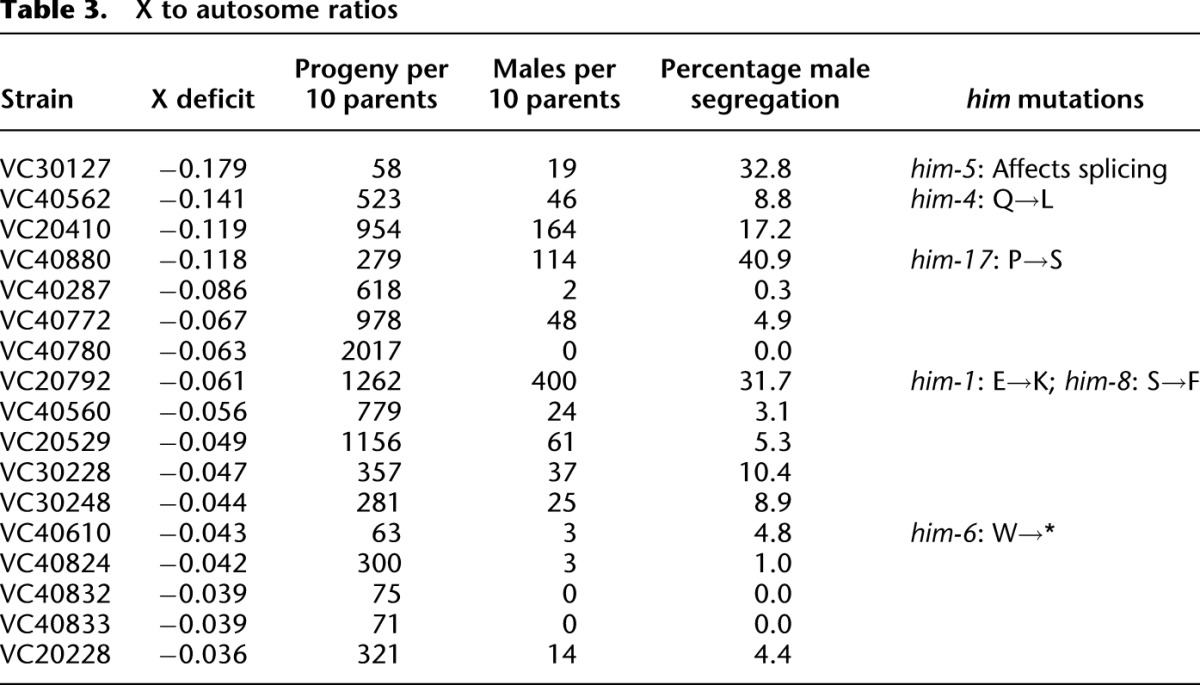
One long-term value of the resource will be the association of particular mutations with phenotypic changes, thus providing insights into the role of each gene in the physiology of the worm. While in most cases this will require direct examination of the animals, some phenotypes can be inferred directly from sequence analysis. Among these are him (high incidence of males) mutations that result in a higher fractions of males in the population, reducing the overall representation of the X chromosome. As described above several strains showed a depletion of the X chromosome relative to autosomes. Reinspection of these strains showed that 13 of 17 strains surveyed had an increased incidence of males in their progeny (Table 3). Of the 13 strains segregating males, five have mutations in him genes. The remaining eight strains include three with autosomal duplications that might alter the X:autosome ratio and could interfere with X chromosome segregation. The others have neither large rearrangements nor mutations in known him genes, suggesting that they have variants in new genes important for normal X segregation.
Table 3.
X to autosome ratios
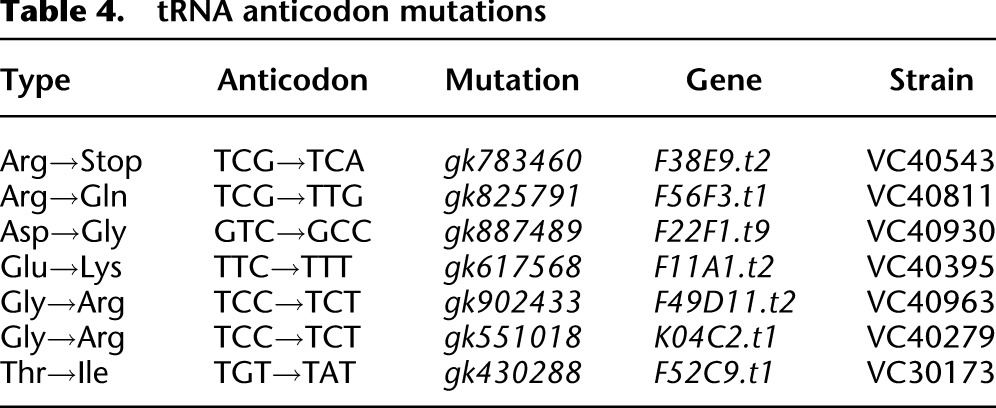
Suppressor tRNAs can also be detected directly by sequence analysis. We have identified 731 mutations in 418 of the 631 annotated nuclear encoded tRNA genes. Sixteen of these mutations are within the anticodon (Table 4). Six of these could potentially change the amino acid inserted and one leads to an anticodon for the opal UGA stop codon. We tested this potential UGA suppressor against opal nonsense alleles discovered in this project and found it suppressed unc-29 (gk856699) in the strain VC40869. The other altered tRNAs might act as missense suppressors.
Table 4.
tRNA anticodon mutations
Mutations in DNA repair genes might also lead to a molecular phenotype. We noted that some strains had unusually high numbers of small indels. For example, eight strains had more than 100 small indel events and three of these had more than 400 (Supplemental Table 15; overall mean of 8.6 per strain); perusal of their mutations revealed six strains with loss-of-function alleles in genes associated with elevated mutation rates in worms (four alleles of mlh-1 and two alleles of msh-6) (Tijsterman et al. 2002; Pothof et al. 2003) and whose homologs are associated with mismatch repair in yeast and humans. One of the remaining strains has a mutation in msh-5, a gene previously associated with chromosome pairing (Bhalla et al. 2008) but not with higher mutation rates. The remaining strain has no obvious candidate gene, so may reveal another gene with a mutator phenotype.
An interactive website
All the variant data from this project have been submitted to WormBase; however, we thought it would be valuable to provide a standalone searchable website (http://genome.sfu.ca/mmp) to allow users to readily find all the mutations in a particular gene or groups of genes across all 2007 mutagenized strains or conversely to find all the mutations in any particular strain (Supplemental Fig. 13). Both SNVs and indels are included in the data set and the user can search for classes of mutations, e.g., to exclude synonymous mutations or to selectively search for mutations resulting in premature stop codons, missense mutations, etc., and also for various types of genome features including exons, introns, UTRs, intergenic regions, and noncoding RNAs. The results page reports the position of a mutation within the protein, various measures of the likely impact of the mutation, and the affected protein domain, if any. We also provide tools to search mutations affecting specific protein domains or specific intervals on any chromosome to allow a fine scale search within regions of interest such as a putative promoter region. Search results can be downloaded in a simple text-based format for further processing. Since this collection of mutations might be of interest to researchers working on homologous genes in vertebrates, the website also allows a simple search to identify mutations in C. elegans homologs of human genes.
Discussion
By sequencing 2007 mutagenized strains, we have generated a community resource that contains multiple alleles for most genes, potentially providing allelic series that could be valuable for studying function in detail. More than half the genes have potential loss-of-function alleles in the collection, either from nonsense, splice junction or deletion mutations. Combined with the deletions generated by the Deletion Consortium (The C. elegans Deletion Mutant Consortium 2012) and the additional mutations found in the wild isolates, potential loss-of-function alleles are now available for 13,760 of 20,514 protein-coding genes identified in this organism.
The data are available through WormBase (http://www.wormbase.org) and at our dedicated website (http://genome.sfu.ca/mmp) so that users can simply check the gene or region of interest for mutations of any class and then order the strains from the Caenorhabditis Genetics Center (http://www.cbs.umn.edu/cgc), where all the strains have been deposited. Backcrosses can quickly place the mutations of interest in a wild-type background, and mutant animals can be examined for phenotypic alterations. Causative mutations should be readily identifiable using standard mapping protocols for C. elegans. The availability of mutations should reduce the threshold for researchers outside the worm field to study the function of homologous genes; for these users the website provides a tool that supplies the mutations for the worm orthologs of human genes of interest.
The several candidate mutants we identified illustrate the potential utility of the resource. Simply by scanning for differences in X:autosome ratios, altered tRNA anticodons, and elevated deletion numbers, we found possible causative mutations in known him genes, an opal suppressor mutation and multiple mutations in genes implicated in DNA repair, as well as strains with likely new genes affecting these phenotypes. Screening the collection for other well-studied or novel phenotypes to identify new and uncharacterized genes affecting a phenotype may be one of the major uses of the collection. The collection also includes events altering the mitochondrial genome. The larger deletions, duplications and potential translocations may also provide tools for geneticists.
The collection as a whole may also prove useful in screening for phenotypes of interest or for studying gene–gene interactions and gene–environment interactions. For this purpose, kits containing all the strains in a 96-well format are being prepared for distribution. For example, RNAi for particular genes might be used against the strains, similar to the experiments of Lehner et al. (2006). Alternatively, drugs or other environmental variables might be used. Because each strain contains multiple mutations, each RNAi experiment would test several genes in parallel. To screen for interactions on a larger scale, competitive growth in pools of multiple strains could be used as a surrogate for the phenotype of interest, as has been done in yeast (Tong et al. 2004). The abundance of each strain in the pool could then be assayed using molecular inversion probes (MIPs) (Hardenbol et al. 2003) for the unique mutations in each strain to quantify the proportions of each strain. Strains showing evidence of interaction, either positive or negative, would need to be outcrossed to determine the interacting mutation, but candidates might become apparent simply by comparing the content of different interacting strains either for common genes or pathways.
Our tests show that the false positive rate is <1%. This low rate was possible in part due to the stringent criteria used, enabled by the consistently deep sequence coverage. But with just these stringent criteria the number of multiply hit sites was higher than expected by chance and had a GC→AT fraction lower than expected for EMS, even after removing sites that clearly differed between the reference and the parent strain used for mutagenesis. These multiply hit sites were characterized by an elevated level of non-reference base calls across all strains, with only the occasional strain having enough non-reference base calls to reach our thresholds. We suspect these sites, apparent when sequencing hundreds of strains, have bedeviled prior studies, leading to false positives and possibly even reports of high spontaneous mutation rates (Sarin et al. 2010).
The false negative rate was estimated to be ∼7%, with most of this resulting either from repeated sequences within the genome that prevent confident mapping of MPS reads or from insufficient coverage. Some additional false negatives resulted from regions with excessive numbers of mapped reads, presumably reflecting collapsed repeats in the reference sequence relative to the parent strain.
In addition to the single base differences, deletions and insertions of various sizes have been detected for each strain along with likely rearrangements and persistent heterozygous regions. The expectation that most events were homozygous simplified the problem compared with outbred organisms, but equally important was the ability of phaster to report accurately both gapped reads and split reads that bridged indels. By carefully parsing these reported events into those expected with deletions and insertions, and again eliminating those associated with the parent and other artifacts, we produced a set of confidently predicted indels for each strain. Although many fewer in number than the SNVs, the total number of bases altered is larger, so users must consider these differences as well when seeking the source cause of a particular phenotype. Nonetheless, large insertions of novel sequence relative to the reference and more complicated events involving combinations of insertion and deletion events remain incompletely described here. These probably will require de novo assembly methods to provide full, accurate descriptions of these events.
For completeness, for each strain we provide a list of the detected, commonly variant sites, presumptively uninduced or false positives, so that users may take these into consideration in evaluating background effects (Supplemental Table 16; also available at http://genome.sfu.ca/mmp/). Users should also be aware that additional mutations lie in repeated regions that we failed to detect.
The 40 wild isolate strains together provided almost as many SNVs as the 2007 mutagenized strains, and the two sets combined contain ∼1.5 M SNVs and have a total of 5 Mb deleted. However, in contrast to the mutant set, which shows an almost uniform distribution of events, the overall distribution of SNVs in the wild isolates is highly biased, with the bulk of observed differences on the autosomal arms and relatively few changes found in the gene rich centers of the autosomes.
The comparison of the spectrum of mutational effects between the mutant and wild isolate sets and with a model of expected events demonstrates directly that relatively few mutations (the exceptions are nonsense mutations) are incompatible with life in the lab, whereas over evolutionary time many classes of mutations are selected against, about equally in essential and nonessential genes. These findings may help interpret human variation, comparing the spectrum of recent, rare variation and longer-standing, common variation (Fu et al. 2013). The much larger numbers of mutations with likely functional consequences in the mutation collection make it preferable for systematic study of function.
One obvious deficit of the current collection is the lack of strong alleles of essential genes. To remedy this, one might use balancer chromosomes to maintain lethal mutations (Chu et al. 2012). Indeed, some balanced strains fortuitously appear within the collection with a higher proportion of nonsense alleles. Alternatively, F1 animals might be minimally propagated before freezing and DNA isolation. Either approach would require the detection of heterozygous mutations and thus greater sequencing depth. The former has the advantage of generating stable stocks, but the disadvantage that particular starting strains would be required and for each only a fraction of the genome would be balanced and a target for lethal mutations. The latter approach would screen the entire genome but the resource would be unstable, with the representation of the lethal allele decreasing at each generation. Nonetheless, pilot experiments have demonstrated its feasibility (DG Moerman and RH Waterston, unpubl.).
Conditional alleles of essential genes, such as temperature-sensitive alleles or nonsense alleles in the presence of a nonsense suppressor, offer a different approach. Strains would be stable and genes across the genome would be targets. Because of their potential value we have acquired temperature-sensitive embryonic lethal strains from several investigators and begun sequence analysis (O'Rourke et al. 2011). How many different mutated genes are represented in these collections is unclear, and more fundamentally the fraction of essential genes that can yield conditional alleles remains unknown.
The overall approach of sequencing mutagenized lines might also be extended to other species. C. briggsae is an obvious candidate, sharing with C. elegans the hermaphroditic mode of propagation and storage by freezing, both important features for minimizing the effort required to generate the mutagenized strains. The existence of a similar resource for C. briggsae would propel investigations forward, allowing deep comparisons of gene function in these anatomically similar but evolutionarily diverged organisms.
The resource we describe here is unique for a metazoan and was simplified by the ability to store C. elegans as frozen stocks and to manipulate large numbers of strains simultaneously. We hope that the resource will not only be of use to those focused on particular genes, but will also entice researchers to take a more global approach and study the set as a whole. Only then will we uncover the subtleties of gene interactions at the molecular and cellular levels.
Methods
Nematode culture, mutagenesis, DNA extraction, library preparation, sequencing, and alignments
Mutagenesis was carried out using VC2010, a local subculture of the standard laboratory strain N2 (Brenner 1974) with either ethyl methanesulfonate (EMS) (Sulston and Hodgkin 1988), N-ethyl-N-nitrosourea (ENU) (De Stasio and Dorman 2001), trimethylpsoralen/UV (UV/TMP) (Flibotte et al. 2010), or with an EMS/ENU cocktail. F1 animals were screened in 1% nicotine (Moerman and Baillie 1979) to ensure mutagenesis and propagated through F10, with single F10 animals used to establish strains for DNA isolation and frozen stocks as shown in Figure 1. Genomic DNA from mutant strains and 40 wild isolates (Supplemental Table 10) was extracted as described earlier (Flibotte et al. 2010), and libraries prepared for sequencing using a modified Illumina protocol using only one addition of Agencourt AMPure XP beads per sample through Y-adaptor ligation. Multiplexed libraries were sequenced with Illumina GAII/HiSeq technology, and clusters passing default quality filters were demultiplexed using a custom perl script. Raw FASTQ files from each strain were aligned to build WS230 of the C. elegans genome (www.wormbase.org) using the alignment program phaster (P Green, pers. comm.) or BWA version 0.5.9 (Li and Durbin 2009) for comparison. All reported variants were generated using phaster (see Supplemental Material for details).
Variant detection
After removing putative PCR duplicates using SAMtools 0.1.18 (Li et al. 2009), aligned reads were used to detect single nucleotide variants (SNVs), insertion/deletion variants (indels), and larger copy number variants (CNVs). To detect homozygous SNVs we used the SAMtools suite (mpileup, bcftools, vcfutils.pl) to extract locations with at least 3× coverage, at least 80% consensus variant allele, and a root mean square (RMS) mapping quality of at least 30. To eliminate parental–strain differences with the N2 reference (see Supplemental Table 5) as well as false positives at sites prone to high non-reference base calls (see Supplemental Fig. 3), we filtered out sites at which >1% of all phred ≥30 aligned bases in our first 1546 strains disagreed with the reference allele (Supplemental Table 6). Heterozygous SNVs were similarly extracted and filtered using sites with at least 6× coverage and between 20% and 80% variant reads, and were clustered into blocks to identify likely heterozygous regions: Analysis of the heterozygous calls led to the discovery of 54 strains with large numbers of calls scattered across each chromosome, likely due to cross-contamination (Supplemental Table 17; see Supplemental Material for details).
We used two different methods to detect indels. For small events (<200 bp) we used a two-step process. In the first step we scanned the SAMtools mpileup for candidate genomic locations with ≥25% “gapped” reads and having ≥5× coverage (or with >60% gapped reads and ≥3× coverage). In the second step to remove alignments due to local repeats at the boundaries of the event, we considered only reads that extended beyond the shortest gap read (“informative” reads; see Supplemental Methods for specific criteria) having mapping quality ≥20 and base quality ≥15 at the indel. Of these sites, an indel was called if it was covered by at least four informative alignments (or three if in a run of 3 bp or fewer), where >40% of all reads were informative with RMS mapping quality >40, of which 80% confirmed the indel. As in the case of SNVs, we excluded sites likely to have arisen in the parent strain (see Supplemental Table 8) or from problems particular to the use of Illumina technology: We required that a candidate site average 1× coverage across all strains and that it be detected in <10% of all alignments generated by all mutagenized strains. Indels classified as neither mutagen-induced nor parental are available for review (see Supplemental Table 9; parent–strain analysis was not performed for wild isolate strains) (see Supplemental Methods for additional details).
To detect intermediate (100–5000 bp) deletion/duplication events, as well as regions of dense variation, we relied on “split” reads generated by phaster, which occur when a single sequence generates two alignments, each nucleated in the clipped sequence of the other. The order, orientation, and alignment span of these split reads was used to infer genomic events, i.e., mates spanning a deletion should maintain their order and orientation (see Supplemental Fig. 12). For each strain we catalogued all breakpoint relationships confirmed by at least four split reads (excluding sites seen in >20 mutation strains). Implied deletions ≥100 bp having <2× coverage (or <100 bp with <4× coverage) were included in the final annotations, provided the normalized coverage was one quantile below the normalized mean coverage across all strains; for implied duplications we required that the coverage be two quantiles higher than the average (see Supplemental Methods for details).
For larger CNVs we used variation in read coverage as has been done in other studies (Alkan et al. 2011), counting properly aligned read pairs in 10-kb bins, shifted 1 kb across each chromosome and normalized to the total number of read pairs in each strain. For each bin we found the median number of alignments across 1874 well-behaved mutagenized strains as well as the 10th and 90th percentiles (“qdevs”). For each strain we then used a maximal scoring segment algorithm to identify regions with qdevs either sufficiently above the expected (copy number gain) or sufficiently below (copy number loss) after normalizing for strain-specific baseline variation from the global qdev values.
We used read depth in two additional ways. First, we were able to detect strains with lower than expected coverage of the X chromosome from the ratio of X to autosomal alignments in each strain compared with the X:autosomal base pairs in WS230. Second, we estimated the copy number of the chromosome I rDNA region for each strain by comparing the genomic fraction of the repeat region in WS230 to the fraction of reads aligning to the region; we performed similar calculations to estimate the length of the chromosome V rDNA repeat as well as the average telomeric size (see Supplemental Methods for details).
Assigning the variants to features
SNVs and small/intermediate indels were annotated using custom perl scripts similar to those previously described (Flibotte et al. 2010), integrating GERP++, phyloP, and phastCons scores when available (Siepel et al. 2005; Davydov et al. 2010; Pollard et al. 2010) (See Supplemental Methods for details).
Validation of selected SNVs, indels, and a nonsense suppressor
In addition to using the Sanger reads from the Hawaiian strain CB4856, the subsampling of reads from projects with high coverage and the introduction of alterations in the reference to mimic SNVs (see Supplemental Material for details), we validated sample SNVs and small indels using PCR and Sanger sequencing. PCR reactions were performed with standard conditions and submitted to the UBC NAPS Unit for Sanger sequencing, confirming 17/17 predicted indels and 71/71 predicted SNVs. CNVs were validated using CGH according to standard procedures (Maydan et al. 2007) using VC2010 for reference, confirming 15/15 covered deletions and 26/31 covered duplications. See Supplemental Material for details.
The putative UGA suppressor, gk958112, found in the anticodon of an X-linked tRNAArg, was tested for suppression of UGA nonsense codons in unc-16, unc-29, unc-34, unc-40, unc-50, unc-57, and unc-68 found in this project. Of these, unc-29 (gk856699) was incompletely and variably suppressed by the homozygous gk958112 allele (see Supplemental Methods for details).
Data access
Raw sequencing data from all 2007 mutant strains and 40 wild isolates are available from the NCBI Sequence Read Archive (SRA; http://www.ncbi.nlm.nih.gov/sra) under accession number SRP018046. The strains have been deposited at the Caenorhabditis Genetics Center and the variant calls are being deposited in WormBase. The latter are also available at our website: http://genome.sfu.ca/mmp/.
Note added in proof
Follow up investigations revise the percent validated CNV duplications in Table 1 from 84% to 93%.
Acknowledgments
We thank Asher Cutter and Marie-Anne Felix for advice on wild-type strains and Asher Cutter for providing some of the strains used in this study. We thank Phil Green for providing the program phaster and for advice on DNA analysis; Choli Lee, Eric Phillips, and Amber High for help with sequencing; Calvin Mok for helpful comments on the analysis and manuscript; and Peter Good for his wise administrative counsel. We also thank the reviewers for their helpful suggestions. The work in the D.G.M. laboratory was supported by the Canadian Institute for Health Research and the NHGRI (through R.H.W.). D.G.M. is a Senior Fellow of the Canadian Institute for Advanced Research. The work in the R.H.W. laboratory was supported by an ARRA GO grant HG005921 from NHGRI and by the William H. Gates Chair of Biomedical Sciences. The work in the H.H. laboratory was supported by CIHR and NSERC.
Footnotes
[Supplemental material is available for this article.]
Article published online before print. Article, supplemental material, and publication date are at http://www.genome.org/cgi/doi/10.1101/gr.157651.113.
Freely available online through the Genome Research Open Access option.
References
- Ahmed S, Hodgkin J 2000. MRT-2 checkpoint protein is required for germline immortality and telomere replication in C. elegans. Nature 403: 159–164 [DOI] [PubMed] [Google Scholar]
- Alkan C, Coe BP, Eichler EE 2011. Genome structural variation discovery and genotyping. Nat Rev Genet 12: 363–376 [DOI] [PMC free article] [PubMed] [Google Scholar]
- Andersen EC, Gerke JP, Shapiro JA, Crissman JR, Ghosh R, Bloom JS, Felix MA, Kruglyak L 2012. Chromosome-scale selective sweeps shape Caenorhabditis elegans genomic diversity. Nat Genet 44: 285–290 [DOI] [PMC free article] [PubMed] [Google Scholar]
- Bailey JA, Gu Z, Clark RA, Reinert K, Samonte RV, Schwartz S, Adams MD, Myers EW, Li PW, Eichler EE 2002. Recent segmental duplications in the human genome. Science 297: 1003–1007 [DOI] [PubMed] [Google Scholar]
- Bellen HJ, Levis RW, He Y, Carlson JW, Evans-Holm M, Bae E, Kim J, Metaxakis A, Savakis C, Schulze KL, et al. 2011. The Drosophila gene disruption project: Progress using transposons with distinctive site specificities. Genetics 188: 731–743 [DOI] [PMC free article] [PubMed] [Google Scholar]
- Bhalla N, Wynne DJ, Jantsch V, Dernburg AF 2008. ZHP-3 acts at crossovers to couple meiotic recombination with synaptonemal complex disassembly and bivalent formation in C. elegans. PLoS Genet 4: e1000235. [DOI] [PMC free article] [PubMed] [Google Scholar]
- Boch J 2011. TALEs of genome targeting. Nat Biotechnol 29: 135–136 [DOI] [PubMed] [Google Scholar]
- Bogdanove AJ, Voytas DF 2011. TAL effectors: Customizable proteins for DNA targeting. Science 333: 1843–1846 [DOI] [PubMed] [Google Scholar]
- Brenner S 1974. The genetics of Caenorhabditis elegans. Genetics 77: 71–94 [DOI] [PMC free article] [PubMed] [Google Scholar]
- The C. elegans Deletion Mutant Consortium 2012. Large-scale screening for targeted knockouts in the Caenorhabditis elegans genome. G3 (Bethesda) 2: 1415–1425 [DOI] [PMC free article] [PubMed] [Google Scholar]
- The C. elegans Sequencing Consortium 1998. Genome sequence of the nematode C. elegans: A platform for investigating biology. Science 282: 2012–2018 [DOI] [PubMed] [Google Scholar]
- Chu JS, Johnsen RC, Chua SY, Tu D, Dennison M, Marra M, Jones SJ, Baillie DL, Rose AM 2012. Allelic ratios and the mutational landscape reveal biologically significant heterozygous SNVs. Genetics 190: 1225–1233 [DOI] [PMC free article] [PubMed] [Google Scholar]
- Coulondre C, Miller JH 1977. Genetic studies of the lac repressor. III. Additional correlation of mutational sites with specific amino acid residues. J Mol Biol 117: 525–567 [DOI] [PubMed] [Google Scholar]
- Cutter AD, Payseur BA 2003. Selection at linked sites in the partial selfer Caenorhabditis elegans. Mol Biol Evol 20: 665–673 [DOI] [PubMed] [Google Scholar]
- Davydov EV, Goode DL, Sirota M, Cooper GM, Sidow A, Batzoglou S 2010. Identifying a high fraction of the human genome to be under selective constraint using GERP++. PLoS Comput Biol 6: e1001025. [DOI] [PMC free article] [PubMed] [Google Scholar]
- De Stasio EA, Dorman S 2001. Optimization of ENU mutagenesis of Caenorhabditis elegans. Mutat Res 495: 81–88 [DOI] [PubMed] [Google Scholar]
- Dietzl G, Chen D, Schnorrer F, Su KC, Barinova Y, Fellner M, Gasser B, Kinsey K, Oppel S, Scheiblauer S, et al. 2007. A genome-wide transgenic RNAi library for conditional gene inactivation in Drosophila. Nature 448: 151–156 [DOI] [PubMed] [Google Scholar]
- Flibotte S, Edgley ML, Chaudhry I, Taylor J, Neil SE, Rogula A, Zapf R, Hirst M, Butterfield Y, Jones SJ, et al. 2010. Whole-genome profiling of mutagenesis in Caenorhabditis elegans. Genetics 185: 431–441 [DOI] [PMC free article] [PubMed] [Google Scholar]
- Fraser AG, Kamath RS, Zipperlen P, Martinez-Campos M, Sohrmann M, Ahringer J 2000. Functional genomic analysis of C. elegans chromosome I by systematic RNA interference. Nature 408: 325–330 [DOI] [PubMed] [Google Scholar]
- Frokjaer-Jensen C, Davis MW, Hollopeter G, Taylor J, Harris TW, Nix P, Lofgren R, Prestgard-Duke M, Bastiani M, Moerman DG, et al. 2010. Targeted gene deletions in C. elegans using transposon excision. Nat Methods 7: 451–453 [DOI] [PMC free article] [PubMed] [Google Scholar]
- Fu W, O'Connor TD, Jun G, Kang HM, Abecasis G, Leal SM, Gabriel S, Altshuler D, Shendure J, Nickerson DA, et al. 2013. Analysis of 6,515 exomes reveals the recent origin of most human protein-coding variants. Nature 493: 216–220 [DOI] [PMC free article] [PubMed] [Google Scholar]
- Gerstein MB, Lu ZJ, Van Nostrand EL, Cheng C, Arshinoff BI, Liu T, Yip KY, Robilotto R, Rechtsteiner A, Ikegami K, et al. 2010. Integrative analysis of the Caenorhabditis elegans genome by the modENCODE project. Science 330: 1775–1787 [DOI] [PMC free article] [PubMed] [Google Scholar]
- Giaever G, Chu AM, Ni L, Connelly C, Riles L, Veronneau S, Dow S, Lucau-Danila A, Anderson K, Andre B, et al. 2002. Functional profiling of the Saccharomyces cerevisiae genome. Nature 418: 387–391 [DOI] [PubMed] [Google Scholar]
- Gilchrist EJ, O'Neil NJ, Rose AM, Zetka MC, Haughn GW 2006. TILLING is an effective reverse genetics technique for Caenorhabditis elegans. BMC Genomics 7: 262. [DOI] [PMC free article] [PubMed] [Google Scholar]
- Goffeau A, Barrell BG, Bussey H, Davis RW, Dujon B, Feldmann H, Galibert F, Hoheisel JD, Jacq C, Johnston M et al. 1996. Life with 6000 genes. Science 274: 546, 563–547 [DOI] [PubMed] [Google Scholar]
- Hardenbol P, Baner J, Jain M, Nilsson M, Namsaraev EA, Karlin-Neumann GA, Fakhrai-Rad H, Ronaghi M, Willis TD, Landegren U, et al. 2003. Multiplexed genotyping with sequence-tagged molecular inversion probes. Nat Biotechnol 21: 673–678 [DOI] [PubMed] [Google Scholar]
- Hillenmeyer ME, Fung E, Wildenhain J, Pierce SE, Hoon S, Lee W, Proctor M, St Onge RP, Tyers M, Koller D, et al. 2008. The chemical genomic portrait of yeast: Uncovering a phenotype for all genes. Science 320: 362–365 [DOI] [PMC free article] [PubMed] [Google Scholar]
- Kamath RS, Fraser AG, Dong Y, Poulin G, Durbin R, Gotta M, Kanapin A, Le Bot N, Moreno S, Sohrmann M, et al. 2003. Systematic functional analysis of the Caenorhabditis elegans genome using RNAi. Nature 421: 231–237 [DOI] [PubMed] [Google Scholar]
- Kuromori T, Hirayama T, Kiyosue Y, Takabe H, Mizukado S, Sakurai T, Akiyama K, Kamiya A, Ito T, Shinozaki K 2004. A collection of 11 800 single-copy Ds transposon insertion lines in Arabidopsis. Plant J 37: 897–905 [DOI] [PubMed] [Google Scholar]
- Lehner B, Tischler J, Fraser AG 2006. RNAi screens in Caenorhabditis elegans in a 96-well liquid format and their application to the systematic identification of genetic interactions. Nat Protoc 1: 1617–1620 [DOI] [PubMed] [Google Scholar]
- Li H, Durbin R 2009. Fast and accurate short read alignment with Burrows-Wheeler transform. Bioinformatics 25: 1754–1760 [DOI] [PMC free article] [PubMed] [Google Scholar]
- Li H, Handsaker B, Wysoker A, Fennell T, Ruan J, Homer N, Marth G, Abecasis G, Durbin R 2009. The Sequence Alignment/Map format and SAMtools. Bioinformatics 25: 2078–2079 [DOI] [PMC free article] [PubMed] [Google Scholar]
- Li T, Huang S, Zhao X, Wright DA, Carpenter S, Spalding MH, Weeks DP, Yang B 2011. Modularly assembled designer TAL effector nucleases for targeted gene knockout and gene replacement in eukaryotes. Nucleic Acids Res 39: 6315–6325 [DOI] [PMC free article] [PubMed] [Google Scholar]
- Maydan JS, Flibotte S, Edgley ML, Lau J, Selzer RR, Richmond TA, Pofahl NJ, Thomas JH, Moerman DG 2007. Efficient high-resolution deletion discovery in Caenorhabditis elegans by array comparative genomic hybridization. Genome Res 17: 337–347 [DOI] [PMC free article] [PubMed] [Google Scholar]
- McCallum CM, Comai L, Greene EA, Henikoff S 2000. Targeting induced local lesions IN genomes (TILLING) for plant functional genomics. Plant Physiol 123: 439–442 [DOI] [PMC free article] [PubMed] [Google Scholar]
- Moerman DG, Baillie DL 1979. Genetic organization in Caenorhabditis elegans: Fine-structure analysis of the unc-22 gene. Genetics 91: 95–103 [DOI] [PMC free article] [PubMed] [Google Scholar]
- Moerman DG, Barstead RJ 2008. Towards a mutation in every gene in Caenorhabditis elegans. Brief Funct Genomic Proteomic 7: 195–204 [DOI] [PubMed] [Google Scholar]
- Nelson DW, Honda BM 1985. Genes coding for 5S ribosomal RNA of the nematode Caenorhabditis elegans. Gene 38: 245–251 [DOI] [PubMed] [Google Scholar]
- Ni JQ, Markstein M, Binari R, Pfeiffer B, Liu LP, Villalta C, Booker M, Perkins L, Perrimon N 2008. Vector and parameters for targeted transgenic RNA interference in Drosophila melanogaster. Nat Methods 5: 49–51 [DOI] [PMC free article] [PubMed] [Google Scholar]
- O'Rourke SM, Carter C, Carter L, Christensen SN, Jones MP, Nash B, Price MH, Turnbull DW, Garner AR, Hamill DR, et al. 2011. A survey of new temperature-sensitive, embryonic-lethal mutations in C. elegans. 24 alleles of thirteen genes. PLoS ONE 6: e16644. [DOI] [PMC free article] [PubMed] [Google Scholar]
- Okimoto R, Macfarlane JL, Clary DO, Wolstenholme DR 1992. The mitochondrial genomes of two nematodes, Caenorhabditis elegans and Ascaris suum. Genetics 130: 471–498 [DOI] [PMC free article] [PubMed] [Google Scholar]
- Pollard KS, Hubisz MJ, Rosenbloom KR, Siepel A 2010. Detection of nonneutral substitution rates on mammalian phylogenies. Genome Res 20: 110–121 [DOI] [PMC free article] [PubMed] [Google Scholar]
- Pothof J, van Haaften G, Thijssen K, Kamath RS, Fraser AG, Ahringer J, Plasterk RH, Tijsterman M 2003. Identification of genes that protect the C. elegans genome against mutations by genome-wide RNAi. Genes Dev 17: 443–448 [DOI] [PMC free article] [PubMed] [Google Scholar]
- Robert V, Bessereau JL 2007. Targeted engineering of the Caenorhabditis elegans genome following Mos1-triggered chromosomal breaks. EMBO J 26: 170–183 [DOI] [PMC free article] [PubMed] [Google Scholar]
- Rockman MV, Skrovanek SS, Kruglyak L 2010. Selection at linked sites shapes heritable phenotypic variation in C. elegans. Science 330: 372–376 [DOI] [PMC free article] [PubMed] [Google Scholar]
- Salkoff L, Wei AD, Baban B, Butler A, Fawcett G, Ferreira G, Santi CM 2005. Potassium channels in C. elegans. In WormBook: The online review of C. elegans biology (ed. The C. elegans Research Community), pp. 1–15. WormBook, Pasadena, CA [DOI] [PMC free article] [PubMed] [Google Scholar]
- Sarin S, Prabhu S, O'Meara MM, Pe'er I, Hobert O 2008. Caenorhabditis elegans mutant allele identification by whole-genome sequencing. Nat Methods 5: 865–867 [DOI] [PMC free article] [PubMed] [Google Scholar]
- Sarin S, Bertrand V, Bigelow H, Boyanov A, Doitsidou M, Poole RJ, Narula S, Hobert O 2010. Analysis of multiple ethyl methanesulfonate-mutagenized Caenorhabditis elegans strains by whole-genome sequencing. Genetics 185: 417–430 [DOI] [PMC free article] [PubMed] [Google Scholar]
- Siepel A, Bejerano G, Pedersen JS, Hinrichs AS, Hou M, Rosenbloom K, Clawson H, Spieth J, Hillier LW, Richards S, et al. 2005. Evolutionarily conserved elements in vertebrate, insect, worm, and yeast genomes. Genome Res 15: 1034–1050 [DOI] [PMC free article] [PubMed] [Google Scholar]
- Sulston JE, Brenner S 1974. The DNA of Caenorhabditis elegans. Genetics 77: 95–104 [DOI] [PMC free article] [PubMed] [Google Scholar]
- Sulston JE, Hodgkin J 1988. Methods. In The nematode Caenorhabditis elegans (ed. Wood WB), pp. 587–608. Cold Spring Harbor Laboratory Press, Cold Spring Harbor, NY [Google Scholar]
- Tijsterman M, Pothof J, Plasterk RH 2002. Frequent germline mutations and somatic repeat instability in DNA mismatch-repair-deficient Caenorhabditis elegans. Genetics 161: 651–660 [DOI] [PMC free article] [PubMed] [Google Scholar]
- Till BJ, Colbert T, Tompa R, Enns LC, Codomo CA, Johnson JE, Reynolds SH, Henikoff JG, Greene EA, Steine MN, et al. 2003. High-throughput TILLING for functional genomics. Methods Mol Biol 236: 205–220 [DOI] [PubMed] [Google Scholar]
- Till BJ, Cooper J, Tai TH, Colowit P, Greene EA, Henikoff S, Comai L 2007. Discovery of chemically induced mutations in rice by TILLING. BMC Plant Biol 7: 19. [DOI] [PMC free article] [PubMed] [Google Scholar]
- Tong AH, Evangelista M, Parsons AB, Xu H, Bader GD, Page N, Robinson M, Raghibizadeh S, Hogue CW, Bussey H, et al. 2001. Systematic genetic analysis with ordered arrays of yeast deletion mutants. Science 294: 2364–2368 [DOI] [PubMed] [Google Scholar]
- Tong AH, Lesage G, Bader GD, Ding H, Xu H, Xin X, Young J, Berriz GF, Brost RL, Chang M, et al. 2004. Global mapping of the yeast genetic interaction network. Science 303: 808–813 [DOI] [PubMed] [Google Scholar]
- Tsang WY, Lemire BD 2003. The role of mitochondria in the life of the nematode, Caenorhabditis elegans. Biochim Biophys Acta 1638: 91–105 [DOI] [PubMed] [Google Scholar]
- Urnov FD, Rebar EJ, Holmes MC, Zhang HS, Gregory PD 2010. Genome editing with engineered zinc finger nucleases. Nat Rev Genet 11: 636–646 [DOI] [PubMed] [Google Scholar]
- Vallin E, Gallagher J, Granger L, Martin E, Belougne J, Maurizio J, Duverger Y, Scaglione S, Borrel C, Cortier E, et al. 2012. A genome-wide collection of Mos1 transposon insertion mutants for the C. elegans research community. PLoS ONE 7: e30482. [DOI] [PMC free article] [PubMed] [Google Scholar]
- Wicks SR, Yeh RT, Gish WR, Waterston RH, Plasterk RH 2001. Rapid gene mapping in Caenorhabditis elegans using a high density polymorphism map. Nat Genet 28: 160–164 [DOI] [PubMed] [Google Scholar]
- Winzeler EA, Shoemaker DD, Astromoff A, Liang H, Anderson K, Andre B, Bangham R, Benito R, Boeke JD, Bussey H, et al. 1999. Functional characterization of the S. cerevisiae genome by gene deletion and parallel analysis. Science 285: 901–906 [DOI] [PubMed] [Google Scholar]
- Wood AJ, Lo TW, Zeitler B, Pickle CS, Ralston EJ, Lee AH, Amora R, Miller JC, Leung E, Meng X, et al. 2011. Targeted genome editing across species using ZFNs and TALENs. Science 333: 307. [DOI] [PMC free article] [PubMed] [Google Scholar]
- Yook K, Harris TW, Bieri T, Cabunoc A, Chan J, Chen WJ, Davis P, de la Cruz N, Duong A, Fang R, et al. 2012. WormBase 2012: More genomes, more data, new website. Nucleic Acids Res 40: D735–D741 [DOI] [PMC free article] [PubMed] [Google Scholar]