

Abstract
Prostaglandin E2 (PGE2), a potent lipid signaling molecule, modulates inflammatory responses through activation of downstream G-protein coupled EP1–4 receptors. Here, we investigated the cell-specific in vivo function of PGE2 signaling through its E-prostanoid 2 (EP2) receptor in murine innate immune responses systemically and in the CNS. In vivo, systemic administration of lipopolysaccharide (LPS) resulted in a broad induction of cytokines and chemokines in plasma that was significantly attenuated in EP2-deficient mice. Ex vivo stimulation of peritoneal macrophages with LPS elicited proinflammatory responses that were dependent on EP2 signaling and that overlapped with in vivo plasma findings, suggesting that myeloid-lineage EP2 signaling is a major effector of innate immune responses. Conditional deletion of the EP2 receptor in myeloid lineage cells in Cd11bCre;EP2lox/lox mice attenuated plasma inflammatory responses and transmission of systemic inflammation to the brain was inhibited, with decreased hippocampal inflammatory gene expression and cerebral cortical levels of IL-6. Conditional deletion of EP2 significantly blunted microglial and astrocytic inflammatory responses to the neurotoxin MPTP and reduced striatal dopamine turnover. Suppression of microglial EP2 signaling also increased numbers of dopaminergic (DA) neurons in the substantia nigra independent of MPTP treatment, suggesting that microglial EP2 may influence development or survival of DA neurons. Unbiased microarray analysis of microglia isolated from adult Cd11bCre;EP2lox/lox and control mice demonstrated a broad downregulation of inflammatory pathways with ablation of microglial EP2 receptor. Together, these data identify a cell-specific proinflammatory role for macrophage/microglial EP2 signaling in innate immune responses systemically and in brain.
Introduction
The lipid messenger PGE2 is a major downstream product of arachidonic acid metabolism by the cyclooxygenases COX-1 and COX-2, and mediates innate and adaptive immune responses in allergic inflammation, autoimmune diseases, asthma, nociception, and chronic neurodegenerative disorders. While PGE2 is a well established modulator of inflammatory responses in many different contexts, and it affects the progression and outcome of a wide range of disease processes, its in vivo cell- and receptor-specific mechanisms of inflammatory action are incompletely understood.
PGE2 binds to four G-protein coupled receptors, E prostanoid (EP)1–4 that exhibit divergent signaling cascades, cellular expression profiles, and desensitization kinetics (Breyer et al., 2001; Sugimoto and Narumiya, 2007). In innate and adaptive immune responses, PGE2 can elicit both immunosuppressive as well as proinflammatory effects, suggesting that the specificity of the PGE2 inflammatory response depends not only on the type of stimulus, but on the specific EP receptors and immune cell types that are activated. So far, nonsteroidal anti-inflammatory drugs (NSAIDs), which inhibit both COX-1 and COX-2, as well as COX-2 selective inhibitors have been a mainstay of anti-inflammatory therapy. However, accumulating evidence indicates that inhibition of COX activity will suppress not only downstream toxic prostaglandin signaling pathways, but beneficial ones as well, leading to significant adverse effects (Funk and FitzGerald, 2007; Andreasson, 2010; Shi et al., 2010; Liang et al., 2011). Therefore, understanding the cell-specific molecular mechanisms of action of toxic and beneficial prostaglandin signaling pathways is an important challenge, and may lead to more selective and safe targeting of these receptors in pathological conditions.
In vitro, EP2 signaling has been associated with both pro- and anti-inflammatory effects in response to lipopolysaccharide (LPS), a canonical inducer of the innate immune response (Minghetti et al., 1997; Caggiano and Kraig, 1999; Milatovic et al., 2004; Shie et al., 2005; Wu et al., 2007; Quan et al., 2013). In vivo, modeling of neuroinflammation using global EP2-null mice demonstrates an attenuation of inflammatory and oxidative responses with stimulation with LPS (Montine et al., 2002) and 1-methyl-4-phenyl-1,2,3,6-tetrahydropyridine (MPTP) (Jin et al., 2007). Pharmacologic inhibition of EP2 signaling in the pilocarpine model of status epilepticus decreases mortality, inflammation, and neurotoxicity (Jiang et al., 2013). In transgenic models of Alzheimer's disease and amyotrophic lateral sclerosis, where neurodegeneration occurs in the setting of a prominent innate immune response, global deletion of EP2 attenuates progression of pathology (Liang et al., 2005, 2008; Keene et al., 2010). However, in these studies, EP2 signaling is inhibited in all brain cell types, and the cell-specific contribution of inflammatory EP2 signaling to neurodegeneration is not established. To that end, we have used conditional knock-out genetic approaches to examine cell-specific effects of EP2 signaling in the LPS model of innate immunity and the MPTP model of Parkinson's disease, a well established paradigm of neurodegeneration that induces a robust inflammatory response in the substantia nigra (Wu et al., 2003). In these models, we confirmed in vivo the importance of myeloid PGE2 EP2 signaling in generation of the innate immune response peripherally and in the CNS.
Materials and Methods
Materials
LPS (Escherichia coli O55: B5; Calbiochem) was resuspended in sterile H2O at 1 mg/ml and stored at −80°C. EP2 agonist butaprost was purchased from Cayman Chemical. Cell culture media, supplements, and antibiotics were purchased from Invitrogen.
Animals
This study was conducted in accordance with the National Institutes of Health guidelines for the use of experimental animals and protocols were approved by the Institutional Animal Care and Use Committee. C57BL/6 EP2−/− mice (Kennedy et al., 1999) were kindly provided by Dr. R. Breyer (Vanderbilt University, Nashville, TN). C57BL/6 Cd11bCre mice (Boillée et al., 2006) were kindly provided by Dr. G. Kollias (Alexander Fleming Biomedical Sciences Research Center, Vari, Greece) and Dr. Donald Cleveland (University of California, San Diego, La Jolla, CA). EP2lox/+ mice were generated as part of this study (see below) and are in a C57BL/6 background. All mice were housed in an environment controlled for lighting (12 h light/dark cycle), temperature, and humidity, with food and water available ad libitum. Cd11bCre;EP2lox/lox and Cd11bCre;EP2+/+ mice of both genders were treated with either H2O or LPS (5 mg/kg, i.p.; n = 6–7 per group, 10–12 months of age). For collection of plasma, 6 h after injection, mice were deeply anesthetized with isoflurane and blood was collected in a 1 ml syringe precoated with EDTA (250 mm) and placed in EDTA-coated tubes. Plasma was collected after centrifugation at 1000 × g for 10 min at 4°C and frozen at −80°C; brain tissue was harvested and frozen at −80°C. For MPTP experiments, 2–3-month-old mice received four intraperitoneal injections of MPTP-HCl (20 mg/kg; Sigma-Aldrich) dissolved in saline or vehicle (saline) at 2 h intervals (Liberatore et al., 1999).
Plasma multianalyte analysis
Plasma was analyzed by the Stanford Human Immune Monitoring Center using a Luminex mouse 26-plex analyte platform that screens 26 secreted proteins using multiplex fluorescent immunoassay. Plasma was diluted 2× and samples were run in duplicate. Plasma was also analyzed using the Rodent MAPtm Antigens, Version 2.0 multianalyte profile (Rules Based Medicine) that screens a total of 59 blood secreted proteins using multiplex fluorescent immunoassay.
Peritoneal macrophage isolation and cell culture
Male 4-month-old mice were injected with 2 ml 3% (w/v) thioglycollate (BD Diagnostic Systems) into the peritoneal cavity and primary macrophages were isolated 3 d later by flushing with ice-cold HBSS (HyClone). Cells were seeded at a density of 2 × 10⁶ cells/well onto 12-well plates (1 × 10⁶ for purification with Cd11b Ab-conjugated beads) in DMEM supplemented with 10% heat-inactivated FBS (HyClone), 100 U/ml penicillin and streptomycin, and 1 mm sodium pyruvate, and maintained in a humidified atmosphere containing 5% CO2 at 37°C. After overnight culture, cells were washed twice with medium to remove nonadherent cells and thereafter treated with vehicle +/− butaprost (1 μm) or LPS (10 ng/ml) for 1 or 6 h.
Male and female 2–3-month-old mice were used for Cd11bCre:EP2lox/lox and Cd11bCre:EP2+/+ macrophage isolation. Cells were purified with anti-mouse Cd11b Ab-conjugated magnetic beads and MACS columns (Miltenyi Biotec), as previously described (Shi et al., 2010). In a separate experiment, flow cytometry analysis demonstrated that macrophages were Cd11b positive. Macrophage genomic DNA was isolated using DNeasy Blood & Tissue Kit (Qiagen). For determining the sensitivity and linearity of the qPCR for EP2 DNA quantification, tail DNA was used in the range 12.5–400 ng of DNA, with 100 and 250 nm EP2 primers. Twenty-five and 50 ng of macrophage DNA was run with 250 nm primers and yielded similar results (data not shown).
Quantitative real-time PCR
Quantitative real-time PCR (qPCR) was performed as previously described (Liang et al., 2008; Shi et al., 2010). Briefly, total RNA was isolated using Trizol reagent (Invitrogen), treated with DNase (Invitrogen), and the reaction was terminated by heating at 65°C for 10 min. First strand cDNA synthesis was performed with 0.4 or 2 μg of total RNA from Cd11b Ab-bead sorted macrophages or tissue, respectively, combined with 4 U of Omniscript enzyme (Qiagen) and 0.25 μg of random primer in a reaction volume of 20 μl at 37°C for 1 h. Reverse transcribed cDNA was diluted 1:10–1:20 in RNase-free ddH2O for subsequent qRT-PCR. The mRNA level for each target gene was quantified by SYBR Green-based qPCR using the QuantiTect SYBR Green PCR kit (Qiagen). Melting curve analysis confirmed the specificity of each reaction. The standard curve method was used for quantification and gene expression level was normalized to 18S RNA. Forward and reverse primers are listed in Table 1. For quantification of EP2 copy number, the cycle threshold method was used as follows: deltaC(t) = C(t) for EP2 − C(t) for 18S, and EP2 copy/copy 18S = 2̂(−deltaC(t)).
Table 1.
List of primers used for qRTPCR
| Sense | Anti-sense | Accession number | |
|---|---|---|---|
| 18S | 5′-CGGCTACCACATCCAAGGAA-3′ | 5′-GCTGGAATTACCGCGGCT-3′ | AY248756 |
| EP2 | 5′-TGCTGGCTTCATATTCAAGAAA-3′ | 5′-TGGCCAGACTAAAGAAGGTCA-3′ | NM_008964 |
| COX-2 | 5′-TGCAAGATCCACAGCCTACC-3′ | 5′-GCTCAGTTGAACGCCTTTTG-3′ | NM_011198 |
| iNOS | 5′-TGACGGCAAACATGACTTCAG-3′ | 5′-GCCATCGGGCATCTGGTA-3′ | MMU43428 |
| gp91phox | 5′-CCAACTGGGATAACGAGTTCA-3′ | 5′-GAGAGTTTCAGCCAAGGCTTC-3′ | NM_007807 |
| IL-1β | 5′-CCAGGATGAGGACATGAGCACC-3′ | 5′-TTCTCTGCAGACTCAAACTCCAC-3′ | NM_008361 |
| IL-6 | 5′-CATAGCTACCTGGAGTACATGA-3′ | 5′-CATTCATATTGTCAGTTCTTCG-3′ | NM_031168 |
| TNF-α | 5′-TCTCATGCACCACCATCAAGGACT-3′ | 5′-ACCACTCTCCCTTTGCAGAACTCA-3′ | NM_013693 |
| p67phox | 5′-GCCGGAGACGCCAGAAGAGCTA-3′ | 5′-GGGGCTGCGACTGAGGGTGAA-3′ | NM_010877 |
Griess assay
NOS activity was measured using the Griess assay to measure nitrite production (Promega) as previously described (Shi et al., 2010).
ELISA
Cortical brain lysates were prepared as previously described (Shi et al., 2010), with the following modifications. Tissue was weighed and lysis buffer added proportionally to weight; 25 mm Tris-HCl, pH 7.5, 100 mm NaCl, 1% Triton, 0.5% NP-40 (IGEPAL, Sigma-Aldrich), protease inhibitor cocktail (Roche Diagnostics), and phosphatase inhibitor cocktail (Cell Signaling Technology). Measurements of IL-6 by enzyme-linked immunosorbent assay (ELISA) were performed according to manufacturer's instructions (BD Biosciences).
Immunostaining
Primary peritoneal macrophage cells were fixed in 4% paraformaldehyde and incubated with primary antibodies anti-EP2 (1/500; Cayman Chemical) and anti-Cd11b (1/500; AbD Serotec) at +4°C for 48 h. For staining of hippocampal free-floating sections, every sixth section 40 μm apart was incubated with primary anti-Iba1 antibody (1/1000; Wako). For staining of sections from vehicle or MPTP-treated mice, free-floating sections were processed for immunohistochemistry and the following primary antibodies used at +4°C for 24 h: anti-Iba1 (1/1000; Wako), anti-GFAP (1/1000; EMD Millipore), and anti-TH (1/1000; Sigma-Aldrich). Secondary antibodies used included Cy2-conjugated donkey anti-mouse, Cy3-conjugated donkey anti-rabbit, and a DyLight 649-conjugated donkey anti-rat antibody (Jackson ImmunoResearch Laboratories). Images of cells were acquired by sequential scanning using the Leica TCS SPE confocal system and DM 5500 Q microscope (Leica Microsystems). Images of brain sections were acquired using a Nikon Eclipse E600 microscope (Nikon Instruments) and a Hamamatsu Orca-ER digital camera (Hamamatsu Photonics). The substantia nigra (SN) was delineated using TH immunostaining to identify the A9 dopaminergic neurons. The percentage area positive for Iba1 and GFAP immunostaining was quantified using the measurements module of Volocity 4.3.2 image analysis software (Improvision).
TH stereology
For stereological counting every sixth section spanning the entire substantia nigra was sampled, for a total of eight sections per brain. Endogenous peroxidase activity was quenched in free-floating sections by treating them with 0.3% H2O2 for 20 min. Sections were immunostained with anti-TH (1/2000; Novus) at +4°C for 24 h, incubated with biotinylated secondary donkey anti-rabbit IgG (1/1000) at room temperature for 2 h, and incubated for 1 h in avidin–biotin peroxidase complex (Vector Laboratories). Visualization was performed using 0.03% 3,3′-diaminobenzidine (DAB) for 2 min at room temperature. The substantia nigra was delineated at low magnification (10×) and systematically sampled at a higher magnification (20×) to determine the number of TH+ neurons using the optical fractionator technique.
HPLC
A 1 mm2 piece of dorsal striatal tissue was dissected 3 mm posterior from the olfactory bulb, and was immediately flash frozen in liquid nitrogen. Catecholamines were acid extracted in 0.3 N perchloric acid, and dopamine, dihydroxyphenylacetic acid (DOPAC), and homovanillic acid (HVA) were quantified by reverse phase HPLC coupled with electrochemical detection. The pellet was dried and reconstituted in 0.5 N NaOH and briefly sonicated, and total protein determined using the Lowry method.
Generation of targeting vector
Recombineering reagents including bacterial strains and plasmids and recombineering protocols were provided by the NCI (Biological Resources Branch).
Retrieval of EP2 sequences from BAC.
The 9.5 kb fragment of genomic DNA containing Exon1 of EP2 receptor Ptger2 was subcloned from BAC bMQ462012 (Wellcome Trust Sanger Institute, Cambridge, UK) into pL253 using gap-repair (Liu et al., 2003). BAC bMQ-462O12 (same plasmid as above) was electroporated into EL350 cells (Lee et al., 2001). The 5′ and 3′ ends of the BAC sequence to be targeted were PCR amplified using primers A/B (5′ end fragment) and primers X/Y (3′ end fragment); restriction sites for NotI/HindIII (primer A/B, 391 bp) and HindIII/SpeI (primer X/Y, 336 bp) were included in the amplification primers. PCR products were purified and digested with the relevant restriction enzymes, and subcloned into pL253 digested with NotI/SpeI containing a thymidine kinase (MC1-TK) cassette to generate the gap-repair (retrieval) plasmid. Linearized pL253-AB/XY plasmid was electroporated into EL350 cells carrying BAC bMQ462012, and homologous recombinants between BAC DNA and linearized pL253-AB/XY were selected for with ampicillin resistance. The gap-repaired plasmid pL253-EP2 was then linearized, religated, and retransformed into DH10B cells, and ampicillin resistant colonies were selected to select for plasmid monomers, as described previously (Lee et al., 2001). The correct sequence of the retrieved EP2 genomic fragment was verified by (1) EcoRI restriction digestion and (2) complete sequencing of the 9.5 kb EP2 sequence.
5′ targeting of loxP-Neo cassette.
To introduce a 5′ loxP site upstream of exon 1 in the subcloned 9.5 kb EP2 genomic sequence in pL253-EP2, the recombineering approach was again used. A second targeting vector was generated by subcloning in PCR products generated by amplification of BAC DNA with primers C/D (yielding a 321 bp fragment) and E/F (yielding a 130 bp fragment) so that they flanked the loxP-Neo-loxP selection cassette in pL452 vector. A novel EcoRI site was included in fragment CD to aid in confirmation of gene targeting in ES cells. The targeting CD-loxP-neo-loxP-EF cassette was excised with NotI and SalI restriction enzymes and cotransformed with pL253-EP2 into recombination competent SW106 cells. Selection for homologously recombined pL253-EP2–5′loxP-neo-loxP was performed by plating on kanamycin plates. Positive clones were verified by restriction enzyme digests and sequencing. The neomycin gene was excised with recombinant Cre recombinase to generate pL253-EP2–5′loxP with a single loxP 5′ to exon 1.
3′ targeting of Frt-Neo-Frt-LoxP.
To introduce the 3′ loxP site downstream of exon 1 in pL253-EP2–5′loxP, a targeting vector was generated by ligating PCR products generated using primers G/H and I/J and the Frt-Neo-Frt-LoxP cassette derived from the pL451 vector. Linearized G/H-Frt-Neo-Frt-LoxP-I/J was cotransformed with pL253-EP2–5′loxP to generate the targeting vector. Positive clones were verified using restriction enzyme analysis and sequencing. The functionality of Frt and loxP sites was confirmed by excision of Neo and subsequent excision of Exon1 using Flp and Cre recombinases induced in bacterial strains SW105 and SW106, respectively. Before proceeding to electroporation in ES cells, sequencing was performed on the entire targeting vector. Targeting vector was linearized with PvuI and electroporated into C57BL/6 ES cells (inGenious Targeting Laboratories). Clones were selected by G418 resistance and subsequently screened by PCR. Clones with the correct insert were reconfirmed with PCR followed by sequencing of PCR fragments and were separately tested for gancyclovir resistance. High percentage chimeras were selected from the gancyclovir-sensitive clone 2G11. F1 male and female progeny were intercrossed. In vivo excision of the 3′ Neo gene was performed by crossing F1 mice to actin-FLPe mice (B6;J-Tg(ACTFLPe)9205Dym/J; Jackson Laboratory) to generate C57BL/6 EP2lox/+ mice. Proper excision of Frt flanked sequences was confirmed by sequencing of relevant junctions.
Isolation of primary adult microglia
For isolation of microglia, 8–9-month-old Cd11bCre;EP2+/+ and Cd11bCre;EP2lox/lox mice were used that had received an intracerebroventricular injection of saline as part of a larger experiment, as previously described (Shi et al., 2012). Forty-eight hours after surgery, mice were killed by transcardiac perfusion with cold heparinized 0.9% NaCl. Brains were then removed from the mice and pooled, two brains of the same genotype per sample, to ensure adequate cell and RNA yield. The brains were then enzymatically dissociated and isolated using magnetic CD11b Microbeads from Miltenyi Biotec, according to the manufacturer's protocol.
RNA isolation and microarray
RNA purification from primary microglia of adult Cd11bCre;EP2+/+ and Cd11bCre;EP2lox/lox mice was performed immediately after cell isolation using Trizol (Life Technologies) followed by the RNeasy Mini Kit (Qiagen) according to the manufacturers' protocols. RNA quality was assessed using a BioAnalyzer (Agilent) and determined to be sufficient for microarray analysis (RNA Integrity Number > 7.0 for all samples). cDNA synthesis, labeling, hybridization, and scanning were performed by the Stanford Protein and Nucleic Acid (PAN) Facility using GeneChip Mouse Gene 2.0 ST arrays (Affymetrix). Microarray data were statistically analyzed using Partek software to identify differentially expressed genes between groups by ANOVA using an unadjusted p value <0.05. Genes that had a fold change of >1.5 between genotypes were used for unsupervised hierarchical clustering analysis. A total of 136 genes were used to create the node map. Ingenuity Pathway Analysis (Ingenuity Systems) was used for pathway analysis.
Flow cytometry
Splenocytes were isolated by mechanical separation through a 40 μm filter, lysed of red blood cells, blocked with anti-CD16/32 (FcγII/IIIR, BD Biosciences), and stained at 5 × 10⁶ cells/ml with various combinations of directly conjugated mAbs. The following directly conjugated mAbs were purchased from Biolegend: APC-anti-CD11b (M1/70), PE anti-CD115 (AFS98), PE/Cy7-anti-Ly6G (1A8), Brilliant Violet 570 anti-Ly6C (HK1.4), and Brilliant Violet 421 anti-MHCII/I-A/I-E (M5/114.15.2). FITC anti-CD86 (GL1) was purchased from Ebioscience. Dead cells were discriminated by LIVE/DEAD Fixable Dead Cell Stain Kit according to the manufacturer's protocol (Life Technologies). Stained cells were analyzed on a LSRII flow cytometer (BD Biosciences) and analyzed using Flowjo software (Tree Star).
Statistical analysis
Data are presented as mean ± SEM and analyzed using two-way ANOVA, one-way ANOVA, or Student's t test, two-tailed unless otherwise indicated. For two-way ANOVA, Bonferroni multiple-comparison tests were performed to compare effects of EP2 agonist or effect of genotype. Prism software (GraphPad Software) was used for statistical analyses. For plasma multianalyte analysis, the concentrations of plasma proteins that reached statistical significance between treatment and genotype cohorts were transformed to relative concentrations (median Z-score). Cluster analysis (Gene Cluster 3.0, University of Tokyo, Tokyo, Japan) produced a separation of samples according to treatment group and protein levels in plasma. For all data, a probability level of p < 0.05 was considered to be statistically significant.
Results
In vivo modulation of innate immune responses by EP2 signaling
To broadly assess the in vivo function of EP2 signaling in the inflammatory response, we used a proteomic approach and examined plasma secreted proteins from EP2+/+ (wild-type, WT) and EP2−/− mice stimulated with systemic LPS (Fig. 1). Previous studies using gene arrays have demonstrated a rapid induction of proinflammatory cytokine mRNA in response to LPS (Rosenberger et al., 2000; Lund et al., 2006; Shi et al., 2010). Here, LPS (5 mg/kg) was administered intraperitoneally and blood plasma was analyzed at 6 h for cytokine and chemokine responses; LPS induced significant increases in all 26 factors tested (data not shown). Unsupervised hierarchical clustering demonstrated 12/26 factors as regulated by LPS and EP2 genotype (Fig. 1A). Additional analyses using two-way ANOVA confirmed that induction of 10/26 secreted factors was significantly blunted by Bonferroni multiple-comparison tests 6 h after LPS stimulation (Fig. 1B). Elaboration of induced factors spanned a broad range of inflammatory mechanisms. Of note, interleukin 1 β (IL1β) was induced with LPS by 2.85-fold but was reduced in EP2−/− LPS plasma by 44.7% (p < 0.001), indicating that inflammatory EP2 signaling contributes to inflammasome generation of IL1β (Franchi et al., 2012). Tumor necrosis factor α (TNFα) was upregulated in LPS cohorts by 9.8-fold and significantly suppressed in LPS-treated EP2−/− cohorts by 44.2% (p < 0.01). EP2 signaling impacted broadly on multiple immune responses, including classical Th1 (IL-12 p70 and IL-12 p40) and Th2 (IL-4 and IL-13) immune responses. EP2 also significantly regulated induction of chemokines IP-10 (CXCL10), RANTES, MIP-1α, and leukocyte growth factor GM-CSF. Thus, EP2 signaling contributed significantly to the acute innate immune response in vivo by upregulating a broad range of proinflammatory cytokines and chemokines.
Figure 1.
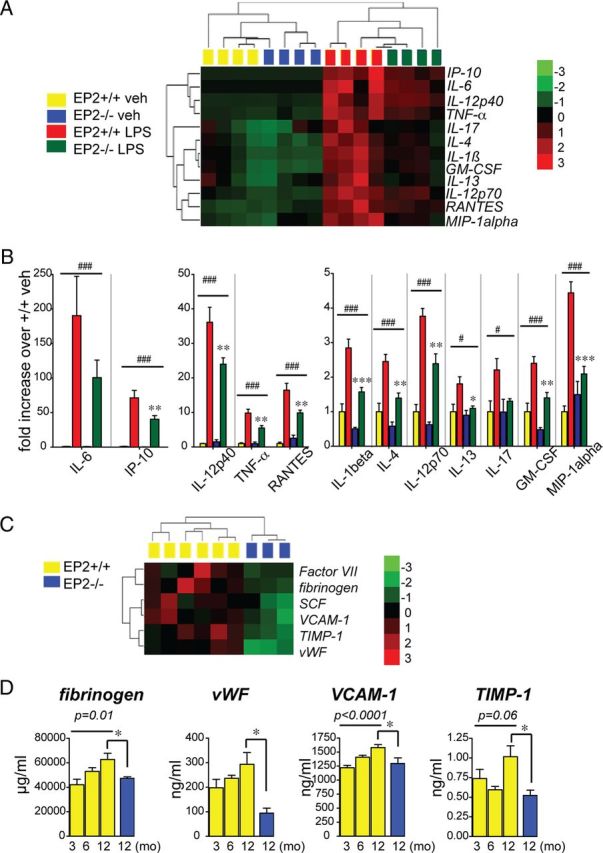
EP2 signaling in vivo induces a broad cytokine, chemokine, and endothelial inflammatory response to systemic LPS. A, B, Plasma was collected and analyzed at 6 h after administration of PBS or LPS (5 mg/kg, i.p.) to EP2+/+ and EP2−/− mice. A, Cluster analysis of regulated cytokines and chemokines following peripheral vehicle or LPS administration. B, Fold changes in concentrations of regulated cytokines are shown; two-way ANOVA for effect of treatment is represented by # (#p < 0.05, ###p < 0.001, respectively), and Bonferroni's multiple-comparison tests comparing mean of EP2+/+/LPS and EP2−/−/LPS are represented by * (*p < 0.05, **p < 0.01, ***p < 0.001, respectively; n = 4 per group). C, D, Plasma was collected from 3-month-, 6-month-, and 12-month-old EP2+/+ mice and 12-month-old EP2−/− mice, and analyzed using the RBM plasma multianalyte platform. C, Cluster analysis of regulated endothelial factors in 12 month EP2+/+ and EP2−/− plasma samples. D, Measurement of changes with aging from 3 months to 12 months in EP2+/+ mice of regulated endothelial inflammatory factors demonstrates an age-dependent increase in levels; deletion of EP2 significantly decreases absolute levels at 12 months of age (ANOVA for 3–12 month EP2+/+; t test *p < 0.05 for comparisons between EP2+/+ and EP2−/− values at 12 month; n = 3–8 per group).
Accumulating evidence indicates that with increasing age, a number of plasma immune and endothelial factors change, reflective of an increase in systemic inflammation with aging (Villeda et al., 2011). We assessed basal levels of secreted factors in plasma in a separate experiment examining 59 secreted factors in 3-month-, 6-month-, and 12-month-old EP2+/+ mice and 12-month-old EP2−/− mice. This proteomic analysis revealed a subgroup of endothelial factors whose basal levels were regulated with aging from 3 months to 12 months of age, as well as a restricted set of factors that were strongly regulated by EP2 signaling at 12 month of age (Fig. 1C). Of those factors, there was a subset whose expression increased with age, with EP2 deletion bringing expression levels down to that associated with the younger age (Fig. 1D). Interestingly, although factors in this subset have been generally thought of as coagulation and thrombosis factors, they have recently gained attention as being linked to inflammatory processes, notably fibrinogen (Davalos et al., 2012) and von Willebrand factor (vWF) (Khan et al., 2012). The monocytic/endothelial integrin VCAM-1, an integrin tightly associated with endothelial-mediated inflammatory responses, as well as the metalloproteinase inhibitor TIMP1 were also highly regulated by EP2 deletion. Together, the changes in cytokines and chemokines induced in response to LPS, as well as changes in basal levels of endothelial factors that participate in inflammatory processes, indicate that EP2 signaling broadly regulates peripheral inflammatory responses in vivo.
EP2 signaling in macrophages regulates expression of inflammatory genes
We then examined the inflammatory response mediated by EP2 signaling ex vivo using peritoneal macrophages derived from EP2+/+ and EP2−/− C57BL/6 mice. Macrophages were stimulated with LPS with or without the selective EP2 agonist butaprost. Macrophages basally express EP2 (Fig. 2A). Stimulation of macrophages with LPS (10 ng/ml) induced a rapid increase in EP2 mRNA within 1 h followed by a prompt downregulation by 6 h (Fig. 2B), indicating that EP2 expression is tightly regulated by inflammatory stimuli. EP2 agonist stimulation (butaprost 1 μm) significantly potentiated LPS-induced COX-2 expression by 1 h and inducible nitric oxide synthase (iNOS) expression by 6 h as determined by quantitative PCR (qPCR). EP2 agonist alone increased basal levels of macrophage gp91phox, a component of the NADPH oxidase complex, and further increased levels in LPS stimulated cells at 6 h (Fig. 2C). iNOS activity was quantified 24 h after stimulation by measuring nitrite production, and demonstrated a significant increase with LPS stimulation, which was reduced significantly in EP2−/− macrophages (gray bars), but significantly enhanced with costimulation with butaprost (1 μm; Fig. 2D); control experiments examining responses of LPS-treated EP2−/− macrophages did not show any changes in nitrite production with addition of butaprost, confirming the selective binding of butaprost to the EP2 receptor (data not shown). EP2 receptor activation further increased mRNA levels of cytokines IL-6 and IL1β in LPS-stimulated macrophages, but exerted a trend toward an inhibitory effect on TNFα mRNA expression (Fig. 2E). Thus, in the setting of an innate inflammatory stimulus, with the exception of TNFα regulation, macrophage EP2 signaling potentiated a classically activated M1 proinflammatory response, with induction of oxidative inflammatory enzymes COX-2, iNOS, and the NADPH oxidase subunit gp91phox, as well as cytokines IL-6 and IL1β. Regulation of TNFα expression in vitro is suppressed following stimulation with PGE2 (Meja et al., 1997; Aloisi et al., 1999), consistent with the trend seen here. As the pattern of gene regulation largely overlapped with the proteomic analysis of global EP2 KO mice in Figure 1, we next tested whether monocytic lineage EP2 signaling contributes in a cell-specific manner to the systemic and CNS innate immune response in vivo.
Figure 2.

The EP2 receptor induces expression of inflammatory enzymes and cytokines in mouse peritoneal macrophages. For all panels: *p < 0.05, **p < 0.01, ***p < 0.001, values are mean ± SEM. A, EP2 immunostaining is detected in wild-type but not EP2−/− C57BL/6 primary peritoneal macrophages costained for Cd11b. Scale bar, 100 μm. B, Peritoneal macrophages were stimulated with LPS (10 ng/ml) for 1 and 6 h. qPCR demonstrates a rapid upregulation of EP2 receptor mRNA by 1 h and subsequent downregulation by 6 h following LPS stimulation (n = 4–6 per group; two-way ANOVA for effect of time ##p < 0.01, and effect of interaction p = 0.02; Bonferroni's multiple-comparison tests comparing mean of 1 h vehicle (veh) and 1 h LPS *p < 0.05). C, Peritoneal macrophages were stimulated with LPS (10 ng/ml) +/− the EP2 agonist butaprost (1 μm) or vehicle. qPCR demonstrates an induction of proinflammatory mediators COX-2, iNOS, and gp91phox with LPS stimulation that is further enhanced by costimulation with butaprost (time points 1 h for COX-2 and 6 h for iNOS and gp91phox; n = 4–6 per group; two-way ANOVA for effect of LPS #p < 0.05, ###p < 0.001; Bonferroni's multiple-comparison tests comparing means of LPS-con and LPS-butaprost *p < 0.05, **p < 0.01). D, LPS-induced macrophage NO release is increased by EP2 receptor activation with butaprost (1 μm), whereas EP2−/− macrophages show reduced NO levels compared with EP2+/+ macrophages (n = 4 per group; Student's tests #p < 0.05, ##p < 0.01 comparing EP2+/+ to EP2−/−). E, qPCR demonstrates induction of IL-6 mRNA at 1 h and IL1β mRNA at 6 h, and a trend of decreased TNFα mRNA at 6 h in LPS-stimulated macrophages with addition of butaprost (n = 4–6 per group; two-way ANOVA for effect of LPS ##p < 0.01, ###p < 0.001; Bonferroni's multiple-comparison tests comparing means of LPS-con and LPS-butaprost **p < 0.01 for IL-6 at 1 h and IL1β at 6 h).
Generation of conditional knock-out of EP2 in monocyte lineage cells
To examine cell-specific mechanisms of EP2-mediated innate immune responses in vivo, we generated an EP2lox/+ C57BL/6J mouse line to allow for conditional deletion of EP2 (Fig. 3). A recombineering-based strategy (Liu et al., 2003) was adopted to generate the targeting vector (see Materials and Methods; Fig. 3A). This approach made use of homologous recombination to construct the targeting vector and to introduce loxP sites and selectable markers 5′ and 3′ of exon 1 of Ptger2, the gene encoding the EP2 receptor. Exon 1 of Ptger2 encodes the first five transmembrane domains of the EP2 receptor. The recombineering approach involved five steps. First, the genomic fragment containing the target EP2 genomic sequences was retrieved from a BAC by gap repair of a plasmid containing a thymidine kinase (TK) cassette for negative selection in ES cells. Second, a 5′ loxP site was inserted 5′ to the transcription start site of exon 1. This was accomplished by inserting a loxP flanked selection cassette into intronic EP2 genomic sequence. Third, a Cre-mediated “pop-out” of this cassette was performed to leave a single loxP site behind. Fourth, a selection cassette containing the neomycin resistance gene flanked by two FRT sites and a single 3′ loxP site was inserted 3′ to exon 1, followed by ES cell electroporation, selection, and generation of chimeras. Fifth, F1 C57BL/6J mice heterozygous for the targeting construct were derived from chimeric offspring and were crossed with transgenic mice expressing flipase (actin-FLPe mice) to excise the Neo cassette and generate EP2lox/+ mice.
Figure 3.
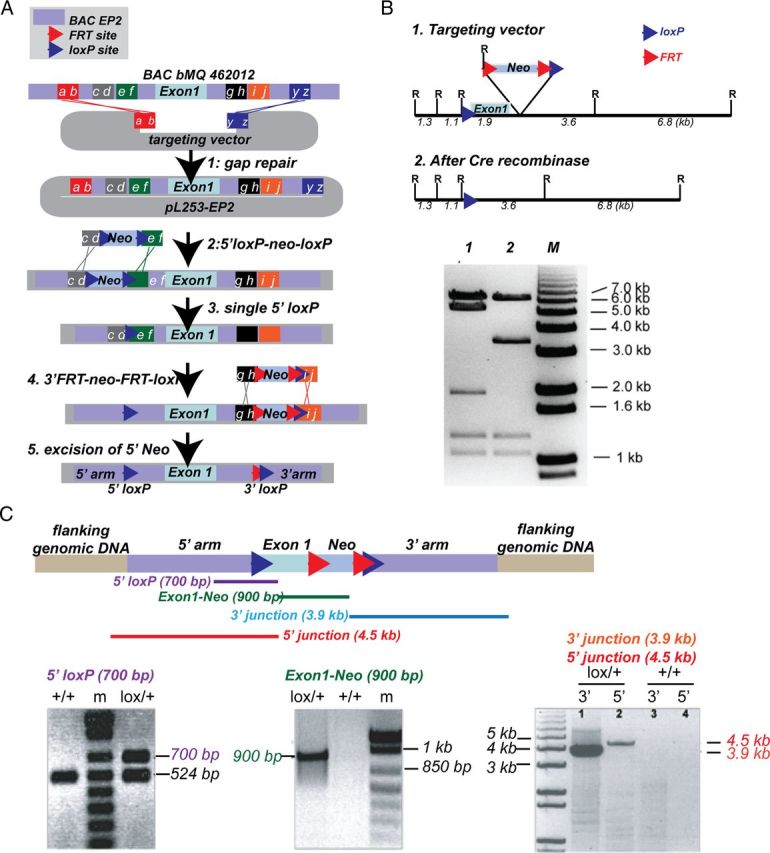
Generation of EP2lox/+ mice. A, Recombineering strategy to introduce loxP sites 5′ and 3′ to exon 1 of Ptger2 is diagrammed (see Materials and Methods). B, Diagrams are shown of the targeting vector with EcoRI (R) restriction sites before and after addition of recombinant Cre recombinase. Restriction map analysis of EcoRI digested targeting vector shows correct restriction digest after addition of Cre recombinase, and confirms functionality of loxP sites 5′ and 3′ to exon 1. C, PCR strategy for the identification of positive ES clones and validation of the correct insertion of the target sequences into the Ptger2 locus are shown. The 5′ loxP PCR fragment (in purple; 700 bp for floxed EP2 and 542 bp for wt) spans the inserted loxP site 5′ of Exon 1. The Exon-Neo junction (in green; 900 bp) spans the 3′ end of Exon 1 to the 5′ end of Neo. The 5′ junction PCR product (in red; 4.5 kb) spans flanking 5′ genomic sequences, the 5′ arm of the targeting construct, and the 5′ loxP site. The 3′ junction (in blue; 3.9 kb) spans the 3′ end of Neo through the 3′ arm of the targeting construct and the 3′ flanking genomic sequence. All PCR fragments were completely sequenced to confirm correct recombination and integration.
Functionality of the loxP sites in the targeting vector was confirmed with Cre recombinase and assayed by restriction fragment analysis (Fig. 3B). Before proceeding to electroporation in C57BL/6J ES cells, sequencing was performed on the entire targeting vector and vector construction was confirmed. Following electroporation into C57BL/6J ES cells, G418 resistant clones were screened by PCR of the 5′ loxP region and the Exon 1-Neo junction (Fig. 3C). Subsequent PCR was performed on positive clones to ascertain proper integration into the EP2 locus at the 5′ and 3′ insertion sites (Fig. 3C). PCR was performed on 5′ and 3′ junctions (Fig. 3C) and PCR fragments were sequenced to ascertain proper integration into the flanking genomic DNA. Finally, the integrity of the loxP sites in the positive ES clone 2G11 was confirmed with excision of loxP sequences with Cre recombinase followed by sequencing (data not shown).
Characterization of macrophages derived from Cd11bCre;EP2lox/lox mice
The Cd11bCre line, which drives expression of Cre recombinase in the monocyte lineage, was used to generate Cd11bCre;EP2lox/lox and control Cd11bCre;EP2+/+ C57BL/6 mice to test the function of macrophage/microglial EP2 in innate immune responses. The vital contribution of microglia to disease progression in the superoxide dismutase (SOD) mutant model of ALS was elegantly demonstrated using Cd11bCre recombinase deletion of SOD (Boillée et al., 2006). Genomic PCR detected a band of 967 bp in the wild-type (wt) allele, and a band of 788 bp for the loxP allele (Fig. 4A). Quantification of genomic DNA from macrophages purified with Cd11b antibody-conjugated beads by PCR demonstrated that Cd11b driven-Cre excision resulted in 66 and 74% remaining genomic EP2 DNA in the lox/lox and lox/+ genotypes, consistent with incomplete Cre excision, a general feature of Cre recombinase strategies (Fig. 4B). EP2 mRNA was also quantified by qPCR in peritoneal macrophages derived from Cd11bCre;EP2lox/lox and control Cd11bCre;EP2+/+ mice purified using Cd11b antibody-conjugated beads (Fig. 4C). Quantification of EP2 exon 1 mRNA levels demonstrated a near complete reduction in basal expression of EP2 mRNA in unstimulated macrophages. Stimulation with LPS (10 ng/ml) yielded expression of EP2 mRNA that was 56% lower in Cd11bCre;EP2lox/lox macrophages compared with Cd11bCre;EP2+/+ macrophages. The residual EP2 mRNA expressed basally and with LPS induction in Cd11bCre;EP2lox/lox is consistent with the general finding that Cre recombinase-driven excision of floxed sequences is not uniformly complete for many cell-specific promoters. Thus, conditional knock-outs are generally representative of a cell-specific knockdown of gene expression.
Figure 4.

Conditional deletion of the EP2 receptor in macrophages suppresses oxidative enzyme and cytokine gene expression. A, Genomic DNA PCR is shown for EP2+/+, EP2lox/+, and EP2lox/lox C57BL/6 mice. B, Quantitative genomic PCR was assayed for EP2+/+ wild-type, EP2+/−, EP2−/−, Cd11bCre;EP2lox/lox, Cd11bCre;EP2lox/+, and Cd11bCre;EP2+/+; values are relative to wild-type EP2+/+ control DNA. C, Peritoneal macrophages were isolated from adult Cd11bCre;EP2lox/lox and Cd11bCre;EP2+/+ mice and sorted using Cd11b antibody-conjugated magnetic beads before qPCR analysis. Basal levels of EP2 mRNA, assayed by qPCR, are reduced by 91% in Cd11bCre;EP2lox/lox compared with control macrophages (left; Cd11bCre;EP2lox/lox vs Cd11bCre;EP2+/+) and are reduced by 56% in LPS-stimulated Cd11bCre;EP2lox/lox macrophages (right; **p < 0.01; n = 5–6 per group). D, Conditional deletion of EP2 in macrophages reduces LPS-mediated increases in proinflammatory gene expression (two-way ANOVA for effect of LPS treatment is represented by ###p < 0. 001; Bonferroni's multiple-comparisons tests comparing mean of Cd11bCre;EP2+/+/LPS and Cd11bCre;EP2lox/lox/LPS were ***p < 0.001; n = 5–6 per group).
The effect of cell-specific deletion of EP2 in macrophages on inflammatory gene expression was then tested in LPS-stimulated macrophages (10 ng/ml for 1 h). LPS-mediated induction of inflammatory mRNAs was significantly reduced in Cd11bCre;EP2lox/lox macrophages by 71.73% for COX-2, and 76.54, 44.49, and 85,52% for cytokines IL1β, TNFα, and IL-6, respectively (Fig. 4D). Additional studies revealed decreases in other inflammatory genes with conditional knock-out of EP2, notably gp91phox, a component of the NADPH oxidase complex (post hoc p < 0.05). Thus, conditional deletion of EP2 in LPS-stimulated peritoneal macrophages significantly attenuated induction of proinflammatory gene expression.
Macrophage/microglial EP2 elicits peripheral and central proinflammatory effects in vivo
Functional testing of the role of macrophage/microglial EP2 in LPS-mediated inflammation was then carried in cohorts of Cd11bCre;EP2+/+ and Cd11bCre;EP2lox/lox mice. LPS (5 mg/kg) was given intraperitoneally and blood plasma and brain tissue were collected at 6 h after LPS administration. Of the 12 factors regulated in plasma with global deletion of EP2 (Fig. 1), IL-6 and TNFα were significantly reduced in Cd11bCre;EP2lox/lox mice (Fig. 5A) while cytokines IL1β, IL-4, IL-12, IL-13 and IL-17 and chemokines IP-10, MIP-1α, GM-GCF, and RANTES were partially but not significantly reduced (data not shown).
Figure 5.

Conditional deletion in vivo of EP2 in macrophages and microglia elicits significant reduction in innate immune inflammation peripherally and in the brain. Cd11bCre;EP2+/+ and Cd11bCre;EP2lox/lox mice were stimulated with vehicle or LPS (5 mg/kg, i.p.) and plasma was collected 6 h later. A, Plasma TNFα levels and IL-6 levels were significantly reduced in Cd11bCre;EP2lox/lox mice treated with LPS compared with controls (two-way ANOVA for effect of LPS treatment is represented by ###p < 0.001; Bonferroni's multiple-comparison tests comparing mean of Cd11bCre;EP2+/+/LPS and Cd11bCre;EP2lox/lox/LPS ***p < 0.001; n = 4 per group). B, Iba1 stained hippocampal sections demonstrates a marked activation of microglia 6 h after systemic administration of LPS, indicating transfer of peripheral innate immune response to the CNS (scale bar, 25 μm). C, Microglial activation, as measured by Iba1 immunofluorescence % area, is increased in control Cd11bCre;EP2+/+ hippocampus with peripheral LPS administration, but not in Cd11bCre;EP2lox/lox hippocampus (two-way ANOVA for effect genotype is represented by *p < 0.05; Bonferroni's multiple-comparisons test comparing mean of Cd11bCre;EP2+/+/veh and Cd11bCre;EP2+/+/LPS is #p < 0.05; n = 4 per group). D, TNFα, IL-6, IL1β, and iNOS mRNAs are induced at 6 h in hippocampus after systemically administered LPS in Cd11bCre;EP2+/+ mice but levels are significantly suppressed in Cd11bCre;EP2lox/lox mice (two-way ANOVA for effect of LPS treatment is represented by ###p < 0.001 for TNFα, IL-6, IL1β, and was p = 0.059 for iNOS; Bonferroni's multiple-comparison tests comparing mean of Cd11bCre;EP2+/+/LPS and Cd11bCre;EP2lox/lox/LPS were *p < 0.05 or **p < 0.01. E, ELISA of cortical brain lysates shows significant decrease in IL-6 levels in LPS-treated Cd11bCre;EP2lox/lox mice compared with controls (n = 7–8 per group; 2-way ANOVA for effect of LPS treatment is represented by ###p < 0.001; Bonferroni's multiple-comparison test comparing mean of Cd11bCre;EP2+/+/LPS and Cd11bCre;EP2lox/lox/LPS was *p < 0.05).
LPS administered systemically induces an inflammatory response in brain (Shi et al., 2010). The innate immune response in brain can occur either as a direct response to pathogens by brain perivascular macrophages or as a peripheral-to-central immune response, in which serum cytokines are transported across the blood–brain barrier or act on endothelium to transduce the inflammatory response to brain parenchyma. The resultant CNS innate immune response is characterized by activation of microglial cells and generation of neurotoxic reactive oxygen species, cytokines, and proteases that can lead to synaptic injury and behavioral deficits (McGeer and McGeer, 2004; Minghetti, 2005; Qin et al., 2007; Semmler et al., 2007; Liu et al., 2008). Six hours after LPS, hippocampal microglia demonstrated morphological changes characteristic of activation with thickening of microglial processes and increased Iba1 staining (Fig. 5B). Cd11bCre;EP2+/+ mice, but not Cd11bCre;EP2lox/lox mice demonstrated a significant increase in hippocampal Iba1 protein levels in response to systemic LPS (Fig. 5C). Examination of hippocampal mRNA levels of candidate proinflammatory genes, including TNFα, IL-6, IL1β, and iNOS demonstrated a significant increase in LPS-treated Cd11bCre;EP2+/+ mice that was suppressed in Cd11bCre:EP2lox/lox mice (Fig. 5D), indicating a blunted systemic and brain innate immune response with deletion of macrophage/microglial EP2 receptor. Measurement of the cytokine IL-6 demonstrated a significant reduction in cerebral cortex of Cd11bCre;EP2lox/lox compared with control Cd11bCre;EP2+/+mice (Fig. 5D). Together, these data demonstrate that macrophage/microglial EP2 signaling promotes a proinflammatory response peripherally and in the CNS in the systemic LPS model of innate immunity.
Microglial EP2 mediates neuroinflammatory responses in the MPTP model of Parkinson's disease
We next turned to a model of brain-specific injury and inflammation to more directly assess the contribution of microglial EP2 signaling to neuroinflammation (Fig. 6). The MPTP model is an acute model of dopaminergic (DA) neuron death, which leads to secondary microglial and astrocytic activation and secondary neurotoxicity (Jackson-Lewis and Smeyne, 2005). Here, 3-month-old male Cd11bCre;EP2lox/lox and control Cd11bCre;EP2+/+ mice were administered either vehicle or MPTP, and the substantia nigra pars compacta (SNpc) was examined at 7 d after MPTP administration for evidence of microglial and astrocytic activation, and loss of tyrosine hydroxylase (TH)-positive dopaminergic neurons. Striatal tissue was examined for measurement of dopamine, its metabolites, and DA turnover.
Figure 6.
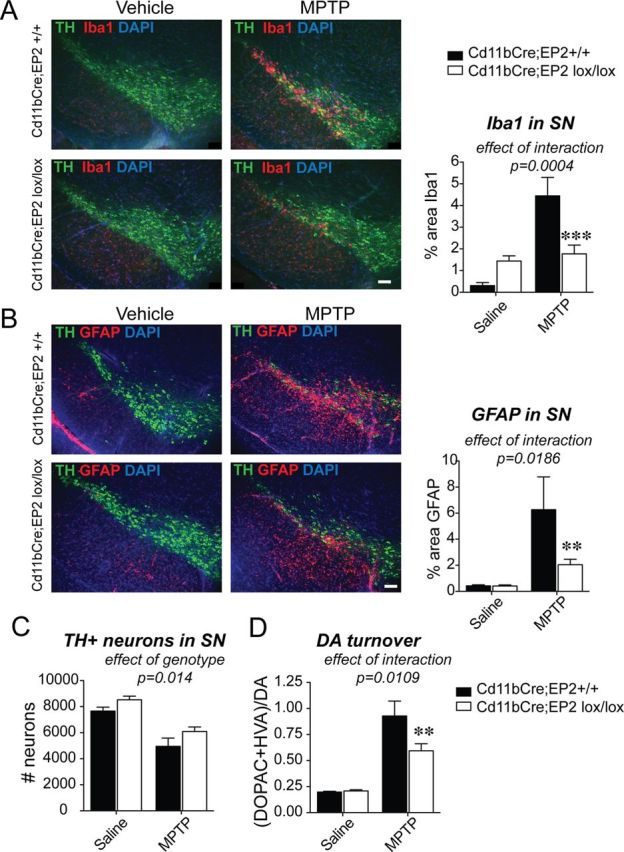
Conditional deletion of EP2 in microglia and macrophages reduces glial activation in the MPTP model of Parkinson's disease. Three-month-old male Cd11bCre;EP2lox/lox and control Cd11bCre;EP2+/+ mice were administered either vehicle or MPTP and SNpc was examined at 7 d after MPTP (n = 4–8 per group). A, Immunofluorescent staining of TH in dopaminergic neurons of the SN, Iba1 in microglia, and nuclear stain DAPI is shown for all four groups at 7 d after MPTP; (ANOVA effect of interaction, p = 0.004, Bonferroni post hoc ***p < 0.001; scale bar, 200 μm). B, GFAP immunofluorescence is significantly increased at 7 d after MPTP and is reduced in Cd11bCre;EP2lox/lox mice (ANOVA effect of interaction, p = 0.0186; Bonferroni post-test **p < 0.01; scale bar, 200 μm). C, Quantification of TH-positive neurons in SNpc shows effect of genotype and treatment only (p = 0.014 and p < 0.0001, respectively). D, DA turnover is significantly reduced with loss of microglial EP2 in MPTP-treated mice (ANOVA effect of interaction, p = 0.0109; Bonferroni post-test **p < 0.01).
Quantification of Iba1 immunostaining showed a higher percentage Iba1-positive area in MPTP versus vehicle-treated Cd11bCre;EP2+/+ mice at 7 d after MPTP (Fig. 6A), consistent with previous studies (Liberatore et al., 1999). There was a reduction in Iba1 immunoreactivity in MPTP-treated Cd11bCre;EP2lox/lox mice compared with MPTP-treated Cd11bCre;EP2+/+ mice, consistent with a suppressed inflammatory response with deletion of microglial EP2. Interestingly, there was an upregulation of Iba1 basally in vehicle-treated Cd11bCre;EP2lox/lox compared with Cd11bCre;EP2+/+ mice, suggesting that deletion of EP2 receptor in microglia may alter their resting inflammatory phenotype. Two-way ANOVA showed a significance for effect of treatment (F(3,16) = 25.40, p < 0.0001) and interaction (F(3,16) = 18.39, p = 0.0004); effect of genotype was as follows: F(3,16) = 3.04, p = 0.09.
Quantification of the astrocytic marker GFAP also demonstrated a higher percentage GFAP-positive area in MPTP versus vehicle-treated Cd11bCre;EP2+/+ mice with a marked decrease in levels in MPTP-treated Cd11bCre;EP2lox/lox mice (Fig. 6B). Two-way ANOVA showed significance for effect of treatment (F(3,18) = 20.57, p = 0.0002), genotype (F(3,18) = 6.615, p = 0.02), and interaction (F(3,18) = 6.51, p = 0.02). MPTP-treated Cd11bCre;EP2lox/lox mice showed decreased astrocytic activation, indicating that astrocytic activation is in part regulated by EP2 microglial signaling. Despite this significant reduction in microglial and astrocytic activation, there was no genotype/treatment interaction for rescue of TH+ neurons with deletion of microglial EP2 with MPTP (F(3,16) = 0.136, p = 0.72), although there was significance of treatment (F(3,16) = 48.7, p < 0.0001) and interestingly a significant effect of genotype (F(3,16) = 7.40, p = 0.014) (Fig. 6C). The effect of genotype indicates that loss of microglial EP2 is independent of treatment and suggests that microglial EP2 may negatively influence neuronal survival. One possibility is that EP2 signaling promotes basal generation of proinflammatory molecules by microglia and deletion of microglial EP2 would abrogate this in both vehicle and MPTP-treated mice. Striatal DA levels showed a nonsignificant trend [effect of interaction (F(3,19) = 4.256, p = 0.051)] but DA turnover showed significance for interaction (F(3,19) = 7.74, p = 0.01), genotype (F(3,19) = 6.853, p = 0.02), and treatment (F(3,19) = 81.6, p < 0.0001) (Fig. 6D), indicating that the EP2-mediated microglial signaling, at least in part, contributes to acute toxicity and oxidative injury in this model. Increased dopamine turnover is indicative of an enhanced compensatory response due to greater injury, mainly ATP depletion. Although microglial EP2 deficiency was not sufficient to protect against acute oxidative challenge, a reduced inflammatory insult might contribute to increased long-term recovery within injured but surviving striatal terminals. Together, these findings indicate that in the context of similar degrees of neuronal injury, selective deletion of EP2 in microglia strongly reduces secondary inflammatory responses in brain.
Loss of microglial EP2 signaling reduces genome-wide transcription of inflammatory genes
To further explore the effects of EP2 signaling in microglia, we turned to an unbiased approach by performing microarray analysis of microglia isolated from 8–9-month-old Cd11bCre;EP2+/+ and Cd11bCre;EP2lox/lox mice (Fig. 7; Table 2). One-hundred and thirty-six genes were identified that were differentially regulated with deletion of microglial EP2 in adult brain (>1.5-fold and p < 0.05). Unsupervised hierarchical clustering revealed a striking downregulation of a majority of microglial genes with EP2 deletion (Fig. 7A), with 116 genes significantly downregulated ≥1.5-fold (85.3%) and 20 genes upregulated by ≥1.5-fold (14.7%). The principal biological functions represented by the differentially regulated genes included the immune response, cytoskeletal function, and cell cycle/mitosis (Table 2). Immune molecules functioning in cytokine and chemokine signaling, chemotaxis and cell adhesion, and immune cell activation were significantly downregulated. Interestingly, cell cycle and mitosis as well as signaling molecules involved in cell cycle progression, cytoskeletal function, and chromatin assembly were also significantly downregulated. Together, the suppression of gene expression in these biological pathways suggests a decreased inflammatory and proliferative state of EP2 conditional knock-out microglia.
Figure 7.

Conditional deletion of microglial EP2 reduces immune gene expression by unbiased microarray analysis. A, Unsupervised hierarchical clustering of adult microglial gene expression profiles that are significantly different between Cd11bCre;EP2+/+ (n = 4) and Cd11bCre;EP2lox/lox (n = 3) mice is shown. Genes with a fold change of >1.5 and an unadjusted p value <0.05 are shown in the node map. Rows represent individual genes (not labeled) and columns represent genotypes (labeled at the bottom). Color shades indicate increased (red) or decreased (blue) expression. B, Pathway analysis of the highly regulated immune molecules (fold >1.7; p < 0.05) identifies primary relationships derived from the Ingenuity Knowledge Base; dashed lines represent regulation of expression (red for increasing expression level, and blue for decreasing expression level) and solid lines represent protein-protein interactions. All immune molecules and the transcriptional regulator NFkbid are downregulated (overlaid in green) in Cd11bCre;EP2lox/lox microglia. COX-2, which is regulated by EP2 signaling, and which itself regulates EP2 expression, represents a major regulatory node for immune receptor and cytokine expression. C, EP2 mRNA and COX-2 mRNA are reduced in Cd11bCre;EP2lox/lox microglia (*p < 0.05; n = 4–6 per group).
Table 2.
List of differentially regulated classes of genes in microglia derived from Cd11bCre;EP2lox/lox versus Cd11bCre;EP2+/+ brains
| Gene symbol | Gene name | Fold change | GO process/function/molecular component | |
|---|---|---|---|---|
| Immune response | IL1B | interleukin 1, beta | −2.04184 | Cytokine activity |
| IL1R2 | interleukin 1 receptor, type II | −2.31737 | Cytokine receptor | |
| Il1f9 | interleukin family member, 9 | −2.04786 | Cytokine activity | |
| CXCR2 | chemokine (C-X-C motif) receptor 2 | −1.86059 | Chemotaxis | |
| CXCR4 | chemokine (C-X-C motif) receptor 4 | −1.86059 | Chemotaxis | |
| THBS1 | thrombospondin 1 | −1.95183 | Cell adhesion | |
| SSP1 | Osteopontin | −1.54035 | Cell adhesion | |
| ITGAL | integrin, alpha L | −1.58753 | Cell adhesion | |
| TROAP | trophinin associated protein | −1.75552 | Cell adhesion | |
| Clec4n | C-type lectin domain family 4, member N | −1.61132 | Carbohydrate binding | |
| Clec4d | C-type lectin domain family 4, member d | −2.1454 | Carbohydrate binding | |
| KLRD1 | killer cell lectin-like receptor subfamily D, mbr 1 | −1.65784 | Carbohydrate binding | |
| PTGS2 | prostaglandin-endoperoxide synthase 2 (COX-2) | −2.17048 | Cnflammatory response | |
| TREM1 | triggering receptor expressed on myeloid cells 1 | −1.69313 | Innate immune response | |
| MMP9 | matrix metallopeptidase 9 | −1.61825 | Extracellular matrix organization | |
| PILRB | paired immunoglobin-like type 2 receptor beta | −1.81032 | Myeloid dendritic activation | |
| FPR1 | formyl peptide receptor 1 | −1.7669 | TLR1 signaling pathway | |
| ECM1 | extracellular matrix protein 1 | −1.70548 | Regulation of type 2 immune response | |
| HDC | histidine decarboxylase | −1.67452 | Histamine biosynthetic process | |
| Stfa2 | stefin A2 | −1.96096 | Regulator of phospholipase A2 activity | |
| Cfp | complement factor properdin | −1.65784 | Extracellular matrix | |
| Cell cycle | ANAPC1 | anaphase promoting complex subunit 1 | −2.1456 | Anaphase promoting complex |
| ANAPC2 | anaphase promoting complex subunit 2 | −2.13443 | Anaphase promoting complex | |
| CCNA2 | cyclin A2 | −1.67413 | Regulation of cell cycle | |
| CCNB2 | cyclin B2 | −1.70104 | Regulation of cell cycle | |
| CDKN3 | cyclin-dependent kinase inhibitor 3 | −1.8019 | Cell cycle | |
| CENPE | centromere protein E, 312kDa | −1.81685 | M phase of mitotic cycle | |
| CENPF | centromere protein F, 350/400kDa (mitosin) | −1.68826 | M phase of mitotic cycle | |
| NUSAP1 | nucleolar and spindle associated protein 1 | −1.82572 | Mitotic cytokinesis | |
| CEP55 | centrosomal protein 55kDa | −2.07399 | Mitosis | |
| MKI67 | antigen identified by monoclonal antibody Ki-67 | −1.79318 | Cell proliferation | |
| ASPM | asp (abnormal spindle) homolog | −1.98094 | Maintenance of centrosome location | |
| BUB1B | budding uninhibited by benzimidazoles 1 hom ß | −1.8033 | Metaphase/anaphase transition mitotic cell cycle | |
| SPAG5 | sperm associated antigen 5 | −1.72396 | Mitotic sister chromatic segregation | |
| PRC1 | protein regulator of cytokinesis 1 | −1.89456 | Maintenance of transcriptionally repressed state | |
| Cks2 | CDC28 protein kinase regulatory subunit 2 | −1.75907 | Cell cycle | |
| Nuf2 | NUF2, NDC80 kinetochore complex component | −1.74007 | Mitosis | |
| STIL | SCL/TAL1 interrupting locus | −1.76871 | Notch receptor processing, ligand independent | |
| Cytoskeletal function | CKAP2L | cytoskeleton associated protein 2-like | −1.71323 | Component of centrosome |
| KIF11 | kinesin family member 11 | −1.76381 | Kinesin motor activity | |
| KIF15 | kinesin family member 15 | −1.70974 | Kinesin motor activity | |
| KIF18B | kinesin family member 18B | −1.92932 | Kinesin motor activity | |
| KIF20A | kinesin family member 20A | −1.92174 | Kinesin motor activity | |
| KIF22 | kinesin family member 22 | −1.82174 | Kinesin motor activity | |
| KIF2C | kinesin family member 2C | −1.88518 | Kinesin motor activity | |
| TPX2 | TPX2, microtubule-associated, homolog | −1.77056 | Regulation of mitotic spindle organization | |
| Signal transduction | Ttk | Ttk protein kinase | −1.68733 | ser/thr kinase activity |
| Ect2 | ect2 oncogene | −1.77594 | Cytokinesis | |
| Arfgef1 | ADP-ribosylation factor guanine nt-exchange factor | −2.14379 | Vesicle-mediated transport | |
| AURKA | aurora kinase A | −1.873 | Mitotic cell cycle | |
| MASTL | microtubule associated serine/threonine kinase-like | −1.94399 | G2/M transition of mitotic cell cycle | |
| MELK | maternal embryonic leucine zipper kinase | −1.74326 | Protein phosphorylation | |
| NEK2 | NIMA-related kinase 2 | −1.91723 | Mitotic sister chromatid segregation | |
| PIM1 | pim-1 oncogene | −1.92845 | Cell proliferation | |
| PLK1 | polo-like kinase 1 | −1.75168 | G2/M transition of mitotic cell cycle | |
| RACGAP1 | Rac GTPase activating protein 1 | −1.73564 | Cytokinesis, initiation of separation | |
| Pbk | PDZ binding kinase | −1.68555 | Protein phosphorylation | |
| Proteolysis | HUWE1 | HECT, UBA and WWE domain 1, E3 Ub protein ligase | −2.38982 | Protein ubiquitination |
| Itch | itchy, E3 ubiquitin protein ligase | −1.92047 | Protein ubiquitination | |
| Metabolic | Sult2a7 | sulfotransferase family 2A, dehydroepiandrosterone | −1.72082 | Sulfotransferase activity |
| ESD | esterase D | −1.77798 | Formaldehyde catabolic process | |
| Exocytosis RNA processing | Exoc7 | exocyst complex component 7 | 2.01344 | Exocytosis |
| Tbl3 | transducin (beta)-like 3 | 1.98707 | rRNA processing | |
| Rrn3 | RRN3 RNA polymerase I transcription factor homolog | 1.93842 | Positive regulation of transcription | |
| Pabpn1 | poly(A) binding protein, nuclear 1 | 2.47361 | mRNA polyadenylation | |
| Transcription | DEPDC1 | DEP domain containing 1 | −1.79393 | Transcriptional repressor/signal transduction |
| NFKBID | NFkB inhibitor, delta | −1.65827 | Negative regulation of NFkB activity | |
| Chromatin assembly | H2AFX | H2A histone family, member X | −1.75055 | Nucleosome assembly |
| Hist1h2ag | histone cluster 1, H2ag | −1.78355 | Nucleosome assembly | |
| Hist1h2ab | histone cluster 1, H2ab | −2.1247 | Nucleosome assembly |
Listed are genes with a known Gene Ontology (GO pathway) process or function. cDNAs coding for unknown proteins or predicted genes are not listed.
To further define connections between immune molecules that were regulated by microglial EP2 signaling, we performed Ingenuity Pathway analysis to define networks of differentially regulated immune genes (1.5-fold and greater) that were connected to each other either through regulation of expression or protein-protein binding. Interestingly, COX-2 was highly downregulated with EP2 deletion, and as COX-2 catalyzes the formation of PGH2, the precursor of PGE2 that activates the EP2 receptor, this suggests a feedforward cycle in which EP2-mediated increases in COX-2 expression results in further production of PGE2, activation of the EP2 receptor, and proinflammatory responses. In this case, deletion of EP2 receptor suppressed COX-2 expression, and this central relationship is visualized in Figure 7B. Thus, conditional knock-out of microglial EP2 (shown in blue) resulted in the downregulation of most inflammatory genes represented in the pathway, in large part through downregulation of COX-2, which drives expression of multiple immune genes. From the Ingenuity Knowledge base, COX-2 is known to upregulate the expression of immune molecules (red arrows) including TREM1, CXCR2, CXCR4, ITGAL, and the metalloprotease MMP-9. Together, these findings indicate a widespread suppression in immune gene activation with knockdown of microglial EP2 signaling, transduced in part through reduction of COX-2 expression. Downregulated immune response genes encoded proteins involved in cytokine signaling, notably IL1β and the IL1 receptor 2, chemokine signaling (CXCR2 and CXCR4), cell adhesion molecules including thrombospondin, osteopontin, and the integrin ITGAL, carbohydrate-binding lectins (Clec4n, Clec4d, and KLRD1), and toll-like receptor signaling molecules (TREM1 and formyl peptide receptor 1 or FPR1). Genes involved in microglial activation, including the paired immunoglobin-like type 2 receptor β (PILRB), a glycoprotein involved in myeloid lineage activation, and the phospholipase activator Stfa2, were also significantly downregulated. Quantification of EP2 mRNA in adult microglia used for microarray analysis revealed a decrease of 48% in Cd11bCre;EP2lox/lox microglia (Fig. 7C), consistent with our previous observation that Cd11bCre driven excision of floxed EP2 sequences corresponded to a ∼50% knockdown of EP2 mRNA expression in peritoneal macrophages (Fig. 4B), and a decrease of 58% in COX-2 mRNA.
Loss of macrophage/microglial EP2 receptor does not alter levels of monocyte subpopulations
To control for an effect of conditional deletion of EP2 on overall numbers and subtypes of monocytic cells, we performed flow cytometry to quantify levels of Cd11b+ monocytic subpopulations in Cd11bCre;EP2lox/lox and Cd11bCre;EP2+/+ mice (Fig. 8). Immunophenotyping of peripheral blood and spleen Cd11b+ populations using flow cytometry was performed in Cd11bCre;EP2lox/lox versus Cd11bCre;EP2+/+ mice that had been systemically stimulated with either vehicle or LPS 6 h before analysis. After exclusion of debris, dead cells, and doublets, CD11b+ cells were subdivided using CD115 and Ly6C, which are markers of monocytes, to yield four distinct populations of CD11b+ cells: (1) macrophages, CD115−/Ly6C−, (2) neutrophils, CD115−/Ly6Cint-hi, (3) resident monocytes, CD115int/Ly6Cint, and (4) inflammatory monocytes, CD115hi-int/Ly6Chi (Fig. 8A). Percentage levels of macrophages, resident monocytes, and inflammatory monocytes did not differ between genotypes in peripheral blood or in spleen following vehicle administration, or after LPS stimulation (Fig. 8B). Following LPS, the percentage of neutrophils increased following LPS in spleen and blood, with no difference between genotypes in spleen but a decrease in peripheral blood, a finding that could reflect a milder inflammatory response in Cd11bCre;EP2lox/lox mice. Additional phenotyping of spleen CD11b+ cells did not show differences in MHC Class II levels, a measure of cellular activation, between genotypes with either vehicle or LPS treatment in macrophages, neutrophils, resident monocytes, or inflammatory monocytes (data not shown). In additional experiments, quantification of absolute numbers of microglia isolated from brain using CD11b-tagged magnetic beads from Cd11bCre;EP2lox/lox and Cd11bCre;EP2+/+ mice did not show differences in cell number (Fig. 8C). Together, conditional deletion of EP2 in Cd11bCre;EP2lox/lox mice does not alter levels of monocyte-subtype populations, notably resident monocytes, inflammatory monocytes, and macrophages in spleen or in peripheral blood, and does not alter numbers of CD11b+ microglia in brain.
Figure 8.

Examination of levels of monocytic populations in Cd11bCre;EP2+/+ and Cd11bCre;EP2lox/lox mice. Splenocytes and peripheral blood immune cells were isolated from 3-month-old mice. A, Representative plots for CD11b+ cells gated on CD115 and Ly6C yielding four populations of cells, including CD115−/Ly6C− macrophages, CD115−/Ly6Cint-hi neutrophils, CD115int/Ly6Cint resident monocytes, and CD115hi-int/Ly6Chi inflammatory monocytes in vehicle and LPS-treated mice. B, Quantification of levels of monocytic populations, including macrophages, resident monocytes, and inflammatory monocytes does not show differences between genotypes in vehicle or LPS-treated mice. Levels of neutrophils are decreased in peripheral blood with LPS, but not vehicle stimulation (*p < 0.05; n = 4 mice per group). C, Quantification of CD11b-positive microglia derived from brains of Cd11bCre;EP2+/+ and Cd11bCre;EP2lox/lox mice does not show differences in number (n = 5–7 mice per genotype). D, Comparison of copy number of EP2/copy number of 18S is shown for adult microglia and peritoneal macrophages from Cd11bCre;EP2+/+ and Cd11bCre;EP2lox/lox mice (n = 4–6 per group; p < 0.05 unpaired t test). Macrophage expression of EP2 in Cd11bCre;EP2+/+ mice was 28-fold higher; however, the percentage reduction of expression with conditional deletion of EP2 was similar in both microglia and macrophages, and was 62.2 and 62.1%, respectively.
To assess relative levels of microglial and peritoneal macrophage EP2 mRNA expression in both genotypes, EP2 expression levels were quantified as copies of EP2 per copy of the reference gene 18S, determined by the comparative cycle threshold (Fig. 8D). The mean value for Cd11bCre;EP2+/+ copies of EP2/copies of 18S was 28-fold higher than for microglial EP2 (means for macrophage and microglial EP2 Cd11bCre;EP2+/+ were 1.24 × 10⁻⁴ and 4.42 × 10⁻⁶, respectively). However, percentage reduction of expression with conditional deletion of EP2 was similar in both cell types, and was 62.2% for microglia and 62.1% for macrophages, indicating that excision efficacy of the Cd11b-driven Cre recombinase was the same in both cell types.
Discussion
Here, we demonstrate a broad modulatory role of the PGE2 EP2 receptor in macrophage/microglial innate immune responses. Multiple immune factors in blood and inflammatory endothelial factors were reduced in mice with global deletion of EP2 after systemic administration of LPS. In vitro, activation of macrophage EP2 receptor magnified the proinflammatory response to LPS, consistent with the in vivo plasma proteomic data. Cell-specific deletion of EP2 receptor in monocyte lineage cells, including macrophages, monocytes, and microglia, blunted the LPS-mediated innate immune response peripherally and in the CNS, as well as in the MPTP model of secondary microglial inflammation in the substantia nigra. Unbiased examination of gene expression regulated by microglial EP2 in adult EP2-deficient microglia revealed a significant suppression of inflammatory genetic pathways regulated by COX-2.
The importance of PGE2 EP2 signaling lies in its profound proinflammatory function in neurodegenerative models where innate immune responses play a significant role in progression of pathology. Global deletion of EP2 reduces inflammation and pathology in models of Alzheimer's disease, Parkinson's disease, and ALS (Liang et al., 2005, 2008; Jin et al., 2007; Keene et al., 2010). In response to LPS, EP2 expression is strongly induced in brain (Zhang and Rivest, 1999; Brenneis et al., 2011) and mediates the majority of inflammatory lipid peroxidation (Montine et al., 2002). In macrophages, EP2 is the most highly expressed PGE2 receptor, suggesting a prominent role of EP2 in transducing inflammatory PGE2 signaling in innate immunity (Zaslona et al., 2012). While EP2 potentiated IL1β transcription in macrophages, the finding that EP2−/− mice have dramatically reduced IL1β plasma levels suggests the intriguing possibility that EP2 may modulate inflammasome cleavage of proIL1β. Deletion of EP2 also lowered factors released from endothelium linked to inflammatory responses after tissue injury, including fibrinogen (Davalos et al., 2012) and vWF (Khan et al., 2012). Interestingly, EP2 signaling also regulated inflammatory endothelial factors that increase with age; IP-10, TIMP-1, and vWF have been recently identified in a screen for blood factors upregulated in aging that correlate with decreasing neurogenesis (Villeda et al., 2011). Our finding that EP2 is strongly upregulated by LPS in macrophages and enhances COX-2 expression in response to LPS suggests that EP2-mediated COX-2 generation of PGE2 in inflammatory conditions sets up a feedforward mechanism where proinflammatory signaling is perpetuated.
In Cd11bCre;EP2lox/lox mice, the potent cytokines TNFα and IL-6 were attenuated to the same extent in EP2−/− mice as they were in Cd11bCre;EP2lox/lox mice, indicating that EP2 signaling in monocyte-lineage cells strongly regulates generation of these two canonical cytokines. Moreover, proinflammatory iNOS and cytokine responses were abolished in hippocampus of Cd11bCre;EP2lox/lox mice after LPS exposure. Proinflammatory cytokines, including IL-6, IL1β, and TNFα, which were reduced in blood in EP2-deficient mice, have been implicated in transmission of peripheral inflammation to the brain (Qin et al., 2007; Chen et al., 2008; Barrientos et al., 2009; Teeling and Perry, 2009). Systemic inflammation transmitted to the CNS is highly relevant to neurodegenerative disease, as demonstrated in several disease models where peripheral inflammation exacerbates disease progression (Nguyen et al., 2004; Kitazawa et al., 2005; Cunningham et al., 2009) and where increases in systemic inflammatory molecules correlate with aging or progression to AD (Ray et al., 2007; Villeda et al., 2011; Cribbs et al., 2012). In aging, systemic inflammation worsens inflammatory responses in brain, perhaps due to priming of microglia from previous infections (Chen et al., 2008; Barrientos et al., 2009). IL1β, which was notably regulated by EP2, is strongly linked to cognitive impairment in hippocampal-dependent memory in aging rodents (Chen et al., 2008; Barrientos et al., 2009; Hein et al., 2010). Together, these findings suggest that monocyte-lineage EP2 signaling may play an important role in peripheral-to-central transmission of inflammation in aging and pathological states, involving peripheral monocytes and macrophages as well as brain microglia.
Peripheral administration of the neurotoxin MPTP leads to a stereotyped loss of DA neurons in the SN and an associated and robust inflammatory activation of microglia and astrocytes (Hirsch and Hunot, 2009). Whether this neuroinflammatory response directly contributes to neuronal loss in vivo is unclear. Pharmacological inhibitors of glial cell activation including minocycline (Wu et al., 2002) or nonsteroidal anti-inflammatory drugs (Teismann and Ferger, 2001; Teismann et al., 2003) prevent DA neuron loss in the MPTP model. Global knock-out of genes involved in oxidative stress pathways, including inducible nitric oxide synthase (Liberatore et al., 1999), COX-2 (Vijitruth et al., 2006), or NADPH oxidase (Wu et al., 2003), also confer neuroprotection in the MPTP model, although COX-2 and NADPH oxidase subunits are also expressed in neurons. Global deletion of EP2, which is expressed in microglia as well as in neurons, reduces dopamine loss after MPTP (Jin et al., 2007). Thus, a significant limitation of pharmacologic and global knock-out studies has been the lack of a cell-type-specific approach to inhibit microglial inflammation and determine its effect on neuronal survival in this model. The observed neuroprotection in EP2−/− mice may have occurred as a result of inhibition of toxic neuronal pathways, and without a cell-targeted approach, it is difficult to disentangle the contribution of neurons, astrocytes, microglia, and other cells in the progression of MPTP pathology. Interestingly, in Cd11bCre;EP2lox/lox mice, we observed a significantly reduced inflammatory Iba1 response after MPTP, without alteration of DA neuron loss in the SN. This suggests that the inflammatory response, at least that mediated by microglial-macrophage EP2, does not contribute to DA neuron loss in this model, illustrating a dissociation between MPTP-induced neuronal loss and secondary inflammatory processes. Interestingly, there was increased microglial activation as measured by levels of Iba1 at baseline in these mice, suggesting that EP2 signaling may regulate the resting state of microglia as well. This interpretation is supported by unbiased microarray analysis, which revealed a dominant downregulation of most differentially expressed genes, notably inflammatory and cell cycle genes with deletion of microglial EP2. This altered state of activation could confer some resistance to further activation by inflammatory stimuli, a hypothesis supported by the lack of difference in microglial activation between vehicle and MPTP-treated Cd11bCre;EP2lox/lox mice. The suppression of proinflammatory effectors molecules may underlie the unexpected increase in TH-positive neurons noted in vehicle and MPTP-treated Cd11bCre;EP2lox/lox mice, where a more anti-inflammatory and trophic environment may lead to increased numbers of DA neurons in SN. It is noteworthy that polymorphisms in genes encoding immune molecules, for example IL1β, are associated with a higher risk of developing PD (Wahner et al., 2007), and IL1β is among the most downregulated immune genes in Cd11bCre;EP2lox/lox microglia. Alternatively, as microglia function in neural development and synaptogenesis (Schafer et al., 2013), the increase in DA neurons could reflect a developmental role of EP2 microglial signaling. Regarding the suppressed inflammatory gene expression in EP2-deficient microglia, Cd11bCre;EP2lox/lox microglia appear neither classically activated (M1) nor alternatively activated (M2) as they are neither secreting proinflammatory cytokines that initiate neurotoxicity nor are they producing anti-inflammatory or trophic factors, respectively. Rather, the microglia appear to be in a quiescent state, with reductions in immune function, cell cycle, cytoskeletal function, signal transduction, and proteolysis.
Finally, the crosstalk between microglia and astrocytes plays an important role in influencing inflammatory responses (Ransohoff and Perry, 2009; Liu et al., 2011). There were no differences in astrocyte activation at baseline in wild-type versus Cd11bCre;EP2lox/lox mice. However, astrocytic activation was reversed in Cd11bCre;EP2lox/lox mice treated with MPTP, suggesting an interdependent mechanism wherein microglia regulate astrocytic inflammatory responses via the EP2 receptor. The data support a direct effect of microglia on astrocytic activation in the setting of MPTP, but not at rest, as there was no change in GFAP levels in Cd11bCre;EP2lox/lox mice treated with vehicle. In addition, the lack of effect in DA neuron loss in Cd11bCre;EP2lox/lox substantia nigra with MPTP suggests that astrocytic and microglial activation may not be a cause of neurodegeneration in this model but rather a secondary effect. An important limitation of the MPTP model must be noted, however, as it represents an acute neurotoxin model of DA neuron injury and not a chronic model that recapitulates the progressive nature of neuropathology in PD, where toxic inflammation likely contributes to advancement of disease (Pradhan and Andreasson, 2012).
In experiments comparing basal and cKO levels of EP2 between microglia and peripheral macrophages, the percentage knockdown of EP2 was similar in both microglia and macrophages, consistent with similar efficacy of the Cd11b-regulated Cre recombinase in both cell types. Interestingly, we noted a 28-fold reduction in levels of microglial EP2 expression as compared with peritoneal macrophage levels, consistent with the broad diversity of gene expression in subpopulations of organ-specific macrophages (Gautier et al., 2012) that may in part reflect differences in local microenvironments of macrophage subpopulations. Differences in levels of EP2 expression between macrophages and microglia may similarly reflect their local microenvironment: a microglial cell exists in a highly interconnected and dense network of neurons, glia, and endothelial cells, an environment significantly different from that of a circulating macrophage, and may not require high levels of EP2 receptor to transduce signals from locally released PGE2. In addition, the relevance of higher levels of EP2 in macrophages versus microglia in models of neuroinflammation is likely to be context-dependent. For example, in the systemic LPS model, where there is a significant peripheral innate immune response that is transmitted to the CNS, macrophage EP2 signaling may play a greater role than microglial EP2 signaling in initiating the neuroinflammatory response. Conversely, in the MPTP model, where the site of primary injury is in the substantia nigra, the contribution of microglial EP2 signaling may be larger than that of macrophage EP2 signaling.
In conclusion, in this study we have shown that the PGE2 EP2 receptor in macrophages and microglia is a central mediator of the innate immune response, and in vivo deletion of macrophage/microglial EP2 profoundly dampens inflammation after LPS or MPTP challenge. Conditional targeting of immune modulators like the EP2 receptor represents an attractive pathway to increasing the understanding of cell-specific inflammatory processes, and our newly generated conditional model should be a useful tool in evaluating immune responses in inflammatory and neurodegenerative disease models. Selective inhibition of inflammatory EP2 signaling would avoid the adverse side effects seen with NSAIDs that inhibit COX-1 and COX-2 and block toxic as well as beneficial prostaglandin signaling pathways.
Footnotes
This work was supported by NIH RO1AG030209 (K.I.A.), NIH R21AG033914 (K.I.A.), Alzheimer's Association (K.I.A.), Swedish Research Council (J.U.J.), National Science Foundation (N.S.W. and S.P.), NIH NRSA F31NS074712 (S.P.), and NIH NRSA F31AG039195 (N.S.W.). We thank Tracey Hand for technical assistance, the Stanford Human Immune Monitoring Center for Luminex measurements, the Stanford Protein and Nucleic Acid Facility, the Stanford Shared FACS Facility, and Rita Fragoso for help with flow cytometry.
References
- Aloisi F, De Simone R, Columba-Cabezas S, Levi G. Opposite effects of interferon-gamma and prostaglandin E2 on tumor necrosis factor and interleukin-10 production in microglia: a regulatory loop controlling microglia pro- and anti-inflammatory activities. J Neurosci Res. 1999;56:571–580. doi: 10.1002/(SICI)1097-4547(19990615)56:6<571::AID-JNR3>3.0.CO%3B2-P. [DOI] [PubMed] [Google Scholar]
- Andreasson K. Emerging roles of PGE2 receptors in models of neurological disease. Prostaglandins Other Lipid Mediat. 2010;91:104–112. doi: 10.1016/j.prostaglandins.2009.04.003. [DOI] [PMC free article] [PubMed] [Google Scholar]
- Barrientos RM, Frank MG, Hein AM, Higgins EA, Watkins LR, Rudy JW, Maier SF. Time course of hippocampal IL-1 beta and memory consolidation impairments in aging rats following peripheral infection. Brain Behav Immun. 2009;23:46–54. doi: 10.1016/j.bbi.2008.07.002. [DOI] [PMC free article] [PubMed] [Google Scholar]
- Boillée S, Yamanaka K, Lobsiger CS, Copeland NG, Jenkins NA, Kassiotis G, Kollias G, Cleveland DW. Onset and progression in inherited ALS determined by motor neurons and microglia. Science. 2006;312:1389–1392. doi: 10.1126/science.1123511. [DOI] [PubMed] [Google Scholar]
- Brenneis C, Coste O, Altenrath K, Angioni C, Schmidt H, Schuh CD, Zhang DD, Henke M, Weigert A, Brüne B, Rubin B, Nusing R, Scholich K, Geisslinger G. Anti-inflammatory role of microsomal prostaglandin E synthase-1 in a model of neuroinflammation. J Biol Chem. 2011;286:2331–2342. doi: 10.1074/jbc.M110.157362. [DOI] [PMC free article] [PubMed] [Google Scholar]
- Breyer RM, Bagdassarian CK, Myers SA, Breyer MD. Prostanoid receptors: subtypes and signaling. Annu Rev Pharmacol Toxicol. 2001;41:661–690. doi: 10.1146/annurev.pharmtox.41.1.661. [DOI] [PubMed] [Google Scholar]
- Caggiano AO, Kraig RP. Prostaglandin E receptor subtypes in cultured rat microglia and their role in reducing lipopolysaccharide-induced interleukin-1β Production. J Neurochem. 1999;72:565–575. doi: 10.1046/j.1471-4159.1999.0720565.x. [DOI] [PMC free article] [PubMed] [Google Scholar]
- Chen J, Buchanan JB, Sparkman NL, Godbout JP, Freund GG, Johnson RW. Neuroinflammation and disruption in working memory in aged mice after acute stimulation of the peripheral innate immune system. Brain Behav Immun. 2008;22:301–311. doi: 10.1016/j.bbi.2007.08.014. [DOI] [PMC free article] [PubMed] [Google Scholar]
- Cribbs DH, Berchtold NC, Perreau V, Coleman PD, Rogers J, Tenner AJ, Cotman CW. Extensive innate immune gene activation accompanies brain aging, increasing vulnerability to cognitive decline and neurodegeneration: a microarray study. J Neuroinflammation. 2012;9:179. doi: 10.1186/1742-2094-9-179. [DOI] [PMC free article] [PubMed] [Google Scholar]
- Cunningham C, Campion S, Lunnon K, Murray CL, Woods JF, Deacon RM, Rawlins JN, Perry VH. Systemic inflammation induces acute behavioral and cognitive changes and accelerates neurodegenerative disease. Biol Psychiatry. 2009;65:304–312. doi: 10.1016/j.biopsych.2008.07.024. [DOI] [PMC free article] [PubMed] [Google Scholar]
- Davalos D, Ryu JK, Merlini M, Baeten KM, Le Moan N, Petersen MA, Deerinck TJ, Smirnoff DS, Bedard C, Hakozaki H, Gonias Murray S, Ling JB, Lassmann H, Degen JL, Ellisman MH, Akassoglou K. Fibrinogen-induced perivascular microglial clustering is required for the development of axonal damage in neuroinflammation. Nat Commun. 2012;3:1227. doi: 10.1038/ncomms2230. [DOI] [PMC free article] [PubMed] [Google Scholar]
- Franchi L, Muñoz-Planillo R, Núñez G. Sensing and reacting to microbes through the inflammasomes. Nat Immunol. 2012;13:325–332. doi: 10.1038/ni.2231. [DOI] [PMC free article] [PubMed] [Google Scholar]
- Funk Cd, FitzGerald GA. Cox-2 inhibitors and cardiovascular risk. J Cardiovasc Pharmacol. 2007;50:470–479. doi: 10.1097/FJC.0b013e318157f72d. [DOI] [PubMed] [Google Scholar]
- Gautier EL, Shay T, Miller J, Greter M, Jakubzick C, Ivanov S, Helft J, Chow A, Elpek KG, Gordonov S, Mazloom AR, Ma'ayan A, Chua WJ, Hansen TH, Turley SJ, Merad M, Randolph GJ, Randolph GJ. Gene-expression profiles and transcriptional regulatory pathways that underlie the identity and diversity of mouse tissue macrophages. Nat Immunol. 2012;13:1118–1128. doi: 10.1038/ni.2419. [DOI] [PMC free article] [PubMed] [Google Scholar]
- Hein AM, Stasko MR, Matousek SB, Scott-McKean JJ, Maier SF, Olschowka JA, Costa AC, O'Banion MK. Sustained hippocampal Il-1beta overexpression impairs contextual and spatial memory in transgenic mice. Brain Behav Immun. 2010;24:243–253. doi: 10.1016/j.bbi.2009.10.002. [DOI] [PMC free article] [PubMed] [Google Scholar]
- Hirsch EC, Hunot S. Neuroinflammation in Parkinson's disease: a target for neuroprotection? Lancet Neurol. 2009;8:382–397. doi: 10.1016/S1474-4422(09)70062-6. [DOI] [PubMed] [Google Scholar]
- Jackson-Lewis V, Smeyne RJ. MPTP and SNpc DA neuronal vulnerability: role of dopamine, superoxide and nitric oxide in neurotoxicity. Minireview. Neurotox Res. 2005;7:193–202. doi: 10.1007/BF03036449. [DOI] [PubMed] [Google Scholar]
- Jiang J, Quan Y, Ganesh T, Pouliot WA, Dudek FE, Dingledine R. Inhibition of the prostaglandin receptor EP2 following status epilepticus reduces delayed mortality and brain inflammation. Proc Natl Acad Sci U S A. 2013;110:3591–3596. doi: 10.1073/pnas.1218498110. [DOI] [PMC free article] [PubMed] [Google Scholar]
- Jin J, Shie FS, Liu J, Wang Y, Davis J, Schantz AM, Montine KS, Montine TJ, Zhang J. Prostaglandin E2 receptor subtype 2 (EP2) regulates microglial activation and associated neurotoxicity induced by aggregated alpha-synuclein. J Neuroinflammation. 2007;4:2. doi: 10.1186/1742-2094-4-2. [DOI] [PMC free article] [PubMed] [Google Scholar]
- Keene CD, Chang RC, Lopez-Yglesias AH, Shalloway BR, Sokal I, Li X, Reed PJ, Keene LM, Montine KS, Breyer RM, Rockhill JK, Montine TJ. Suppressed accumulation of cerebral amyloid {Beta} peptides in aged transgenic Alzheimer's disease mice by transplantation with wild-type or prostaglandin E2 receptor subtype 2-null bone marrow. Am J Pathol. 2010;177:346–354. doi: 10.2353/ajpath.2010.090840. [DOI] [PMC free article] [PubMed] [Google Scholar]
- Kennedy CR, Zhang Y, Brandon S, Guan Y, Coffee K, Funk CD, Magnuson MA, Oates JA, Breyer MD, Breyer RM. Salt-sensitive hypertension and reduced fertility in mice lacking the prostaglandin EP2 receptor. Nat Med. 1999;5:217–220. doi: 10.1038/5583. [DOI] [PubMed] [Google Scholar]
- Khan MM, Motto DG, Lentz SR, Chauhan AK. ADAMTS13 reduces VWF-mediated acute inflammation following focal cerebral ischemia in mice. J Thromb Haemost. 2012;10:1665–1671. doi: 10.1111/j.1538-7836.2012.04822.x. [DOI] [PMC free article] [PubMed] [Google Scholar]
- Kitazawa M, Oddo S, Yamasaki TR, Green KN, LaFerla FM. Lipopolysaccharide-induced inflammation exacerbates tau pathology by a cyclin-dependent kinase 5-mediated pathway in a transgenic model of Alzheimer's disease. J Neurosci. 2005;25:8843–8853. doi: 10.1523/JNEUROSCI.2868-05.2005. [DOI] [PMC free article] [PubMed] [Google Scholar]
- Lee EC, Yu D, Martinez de Velasco J, Tessarollo L, Swing DA, Court DL, Jenkins NA, Copeland NG. A highly efficient escherichia coli-based chromosome engineering system adapted for recombinogenic targeting and subcloning of BAC DNA. Genomics. 2001;73:56–65. doi: 10.1006/geno.2000.6451. [DOI] [PubMed] [Google Scholar]
- Liang X, Wang Q, Hand T, Wu L, Breyer RM, Montine TJ, Andreasson K. Deletion of the prostaglandin E2 EP2 receptor reduces oxidative damage and amyloid burden in a model of Alzheimer's disease. J Neurosci. 2005;25:10180–10187. doi: 10.1523/JNEUROSCI.3591-05.2005. [DOI] [PMC free article] [PubMed] [Google Scholar]
- Liang X, Wang Q, Shi J, Lokteva L, Breyer RM, Montine Tj, Andreasson K. The prostaglandin E2 EP2 receptor accelerates disease progression and inflammation in a model of amyotrophic lateral sclerosis. Ann Neurol. 2008;64:304–314. doi: 10.1002/ana.21437. [DOI] [PMC free article] [PubMed] [Google Scholar]
- Liang X, Lin L, Woodling NS, Wang Q, Anacker C, Pan T, Merchant M, Andreasson K. Neuronal and vascular protection by the prostaglandin E2 EP4 receptor in a mouse model of cerebral ischemia. J Clin Invest. 2011;121:4362–4371. doi: 10.1172/JCI46279. [DOI] [PMC free article] [PubMed] [Google Scholar]
- Liberatore GT, Jackson-Lewis V, Vukosavic S, Mandir AS, Vila M, McAuliffe WG, Dawson VL, Dawson TM, Przedborski S. Inducible nitric oxide synthase stimulates dopaminergic neurodegeneration in the MPTP model of Parkinson disease. Nat Med. 1999;5:1403–1409. doi: 10.1038/70978. [DOI] [PubMed] [Google Scholar]
- Liu P, Jenkins NA, Copeland NG. A highly efficient recombineering-based method for generating conditional knockout mutations. Genome Res. 2003;13:476–484. doi: 10.1101/gr.749203. [DOI] [PMC free article] [PubMed] [Google Scholar]
- Liu W, Tang Y, Feng J. Cross talk between activation of microglia and astrocytes in pathological conditions in the central nervous system. Life Sci. 2011;89:141–146. doi: 10.1016/j.lfs.2011.05.011. [DOI] [PubMed] [Google Scholar]
- Liu Y, Qin L, Wilson B, Wu X, Qian L, Granholm AC, Crews FT, Hong JS. Endotoxin induces a delayed loss of TH-IR neurons in substantia nigra and motor behavioral deficits. Neurotoxicology. 2008;29:864–870. doi: 10.1016/j.neuro.2008.02.014. [DOI] [PMC free article] [PubMed] [Google Scholar]
- Lund S, Christensen KV, Hedtjärn M, Mortensen AL, Hagberg H, Falsig J, Hasseldam H, Schrattenholz A, Pörzgen P, Leist M. The dynamics of the LPS triggered inflammatory response of murine microglia under different culture and in vivo conditions. J Neuroimmunol. 2006;180:71–87. doi: 10.1016/j.jneuroim.2006.07.007. [DOI] [PubMed] [Google Scholar]
- McGeer PL, McGeer EG. Inflammation and the degenerative diseases of aging. Ann N Y Acad Sci. 2004;1035:104–116. doi: 10.1196/annals.1332.007. [DOI] [PubMed] [Google Scholar]
- Meja KK, Barnes PJ, Giembycz MA. Characterization of the prostanoid receptor(s) on human blood monocytes at which prostaglandin E2 inhibits lipopolysaccharide-induced tumour necrosis factor-alpha generation. Br J Pharmacol. 1997;122:149–157. doi: 10.1038/sj.bjp.0701360. [DOI] [PMC free article] [PubMed] [Google Scholar]
- Milatovic D, Zaja-Milatovic S, Montine KS, Shie FS, Montine Tj. Neuronal oxidative damage and dendritic degeneration following activation of CD14-dependent innate immune response in vivo. J Neuroinflammation. 2004;1:20. doi: 10.1186/1742-2094-1-20. [DOI] [PMC free article] [PubMed] [Google Scholar]
- Minghetti L. Role of inflammation in neurodegenerative diseases. Curr Opin Neurol. 2005;18:315–321. doi: 10.1097/01.wco.0000169752.54191.97. [DOI] [PubMed] [Google Scholar]
- Minghetti L, Nicolini A, Polazzi E, Créminon C, Maclouf J, Levi G. Prostaglandin E2 downregulates inducible nitric oxide synthase expression in microglia by increasing camp levels. Adv Exp Med Biol. 1997;433:181–184. doi: 10.1007/978-1-4899-1810-9_37. [DOI] [PubMed] [Google Scholar]
- Montine TJ, Milatovic D, Gupta RC, Valyi-Nagy T, Morrow JD, Breyer RM. Neuronal oxidative damage from activated innate immunity is EP2 receptor-dependent. J Neurochem. 2002;83:463–470. doi: 10.1046/j.1471-4159.2002.01157.x. [DOI] [PubMed] [Google Scholar]
- Nguyen MD, D'Aigle T, Gowing G, Julien JP, Rivest S. Exacerbation of motor neuron disease by chronic stimulation of innate immunity in a mouse model of amyotrophic lateral sclerosis. J Neurosci. 2004;24:1340–1349. doi: 10.1523/JNEUROSCI.4786-03.2004. [DOI] [PMC free article] [PubMed] [Google Scholar]
- Pradhan S, Andreasson K. Commentary: progressive inflammation as a contributing factor to early development of Parkinson's disease. Exp Neurol. 2012;241c:148–155. doi: 10.1016/j.expneurol.2012.12.008. [DOI] [PubMed] [Google Scholar]
- Qin L, Wu X, Block ML, Liu Y, Breese GR, Hong JS, Knapp DJ, Crews FT. Systemic LPS causes chronic neuroinflammation and progressive neurodegeneration. Glia. 2007;55:453–462. doi: 10.1002/glia.20467. [DOI] [PMC free article] [PubMed] [Google Scholar]
- Quan Y, Jiang J, Dingledine R. EP2 receptor signaling pathways regulate classical activation of microglia. J Biol Chem. 2013;288:9293–9302. doi: 10.1074/jbc.M113.455816. [DOI] [PMC free article] [PubMed] [Google Scholar]
- Ransohoff RM, Perry VH. Microglial physiology: unique stimuli, specialized responses. Annu Rev Immunol. 2009;27:119–145. doi: 10.1146/annurev.immunol.021908.132528. [DOI] [PubMed] [Google Scholar]
- Ray S, Britschgi M, Herbert C, Takeda-Uchimura Y, Boxer A, Blennow K, Friedman LF, Galasko DR, Jutel M, Karydas A, Kaye JA, Leszek J, Miller BL, Minthon L, Quinn JF, Rabinovici GD, Robinson WH, Sabbagh MN, So YT, Sparks DL, et al. Classification and prediction of clinical Alzheimer's diagnosis based on plasma signaling proteins. Nat Med. 2007;13:1359–1362. doi: 10.1038/nm1653. [DOI] [PubMed] [Google Scholar]
- Rosenberger CM, Scott MG, Gold MR, Hancock RE, Finlay BB. Salmonella typhimurium infection and lipopolysaccharide stimulation induce similar changes in macrophage gene expression. J Immunol. 2000;164:5894–5904. doi: 10.4049/jimmunol.164.11.5894. [DOI] [PubMed] [Google Scholar]
- Schafer DP, Lehrman EK, Stevens B. The “quad-partite” synapse: microglia-synapse interactions in the developing and mature CNS. Glia. 2013;61:24–36. doi: 10.1002/glia.22389. [DOI] [PMC free article] [PubMed] [Google Scholar]
- Semmler A, Frisch C, Debeir T, Ramanathan M, Okulla T, Klockgether T, Heneka MT. Long-term cognitive impairment, neuronal loss and reduced cortical cholinergic innervation after recovery from sepsis in a rodent model. Exp Neurol. 2007;204:733–740. doi: 10.1016/j.expneurol.2007.01.003. [DOI] [PubMed] [Google Scholar]
- Shi J, Johansson J, Woodling NS, Wang Q, Montine TJ, Andreasson K. The prostaglandin E2 E-prostanoid 4 receptor exerts anti-inflammatory effects in brain innate immunity. J Immunol. 2010;184:7207–7218. doi: 10.4049/jimmunol.0903487. [DOI] [PMC free article] [PubMed] [Google Scholar]
- Shi J, Wang Q, Johansson JU, Liang X, Woodling NS, Priyam P, Loui TM, Merchant M, Breyer RM, Montine TJ, Andreasson K. Inflammatory prostaglandin E(2) signaling in a mouse model of Alzheimer disease. Ann Neurol. 2012;72:788–798. doi: 10.1002/ana.23677. [DOI] [PMC free article] [PubMed] [Google Scholar]
- Shie FS, Montine KS, Breyer RM, Montine TJ. Microglial EP2 is critical to neurotoxicity from activated cerebral innate immunity. Glia. 2005;52:70–77. doi: 10.1002/glia.20220. [DOI] [PubMed] [Google Scholar]
- Sugimoto Y, Narumiya S. Prostaglandin E receptors. J Biol Chem. 2007;282:11613–11617. doi: 10.1074/jbc.R600038200. [DOI] [PubMed] [Google Scholar]
- Teeling JL, Perry VH. Systemic infection and inflammation in acute CNS injury and chronic neurodegeneration: underlying mechanisms. Neuroscience. 2009;158:1062–1073. doi: 10.1016/j.neuroscience.2008.07.031. [DOI] [PubMed] [Google Scholar]
- Teismann P, Ferger B. Inhibition of the cyclooxygenase isoenzymes COX-1 and COX-2 provide neuroprotection in the MPTP-mouse model of Parkinson's disease. Synapse. 2001;39:167–174. doi: 10.1002/1098-2396(200102)39:2<167::AID-SYN8>3.0.CO%3B2-U. [DOI] [PubMed] [Google Scholar]
- Teismann P, Tieu K, Choi DK, Wu DC, Naini A, Hunot S, Vila M, Jackson-Lewis V, Przedborski S. Cyclooxygenase-2 is instrumental in Parkinson's disease neurodegeneration. Proc Natl Acad Sci U S A. 2003;100:5473–5478. doi: 10.1073/pnas.0837397100. [DOI] [PMC free article] [PubMed] [Google Scholar]
- Vijitruth R, Liu M, Choi DY, Nguyen XV, Hunter RL, Bing G. Cyclooxygenase-2 mediates microglial activation and secondary dopaminergic cell death in the mouse MPTP model of Parkinson's disease. J Neuroinflammation. 2006;3:6. doi: 10.1186/1742-2094-3-6. [DOI] [PMC free article] [PubMed] [Google Scholar]
- Villeda SA, Luo J, Mosher KI, Zou B, Britschgi M, Bieri G, Stan TM, Fainberg N, Ding Z, Eggel A, Lucin KM, Czirr E, Park JS, Couillard-Després S, Aigner L, Li G, Peskind ER, Kaye JA, Quinn JF, Galasko DR, et al. The ageing systemic milieu negatively regulates neurogenesis and cognitive function. Nature. 2011;477:90–94. doi: 10.1038/nature10357. [DOI] [PMC free article] [PubMed] [Google Scholar]
- Wahner AD, Sinsheimer JS, Bronstein JM, Ritz B. Inflammatory cytokine gene polymorphisms and increased risk of Parkinson disease. Arch Neurol. 2007;64:836–840. doi: 10.1001/archneur.64.6.836. [DOI] [PubMed] [Google Scholar]
- Wu DC, Jackson-Lewis V, Vila M, Tieu K, Teismann P, Vadseth C, Choi DK, Ischiropoulos H, Przedborski S. Blockade of microglial activation is neuroprotective in the 1-methyl-4-phenyl-1,2,3,6-tetrahydropyridine mouse model of Parkinson disease. J Neurosci. 2002;22:1763–1771. doi: 10.1523/JNEUROSCI.22-05-01763.2002. [DOI] [PMC free article] [PubMed] [Google Scholar]
- Wu DC, Teismann P, Tieu K, Vila M, Jackson-Lewis V, Ischiropoulos H, Przedborski S. NADPH oxidase mediates oxidative stress in the 1-methyl-4-phenyl-1,2,3,6-tetrahydropyridine model of Parkinson's disease. Proc Natl Acad Sci U S A. 2003;100:6145–6150. doi: 10.1073/pnas.0937239100. [DOI] [PMC free article] [PubMed] [Google Scholar]
- Wu L, Wang Q, Liang X, Andreasson K. Divergent effects of prostaglandin receptor signaling on neuronal survival. Neurosci Lett. 2007;421:253–258. doi: 10.1016/j.neulet.2007.05.055. [DOI] [PMC free article] [PubMed] [Google Scholar]
- Zaslona Z, Serezani CH, Okunishi K, Aronoff DM, Peters-Golden M. Prostaglandin E2 restrains macrophage maturation via E prostanoid receptor 2/protein kinase A signaling. Blood. 2012;119:2358–2367. doi: 10.1182/blood-2011-08-374207. [DOI] [PMC free article] [PubMed] [Google Scholar]
- Zhang J, Rivest S. Distribution, regulation and colocalization of the genes encoding the EP2- and EP4-PGE2 receptors in the rat brain and neuronal responses to systemic inflammation. Eur J Neurosci. 1999;11:2651–2668. doi: 10.1046/j.1460-9568.1999.00682.x. [DOI] [PubMed] [Google Scholar]