Abstract
Purpose.
Optical magnification in optical coherence tomography (OCT) depends on ocular biometric parameters (e.g., axial length). Biometric differences between eyes will influence scan location. A schematic model eye was developed to compensate for lateral magnification in OCT images of the healthy rat.
Methods.
Spectral-domain optical coherence tomography images were acquired in 19 eyes of 19 brown Norway rats. Images were scaled using the OCT instrument's built-in scaling function and by calculating the micron per degree from schematic model eyes developed from in vivo biometry (immersion A-scan and videokeratometry). Mean total retinal thickness was measured 500 μm away from the optic nerve head and optic nerve head diameter was measured. Corneal curvature, lens thickness, and axial length were modified to calculate their effects on OCT scan location and total retinal thickness.
Results.
Mean total retinal thickness increased by 21 μm and the SD doubles when images were scaled with the Built-in scaling (222 ± 13 μm) compared with scaling with individual biometric parameters (201 ± 6 μm). Optic nerve head diameter was three times larger when images were scaled with the Built-in scaling (925 ± 97 μm) than the individual biometric parameters (300 ± 27 μm). Assuming no other change in biometric parameters, total retinal thickness would decrease by 37 μm for every millimeter increase in anterior chamber depth due to changes in ocular lateral magnification and associated change in scan location.
Conclusions.
Scaling SD-OCT images with schematic model eyes derived from individual biometric data is important. This approach produces estimates of retinal thickness and optic nerve head size that are in good agreement with previously reported measurements.
Keywords: biometry, A-scan ultrasonography, corneal topography, optical coherence tomography, rat, retinal thickness, image lateral magnification, age-related biometry changes
A schematic model eye, developed from in vivo biometric measurements in rats, adequately compensated for SD-OCT image lateral magnification. This technique will be useful in longitudinal studies where biometric changes occur due to age or disease.
Introduction
The use of SD-OCT for ocular imaging has increased steadily in the recent years, with over 1500 manuscripts published last year alone. Methods for quantitative analysis of the resulting image data are needed and this is an area of active development that will facilitate further use and correct interpretation of the structural observations available from SD-OCT imaging.
Compensation for lateral magnification is an important consideration with SD-OCT imaging as this influences scan location and in turn, correct interpretation of measurements that depend on precise positioning. Scan position will vary due to natural biologic variations in axial length (AL) and other biometric parameters (e.g., corneal power, anterior chamber depth [ACD], etc.) Changes in these biometric parameters caused by ocular growth or induced by disease also influence scan location and, thereby, interpretation of the size and position of observed structural features. These concerns are relevant to investigators seeking to compare observations between animals, especially when the data are acquired longitudinally or where differences in age, ocular growth, or axial biometric parameters are relevant considerations.
Lateral magnification is especially challenging in the rodent eye due to its small size and corresponding greater optical power. The rat eye is one-third the size of the human eye (6-7–mm AL) and has significantly greater total optical power (+289 diopters [D]).1–3 Optical coherence tomography imaging in the mouse or rat eye is typically performed with the aid of a contact lens or cover slip to reduce the optical power of the eye, which will impact image lateral magnification.4–7 Thus, use of a contact lens or differences in AL between animals will lead to scans acquired from different retinal locations that will limit the comparability of structural measurements between animals and between studies.
The axial (depth) dimension of SD-OCT imaging is independent of the optical power of the eye and does not change after scaling for lateral magnification. However, the position of the axial scan is directly dependent upon lateral magnification (i.e., total optical power of the eye). Eyes with greater AL or higher optical power will produce a minified retinal image that alters scan position relative to eyes with shorter AL. Previous studies of human eyes demonstrated the importance of this effect by showing that OCT thicknesses is comparable between subjects only after correction of image lateral magnification.8–11
Previous measurements of the biometric dimensions of the rat eye were invasive and destructive, involving enucleation and histologic analysis of the tissue. This approach can alter tissue properties and dimensions.1–3,12,13 Recent studies used less invasive techniques (e.g., A-scan ultrasonography, ultrasound biomicroscopy [UBM], and magnetic resonance imaging [MRI]) to measure AL in the rat eye.14–16 However, ultrasonic immersion A-scan measurements were reportedly unreliable beyond postnatal day 17 in the rat because it “proved impossible to identify peaks corresponding to the posterior crystalline lens and the vitreo-retinal interface.”15 The objectives of this study were (1) to develop a schematic model of the rat eye from axial biometric measurements in the adult rat (aged greater than 8 months), (2) to quantify the impact of the use of a contact lens on SD-OCT image magnification, (3) to measure total retinal thickness and optic nerve head size from SD-OCT images after compensation for the effects of lateral magnification, and (4) to assess the impact of varying ocular component dimensions on OCT scan location using a schematic model of the rodent eye.
Methods
All experimental and animal care procedures were approved by the Institutional Animal Care and Use committee of the University of Houston and were in accordance with the ARVO Statement for the Use of Animals in Ophthalmic and Vision Research. Biometric measurements were collected from 33 male brown Norway rats (average ± SD weight: 391 ± 64 g; age: 10–28 months). A subset of these animals (19 of 33 animals; age: 14 months) was imaged with the Spectralis HRA+SD-OCT system (Heidelberg Engineering, Heidelberg, Germany). Rats were anesthetized with an intraperitoneal injection of ketamine (50 mg/kg; Vedco, St. Joseph, MO) and xylazine (5 mg/kg; Vedco). Pupils were dilated using topically applied 1% atropine sulfate (Bausch & Lomb, Inc., Tampa, FL) and eyes were anesthetized with 1% proparacaine hydrochloride (Bausch & Lomb, Inc.).
Derivation of Model Eye Parameters
The schematic model eye was developed from the positions and curvature of the refractive surfaces of the rat eye including the cornea, ACD, lens, and vitreous chamber depth (VCD). Measured biometric parameters were incorporated into the schematic model eye to transform visual angle (in degrees) to retinal size (in microns). Retinal size was determined from the location of the secondary nodal point of the schematic model eye to the retina. The cornea was treated as a single refracting surface while the index of refraction of the crystalline lens was considered to be homogenous. Measured values included in the schematic model included anterior corneal curvature (K), ACD, lens thickness (LT), VCD, and total AL. Anterior and posterior lens radii of curvature were measured from digital photographs of excised lenses from 8 animals (n = 8 eyes). The indices of refraction were not measured, but were assumed using values previously reported by Hughes.3 Individual and mean schematic models were compared to determine if a simplified mean biometric model provided adequate lateral magnification correction for SD-OCT images. For comparison, image lateral magnification was also corrected using the standard scaling factor from the Spectralis SD-OCT system (Built-in Model).
Ultrasonic immersion A-scan measurements (n = 10 scans per eye; resolution = 0.04 mm; frequency = 11 MHz; AXIS II, Quantel Medical, Bozeman, MT) were acquired in 33 rats (n = 66 eyes) to measure ACD, LT, VCD, and AL. The ACD and VCD ultrasound velocities used were 1532 m/s, while the ultrasound velocity of the lens was 1641 m/s. A customized immersion cup was constructed for the rat eye (Fig. 1A). The A-scan probe attaches to one end of the cylindrical shell and the opposite end is placed in contact with the bulbar conjunctiva and orbital rim of the rat eye. A sample A-scan measurement is shown in Figure 1B, where peaks correspond to the anterior cornea, anterior and posterior crystalline lens, and retina. Anterior chamber depth was measured as the peak-to-peak distance between the anterior cornea and anterior crystalline lens; LT was the distance between the positions of the anterior and posterior crystalline lens peaks; VCD was the distance between posterior crystalline lens and retinal peaks; and AL was the distance between the anterior corneal and retinal peaks. The mean difference and 95% limits of agreement were calculated between left and right eye biometric measurements. After confirming that the two eyes of each animal were comparable, one eye per animal was randomly selected for study and this sample was used to calculate the average (±SD) of ACD, LT, VCD, and AL measurements. Corneal curvature was measured in eight animals (n = 8 eyes) using videokeratography (Keratron Scout; Optikon 2000, Rome, Italy; Fig. 1C).
Figure 1.
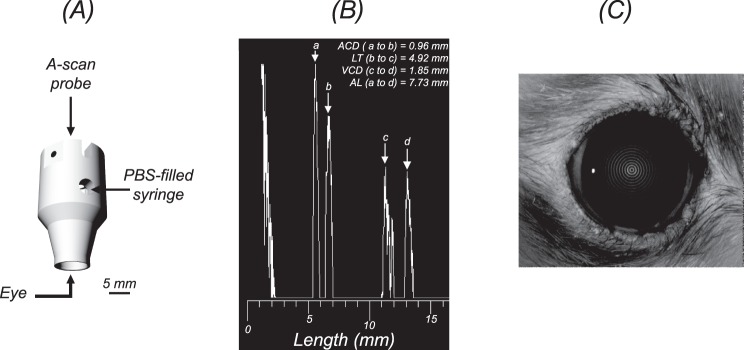
Measuring the ocular dimensions in the healthy brown Norway rat. (A) A custom-built immersion cup, scaled for the rat eye, was used to acquire ultrasonic immersion A-scans. (B) A sample immersion A-scan showing the anterior corneal peak (a), anterior (b), and posterior (c) crystalline lens peaks, and retinal peak (d). Anterior chamber depth was measured as the distance between a and b; LT was measured between b and c; VCD is the distance between c and d; and AL is the distance between a and d. (C) Anterior corneal curvature was measured using Placido videokeratography.
Model Eye Correction of SD-OCT Lateral Magnification
Each schematic model eye (Fig. 2) was used to correct image lateral magnification in scanning laser ophthalmoscopy (SLO) and SD-OCT images of the rat eye. Animals were imaged with and without a plano powered PMMA contact lens and the potential magnification effects of this lens were also evaluated. This lens was verified as having a 3.35-mm radius of curvature, 6-mm overall diameter, and 270-μm thickness. Three schematic model eyes were used to compensate for image lateral magnification. These models were based upon individual biometry with and without the PMMA contact lens (Individual ± CL Model), and mean biometric parameters with the contact lens (Mean + CL Model).
Figure 2.
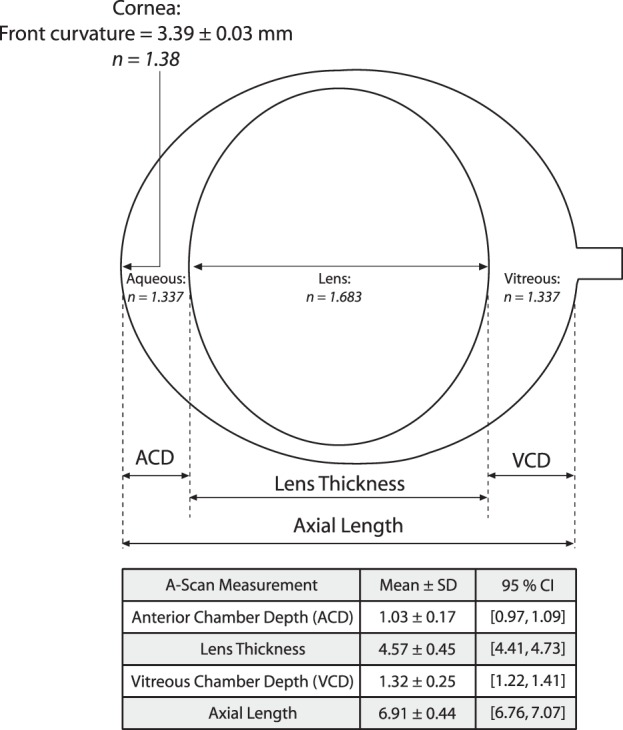
The schematic model eye was developed from the position and curvature of the refractive surfaces of the rat eye. The cornea was treated as a single refracting surface, while the index of refraction of the crystalline lens was considered to be homogenous. Measured values included in the schematic model and table: ACD, LT, VCD, AL, and K. Indices of refraction (italicized numbers) were based on previous studies by Hughes.3
First, the Individual–CL Model was used to correct image lateral magnification of images acquired without the contact lens and the Individual + CL Model results were used to correct lateral magnification of images acquired with the contact lens. Then, total retinal thickness and optic nerve head diameter was measured from SD-OCT images after compensation of image lateral magnification with the Built-in Model, Individual + CL Model, or the Mean + CL Model. We hypothesized that structural features (e.g., total retinal thickness and optic nerve head diameter) from images acquired with and without the contact lens would be of equal size and that their dimensions would be uncorrelated with AL after compensation for image lateral magnification.
Retinal images were acquired at a scan speed of approximately 40,000 A-scans per second using a super luminescent diode light source with a central wavelength of 870 ± 55 nm and nominal axial resolution of 4 μm. Eyes were aligned normal to the OCT scan path with a previously established imaging protocol.17 Briefly, animals were placed in a positioning stage and were rotated and translated such that the optic nerve was aligned to the imaging axis and there was minimal vignetting of the SLO image. The camera location and focus settings were adjusted to maximize the contrast at the depth of the nerve fiber layer. Then the position of the OCT reference arm was adjusted to bring the SD-OCT B-scan image into view. A 25° × 30° horizontal volumetric image dataset was collected from 19 animals (n = 19 eyes), which was comprised of 31 B-scans, 1536 A-scans per B-scan, and 51 averaged frames per B-scan. Two volumetric image datasets were collected per animal, one with the plano powered contact lens and one without a contact lens (11 of the 19 animals were included).
Two approaches were used to quantify the effects of the contact lens on lateral magnification correction. The first was a computational approach based on determination of the relative magnification required to register SLO images with and without contact lens use. The second method was based upon the direct measurement and comparison of distances between blood vessels observed in the volumetric SD-OCT images obtained with and without the contact lens. In the computational approach, the mean registration magnification was calculated and a one sample t-test was conducted to evaluate if this value was significantly different from one (e.g., no magnification). The magnification parameter was derived from image registration using an affine transformation (e.g., the amount of translation, rotation, shearing, or magnification needed to align two images) of the two SLO images captured with and without the contact lens. The image magnification parameter was calculated using i2K Align Retinal Software (version 1.3.8; DualAlign LLC, Clifton Park, NY). In the second method, image magnification with and without the contact lens was assessed by comparing the mean center-to-center distance between two adjacent blood vessels in two different SD-OCT image volumes. The difference in these distances between blood vessels in each imaging condition was compared using a paired t-test.
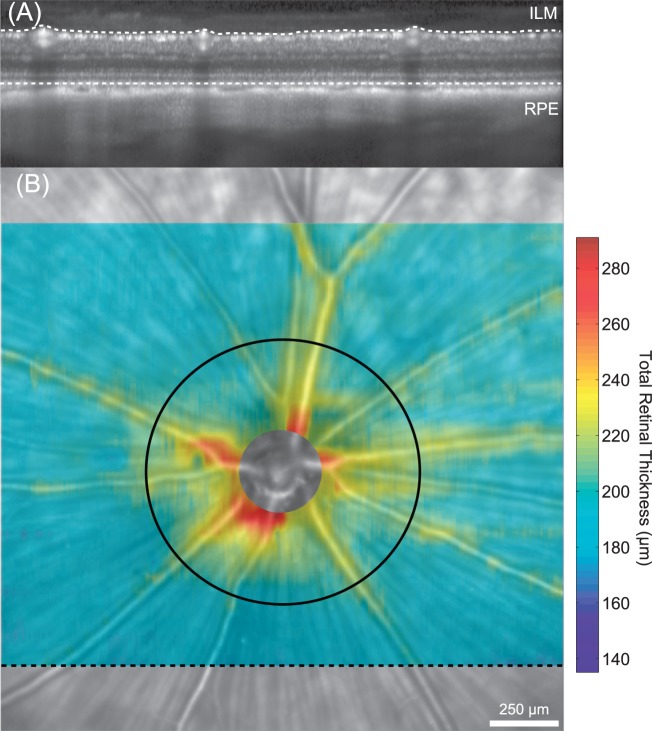
Total retinal thickness was then measured from each of the volumetric image datasets collected from 19 animals (n = 19 eyes). A customized segmentation protocol using a Canny edge detection algorithm (Gaussian filter size of  ) was developed (Matlab, Natick, MA) to automatically delineate the inner limiting membrane (ILM) and RPE from the SD-OCT image data. Intensity peaks of the filtered image correspond to the layers of interest. Total retinal thickness was measured as the distance between the ILM and RPE. Thickness measurements were taken at each individual A-scan (1536 point-wise measurements) and for all 31 B-scans. Images were corrected for lateral magnification using the three different scaling factors (Built-In Model, Individual + CL Model, and Mean + CL Model). Three-dimensional (3D) spatial thickness maps were generated using bilinear interpolation of thicknesses across individual B-scans (Fig. 3). Mean total retinal thickness was then taken from a circular scan pattern (diameter = 1 mm) centered on the optic nerve head. Mean total retinal thickness was compared between the three scaling models using repeated measures ANOVA. Linear regression analysis was performed to determine whether total retinal thickness measurements were dependent upon AL after lateral magnification correction of the image.
Figure 3.
Total retinal thickness measurements in the healthy brown Norway rat. (A) Total retinal thickness was measured from volumetric SD-OCT scans (25°h × 30°w) comprised of 31 horizontally oriented b-scans. The black dashed line in (B) shows the location where the OCT image (A) was acquired. Total retinal thickness was calculated as the distance from the ILM to the RPE. (B) Spatial thickness maps were generated from bilinear interpolation of thickness measurements between successive B-scans. The retinal thickness map is superimposed on top of the scanning laser ophthalmoscope image and shows that thicker measurements are consistently located around blood vessels and near the optic nerve head. The black circle (diameter = 1 mm) was placed on the optic nerve head center and shows the location where mean thickness measurements were calculated and compared between animals.
After correction for lateral magnification, the diameter of the optic nerve head was determined as the best-fitting circle to a series of circumferential points manually selected at the RPE end near the optic nerve head margin (Bruch's membrane opening). These points were selected from 24 radial B-scan images (15° scan length; 7.5° angular separation) that were centered on the optic nerve head (Fig. 4). Univariate linear regression analysis was performed to analyze the relationship between optic nerve head diameter and AL.
Figure 4.
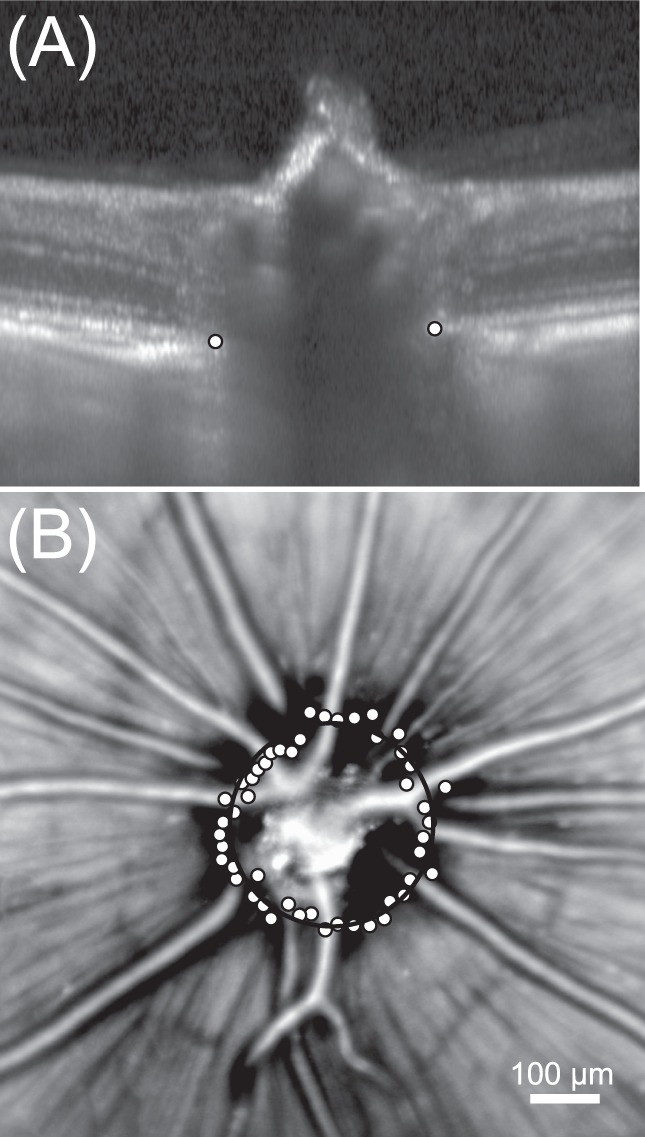
Measuring the diameter of the optic nerve head in the healthy brown Norway rat. (A) Radial scans were acquired around the optic nerve and BMO was manually annotated (white points) for each B-scan (n = 24 radial scans). (B) Bruch's membrane opening annotations are plotted (white points) on top of the scanning laser ophthalmoscopy image. The optic nerve head diameter was measured from a circle fit (black circle) through BMO annotations.
Impact of Individual Biometric Parameters on Observed Retinal Thickness
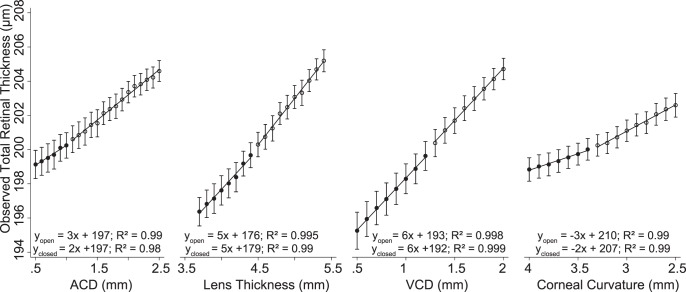
Four simulations were developed to assess the impact of varying individual biometric parameters on ocular lateral magnification, SD-OCT scan position and the corresponding retinal thickness measurements. In these simulations, one parameter (ACD, LT, VCD, or K) was modified while setting all others to their mean value. Axial length was considered to be the summation of ACD, LT, and VCD. Anterior chamber depth ranged between 0.5 and 2.5 mm in the ACD Simulation; lens thickness ranged between 3.7 and 5.4 mm in the LT Simulation. In the VCD Simulation, the VCD was varied from 0.5 to 2 mm. Lastly, in K Simulation, K was varied from 2.5 to 3.5 mm while keeping ACD, LT, VCD, and AL constant. Schematic model eyes were generated for each simulation case described above and the corresponding lateral magnification produced by that model was calculated.
A 3D composite map of rat retinal thickness was constructed by averaging scaled volumetric data from all animals (n = 19) and mean retinal thickness was determined from a circular OCT scan pattern (1-mm diameter) centered at the optic nerve. The observed change in mean total retinal thickness produced by altering each biometric parameter was calculated using univariate linear regression analysis. The interaction between changes in all parameters on magnification was also evaluated using multiple linear regression analysis. Five explanatory variables (ACD, VCD, LT, AL, and K) were included in the multiple linear regression analysis and are shown in Equation 1. The coefficients (β) for each variable indicate the amount of total retinal thickness difference per millimeter change for a specific biometric parameter while holding all other parameters constant.
 |
Lastly, variations in ocular biometry between animals will alter scan location, and the impact of this was quantified using a two-dimensional (2D) map composite generated from a compilation of scaled volumetric line scans (n = 19 eyes). Retinal thickness was averaged along the horizontal meridian to determine the horizontal thickness profile (mean ± 95% confidence interval [CI]) of the retina. The Individual + CL Model was then used to calculate the scan location that would have been observed for each individual animal.
Results
Derivation of Model Eye Parameters
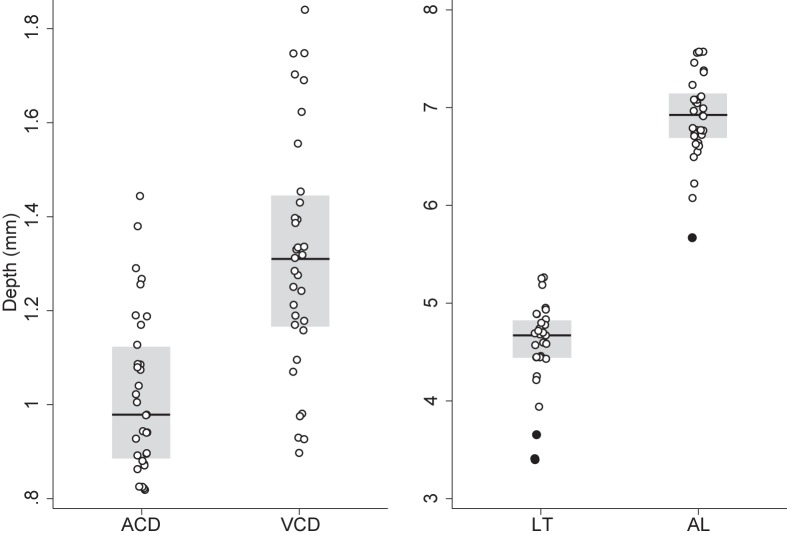
There was no difference between left and right eye with respect to ACD (Mean difference: 0.02 mm; P = 0.1), LT (Mean difference: 0.03; P = 0.73), VCD (Mean difference: 0.08 mm; P = 0.11), and AL (Mean difference: 0.13 mm; P = 0.17). One eye per animal was then randomly selected and included to calculate the mean (±SD) ACD (1.03 ± 0.17 mm), LT (4.57 ± 0.45 mm), VCD (1.32 ± 0.25), and AL (6.91 ± 0.44 mm). Measured anterior lens radius of curvature was 2.42 ± 0.22 mm and posterior lens radius of curvature was 2.62 ± 0.15 mm. Corneal curvature was 3.39 ± 0.03 mm (95% CI: 3.37–3.41 mm). Figure 5 shows the distribution of mean ACD, VCD, LT, and AL measurements included in the model.
Figure 5.
Distribution of ultrasonic immersion A-scan biometric measurements in the healthy brown Norway rat. The points are the ACD, VCD, LT, and AL measurements included in the schematic model eye, the solid black line is the median, the gray box is the interquartile range (IQR), and filled in points are points that fall outside ±1.5×IQR.
Model Eye Correction of SD-OCT Lateral Magnification
The mean lateral magnification factor (microns per degree of visual angle) for the rat retina calculated from the Individual + CL Model was 65.3 ± 6.7 μm/deg (95% CI: 62.9–67.6 μm/deg) and for the Individual–CL Model it was 62.3 ± 6.6 μm/deg (95% CI: 59.9–62.9 μm/deg).
The registration magnification parameter computed from the affine image registration of SLO images captured with and without the contact lens was 1.00 ± 0.03 (95% CI: 0.98–1.02 μm) and this value was not significantly different from 1 (P = 0.94). The distance between selected blood vessels calculated from images acquired without the contact lens (95% CI: 213–389 μm) were not significantly different (P = 0.49) to the distance measured from images with the contact lens (95% CI: 207–380 μm).
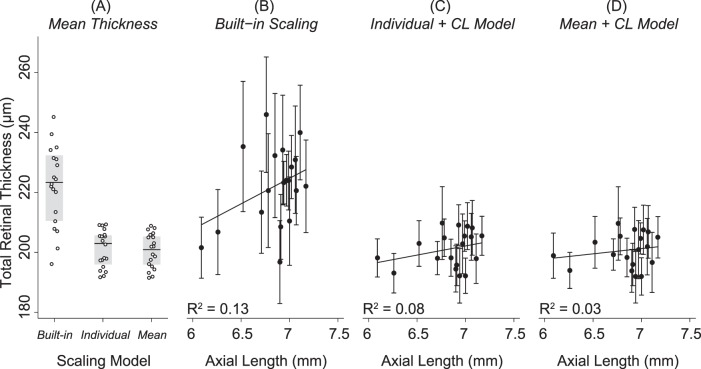
Figure 6 shows that significantly greater total retinal thickness measurements were acquired when images were scaled using the Built-in Model (222 ± 13 μm; 95% CI: 216–228 μm) versus the Individual + CL Model (201 ± 6 μm; 95% CI: 198–204 μm; P < 0.001) or the Mean + CL Model (201 ± 6 μm; 95% CI: 198–203 μm; P < 0.001). There was no significant difference (P = 0.74) between mean total retinal thickness when images were scaled with the Individual + CL Model versus Mean + CL Model. There was a weak and nonsignificant relationship between mean total retinal thickness and AL after images were scaled using the Built-in Model (R2 = 0.13; P = 0.12), Individual + CL Model (R2 = 0.08, P = 0.24), or the Mean + CL Model (R2 = 0.03, P = 0.47).
Figure 6.
Mean total retinal thickness measured 500 μm away from the optic nerve head center in healthy brown Norway rats. (A) Mean total retinal thickness for each animal (white points) after images were scaled using the Built-in scaling, Individual + CL Model, or Mean + CL Model. The gray box shows the IQR of the data and the black line is the median. Significantly greater total retinal thickness measurements were acquired after images were scaled using the built-in factor (222 ± 13 μm) than either the Individual + CL Model (201 ± 6 μm; P < 0.001) or the Mean + CL Model (201 ± 6 μm; P < 0.001). Total retinal thickness was not significantly (P = 0.74) different when images were scaled with the Individual + CL or the Mean + CL Model. (B) The goodness of fit (R2) between total retinal thickness and AL was weak and not significantly different from zero after images were scaled with the Built-in Model (R2 = 0.13; P = 0.12) or the (C) Individual + CL Model (R2 = 0.08; P = 0.24) or (D) the Mean + CL Model (R2 = 0.03; P = 0.47).
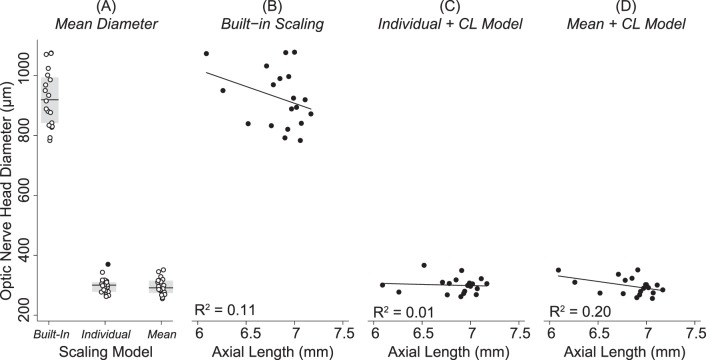
Figure 7 shows that the optic nerve head diameter was significantly larger when images were scaled with the Built-In Model (925 ± 97 μm; 95% CI: 878–972 μm) than when images were scaled with the Individual + CL Model (300 ± 27 μm; 95% CI: 28–313 μm; P < 0.001) or the Mean + CL Model (297 ± 29 μm; 95% CI: 283–311 μm; P < 0.001). There was a weak and nonsignificant relationship between optic nerve head diameter and AL after images were scaled using the Built-in model (R2 = 0.11, P = 0.17), the Individual + CL Model (R2 = 0.007; P = 0.74), or the Mean + CL Model (R2 = 0.195; P = 0.06).
Figure 7.
Optic nerve head size in the healthy brown Norway rat. (A) Points show the distribution in optic nerve head sizes between animals included in the study, the gray box shows the IQR of the data, the black line is the median, and the filled in points are points that fall outside ±1.5×IQR. Optic nerve head diameter was significantly larger when images were scaled with the Built-In scaling (925 ± 97 μm) than when images were scaled with the Individual + CL Model (300 ± 27 μm, P < 0.001) or the Mean + CL Model (297 ± 29 μm, P < 0.001). There was a weak and nonsignificant relationship between optic nerve head diameter and AL after images were scaled using the (B) Built-in model (R2 = 0.11, P = 0.17), (C) the Individual + CL Model (R2 = 0.01; P = 0.74), or the (D) Mean + CL Model (R2 = 0.20; P = 0.06).
Impact of Individual Biometric Parameters on Observed Retinal Thickness
In each case the reference scan location was set to 500 μm away from the optic nerve head center for comparison purposes. Over the range of ACD values tested, the observed scan location in the ACD Simulation was 477 ± 30 μm away from the optic nerve head center (95% CI: 463–491 μm), in LT Simulation it was 508 ± 64 μm (95% CI: 476–540 μm), in VCD Simulation it was 517 ± 68 μm (95% CI: 481–554 μm), and K Simulation it was 501 ± 37 μm (95% CI: 484–518 μm). Figure 8 shows the effect that each of these biometric parameters had on the observed total retinal thickness as a consequence of varying scan position due to differences in ocular lateral magnification. These results show that retinal thickness increased or decreased between 2- and 6-μm/mm change for each biometric parameter. For example, total retinal thickness measurements increased by 3-μm/mm deepening of the ACD (ACD Modifications). The multiple linear regression results are shown in Equation 2. The goodness of fit (adjusted R2) for this equation was 0.995 and indicates that 99.5% of the variability observed in retinal thickness is accounted for by the model, even after taking into account the number of predictor variables (e.g., ACD, VCD, LT, etc.) in the model. For example, this equation shows that if the angular position of scan location is not changed, total retinal thickness would decrease by 37 μm for every millimeter increase in ACD due to changes in ocular lateral magnification, assuming that all other parameters are constant.
 |
Figure 8.
Four simulations were developed to quantify the impact of changing the model eye parameters on scan location and measured total retinal thickness at the new scan location. In these simulations, one parameter (ACD, LT, VCD, or K) was modified at a time while setting all others to their mean value. Axial length was considered to be the summation of ACD, LT, and VCD. Each parameter (ACD, LT, VCD, or K) was modified to be either smaller (closed circles) or larger (opened circles) than the mean value for that particular parameter. The linear regression equations show that total retinal thickness changed between 2 and 6 μm per millimeter change in the parameters.
Figure 9 illustrates the influence that differences in ocular biometry between animals can have on SD-OCT scan diameter. The actual 500-μm scan radius was magnified to 506 μm (95% CI: 490–522 μm). This variation in the scanned position results in observed total retinal thickness that was between 195 and 201 μm (95% CI).
Figure 9.
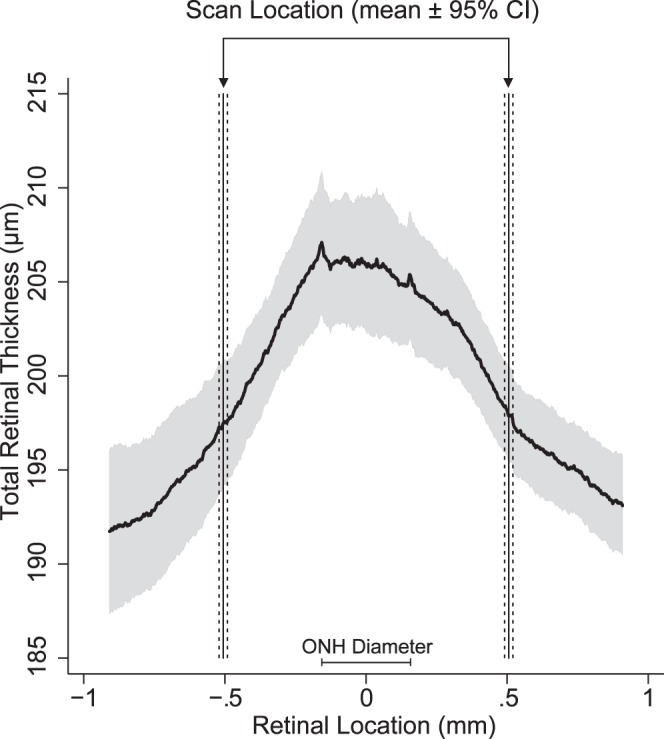
Distribution in total retinal thickness within the central 2-mm retinal area in healthy brown Norway rats. Total retinal thickness maps were scaled using the Mean + CL Model and cropped to cover a similar retinal area between animals. The mean (solid curved line) and 95% CIs (gray area) was calculated along the horizontal dimension from these maps. The Individual + CL Model was used to determine the expected scan location. The vertical solid lines represent the mean scan location and the dashed lines are the associated 95% CI. This figure illustrates the variability in OCT scan location due to differences in biometry between animals as well as the possible range of observed total retinal thickness due to scan position.
Discussion
The purpose of this study was to develop a schematic model eye of the rat to properly account for image lateral magnification. These results will facilitate the correct measurement and interpretation of structural observations from SD-OCT imaging between animals, within animals imaged longitudinally, or when comparing observations between studies. The proposed schematic model eye was developed from in vivo measurements of the ocular dimensions in the rat. Using an immersion cup developed for the rat eye improved the visibility of A-scan peaks, enabling us to measure the axial dimension of the adult rat eye by immersion A-scan ultrasonography with good repeatability.
The resulting schematic model eyes were used to scale SLO and SD-OCT images captured with and without a contact lens and found that the plano powered contact lens used did not impact image lateral magnification. These results suggest that structures measured from images captured with this contact lens are not magnified. The advantage of using the contact lens is that it improves image quality, maintains normal corneal hydration, and prevents loss of lens clarity.18,19 Next, total retinal thickness was measured and compared after correcting for image lateral magnification using the Built-in Model, an individual (Individual + CL Model), and mean (Mean + CL Model) schematic models. Higher thickness values and larger optic nerve heads were measured after scaling images with the Built-in Model relative to the schematic model eyes evaluated. The Mean + CL Model did not yield significantly thicker/thinner total retinal thickness measurements or bigger/smaller optic nerve head diameters than images that were scaled using the Individual + CL Model. These results suggest that the mean biometry data for healthy animals provided adequate lateral magnification correction for SD-OCT images in the healthy adult rat eye.
Nissirios et al.,16 reported an approximate 71% increase in ACD in rats with experimental glaucoma. The amount of change in the axial dimension may vary between animals and an individualized schematic model eye is likely needed to correct image lateral magnification for animals whose biometry is changed by disease induction. Ocular biometry can vary for a number of other reasons, including strain, age, sex, and so on, and this variability can impact the scaling required to compensate for image lateral magnification. For example, the anterior corneal curvature measurements reported in this study were flatter than previously reported by others (3.39 mm vs. 3.13 mm), and differences in rat strain (brown Norway versus albino Sprague-Dawley) can account for some of the variability between the reported values.20 We have also observed corneal curvature differences (∼0.5-mm steeper, data not shown) in another cohort of brown Norway rats of similar age, but obtained from a different colony.
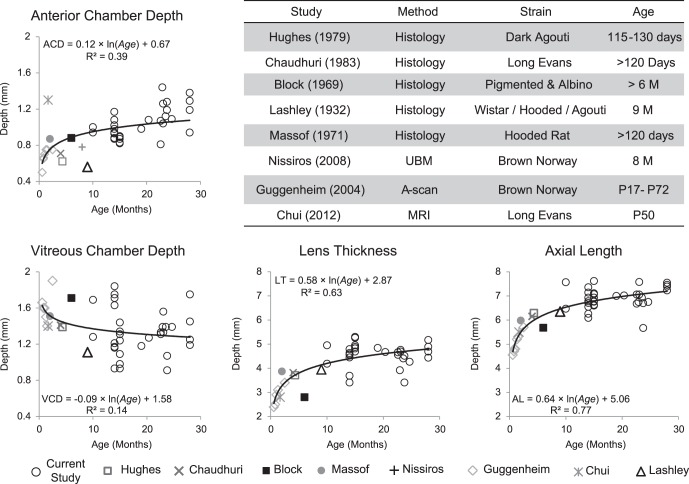
Ocular biometry (e.g., AL, ACD, etc.) also changes with age and the rate of change in these parameters was calculated by combining the results from previous studies reporting the axial dimensions in rats that ranged in age from postnatal day 17 to 28 months. Figure 10 shows the results from nine studies (including this study) that measured the axial dimension of the rat eye either from histologic processing or from in vivo measurements (by A-scan, UBM, or MRI).1–3,12–16 Age-related changes in ocular biometry were analyzed with log-regression analysis through the results from these nine studies. While differences in biometric parameters are reported (corneal thickness, lens curvature and thickness, AL, etc.), they are relatively small in comparison to differences due to age (Fig. 10). For example, a comparison of results from studies with two different strains of comparable ages (Hughes3: 115–130 days old; Chaudhuri et al.2: >120 days old) shows that AL differed between these two cohorts by 0.152 mm. Using the model eye parameters from this study, this difference would change the length of a 30° OCT line-scan by 4% (60 μm/1593 μm). However, AL can change by almost 2 mm, from 5 mm at 1 month of age to 6.8 mm at 15 months of age. This will effectively change the length of a 30° OCT line scan by 46% (600 μm/1900 μm). This underscores the impact that ocular biometry changes due to age may have on image lateral magnification and subsequent structural measurements.
Figure 10.
Age-related changes in ACD, VCD, LT, and AL in healthy rats. The table shows the method used to measure these ocular dimensions, the strain, and age of the animals. These graphs show that there is an early fast growth in the ocular dimension in the rat eye and the growth progressively slows as the animal ages.
Total retinal thickness observed in this study was different from previous histologic or in vivo measurements and this appears to be due in part to age differences, interanimal differences, or the underlying assumptions used to compensate for image lateral magnification in other studies. In the current study, mean total retinal thickness 500 μm away from the optic nerve head center was 201 ± 6 μm and this was thinner than histologic measurements of total retinal thickness acquired from similar retinal locations (∼210 μm) in other studies.21 Differences in weight/age of the animals (391 g vs. 270 g) can account for some of the disparity in thickness measurements between these studies. For example, there are age-related changes in thickness where total retinal thickness decreases by approximately 60 μm between adult (12-month old, 210 ± 31.6 μm) and old (24-month old, 150 ± 18.3 μm) rats.22 Guo et al.23 imaged Dark-Agouti rats with a commercial SD-OCT system (Spectralis) and reported that total retinal thickness was 172.19 ± 5.17 μm approximately 350 μm away from the optic nerve head center. Interanimal differences in total retinal thickness can account for some of the variability in the reported measurements between these studies. For example, Figure 9 shows that total retinal thickness can vary by 6 μm between animals of different strains. Another component of the variability in reported thickness measurements can be attributed to the underlying assumptions used to compensate for image lateral magnification. For example, Guo and colleagues23 assumed that the posterior focal length of the rat eye was 4.5 mm, as previously reported by Campbell and Hughes.24 Campbell and Hughes24 considered a nonhomogenous index of refraction for the lens. The scaling factor for a 4.5-mm posterior focal length is 78.5 μm/deg, as opposed to the 65.3 ± 6.7 μm/deg calculated in the current study. The difference in scaling factors between these two studies underscores the importance of stating the assumptions made when compensating for image lateral magnification, as this will impact the reported scanned position and subsequent reported thickness measurements.
The optic nerve head diameter was three times larger when images were scaled with the Built-in scaling model (925 ± 97 μm) than when lateral magnification was compensated with the Individual + CL Model (300 ± 27 μm) or the Mean + CL Model (297 ± 29 μm). A previous study showed that the rat optic nerve diameter was 300 μm, well within the measured optic nerve head diameter reported here, after images were scaled with the schematic model eye.25 The Built-in model is meant to compensate for image lateral magnification in the human eye (∼3 times larger than the rat eye) and the large difference observed in the scaled optic nerve head diameter is proportional to the difference in optical power between the rat and human eye. This highlights the importance of compensating for image lateral magnification with an appropriate model. There was also a weak correlation between optic nerve head diameter and AL irrespective of the method used to compensate for image lateral magnification. We conclude that the schematic model eye built from in vivo ocular biometric measurements provides a good approximation to compensate for image lateral magnification and that structural measurements made after compensating for image lateral magnification with the schematic model eye are in good agreement with previous measurements of the healthy rat.
A limitation of the current study is the difficulty of aligning the A-scan probe along the same optical axis between animals. This misalignment may yield smaller measurements or greater variability in the measurements as evident from the higher coefficient of variation for VCD measurements (18.2 ± 7.3%) than AL (4.6 ± 2.1%). Advances in ocular imaging (e.g., long range OCT scanning) will help address this limitation and has already been demonstrated that the entire dimension of the mouse eye can be imaged with custom built SD-OCT systems.26–28
The schematic model eye results reported here may improve further if a core lens model and lens curvature measurements from the specific animals included in the study are used. Chaudhuri et al.2 reports that the position of the posterior nodal point would move backwards by approximately 0.05 mm if the core lens model is used instead of the homogenous model. This change in the position of the posterior nodal point would lead to an increase in total retinal thickness of approximately 1 μm and the optic nerve head diameter would increase by approximately 6 μm.
The schematic model eyes described in this study provides an appropriate way to compensate for image lateral magnification in the healthy rat eye future studies should quantify these changes for other strains. While this model is based upon biometric measurements from male rats, it could easily be adapted to female rats that have a different growth rate than male rats.29 This image scaling approach has been used for scaling OCT images in nonhuman primates, and may be used for other species as well.30
Acknowledgments
Supported by a National Institutes of Health Grant P30 EY07551.
Disclosure: D.C. Lozano, None; M.D. Twa, None
References
- 1. Block MT. A note on the refraction and image formation of the rat's eye. Vision Res. 1969; 9: 705–711 [DOI] [PubMed] [Google Scholar]
- 2. Chaudhuri A, Hallett PE, Parker JA. Aspheric curvatures, refractive indices and chromatic aberration for the rat eye. Vision Res. 1983; 23: 1351–1363 [DOI] [PubMed] [Google Scholar]
- 3. Hughes A. A schematic eye for the rat. Vision Res. 1979; 19: 569–588 [DOI] [PubMed] [Google Scholar]
- 4. Geng Y, Greenberg KP, Wolfe R, et al. In vivo imaging of microscopic structures in the rat retina. Invest Ophthalmol Vis Sci. 2009; 50: 5872–5879 [DOI] [PMC free article] [PubMed] [Google Scholar]
- 5. Higashide T, Kawaguchi I, Ohkubo S, Takeda H, Sugiyama K. In vivo imaging and counting of rat retinal ganglion cells using a scanning laser ophthalmoscope. Invest Ophthalmol Vis Sci. 2006; 47: 2943–2950 [DOI] [PubMed] [Google Scholar]
- 6. Seeliger MW, Beck SC, Pereyra-Munoz N, et al. In vivo confocal imaging of the retina in animal models using scanning laser ophthalmoscopy. Vision Res. 2005; 45: 3512–3519 [DOI] [PubMed] [Google Scholar]
- 7. Walsh MK, Quigley HA. In vivo time-lapse fluorescence imaging of individual retinal ganglion cells in mice. J Neurosci Methods. 2008; 169: 214–221 [DOI] [PMC free article] [PubMed] [Google Scholar]
- 8. Hwang YH, Kim YY. Correlation between optic nerve head parameters and retinal nerve fibre layer thickness measured by spectral-domain optical coherence tomography in myopic eyes. Clin Experiment Ophthalmol. 2012; 40: 713–720 [DOI] [PubMed] [Google Scholar]
- 9. Patel NB, Garcia B, Harwerth RS. Influence of anterior segment power on the scan path and RNFL thickness using SD-OCT. Invest Ophthalmol Vis Sci. 2012; 53: 5788–5798 [DOI] [PMC free article] [PubMed] [Google Scholar]
- 10. Sanchez-Cano A, Baraibar B, Pablo LE, Honrubia FM. Magnification characteristics of the Optical Coherence Tomograph STRATUS OCT 3000. Ophthalmic Physiol Opt. 2008; 28: 21–28 [DOI] [PubMed] [Google Scholar]
- 11. Savini G, Barboni P, Parisi V, Carbonelli M. The influence of axial length on retinal nerve fibre layer thickness and optic-disc size measurements by spectral-domain OCT. Br J Ophthalmol. 2012; 96: 57–61 [DOI] [PubMed] [Google Scholar]
- 12. Lashley KS. The mechanism of vision. V. The structure and image-forming power of the rat's eye. J Comp Psychol. 1932; 13: 173–200 [Google Scholar]
- 13. Massof RW, Chang FW. A revision of the rat schematic eye. Vision Res. 1972; 12: 793–796 [DOI] [PubMed] [Google Scholar]
- 14. Chui TY, Bissig D, Berkowitz BA, Akula JD. Refractive development in the “ROP rat.” J Ophthalmol. 2012; 2012: 956705 [DOI] [PMC free article] [PubMed] [Google Scholar]
- 15. Guggenheim JA, Creer RC, Qin XJ. Postnatal refractive development in the brown Norway rat: limitations of standard refractive and ocular component dimension measurement techniques. Curr Eye Res. 2004; 29: 369–376 [DOI] [PubMed] [Google Scholar]
- 16. Nissirios N, Chanis R, Johnson E, et al. Comparison of anterior segment structures in two rat glaucoma models: an ultrasound biomicroscopic study. Invest Ophthalmol Vis Sci. 2008; 49: 2478–2482 [DOI] [PMC free article] [PubMed] [Google Scholar]
- 17. Lozano DC, Twa MD. Quantitative evaluation of factors influencing the repeatability of SD-OCT thickness measurements in the rat. Invest Ophthalmol Vis Sci. 2012; 53: 8378–8385 [DOI] [PMC free article] [PubMed] [Google Scholar]
- 18. Lozano DC, Twa MD. The effects of RGP contact lens use on SD-OCT retinal image quality in the brown Norway rat. Am Acad Optom: Meeting Abstracts. 2010; 87: 105359 [Google Scholar]
- 19. van Oterendorp C, Diaz-Santana L, Bull N, et al. Light scattering and wavefront aberrations in in vivo imaging of the rat eye: a comparison study. Invest Ophthalmol Vis Sci. 2011; 52: 4551–4559 [DOI] [PubMed] [Google Scholar]
- 20. Mutti DO, Zadnik K, Murphy CJ. The effect of continuous light on refractive error and the ocular components of the rat. Exp Eye Res. 1998; 67: 631–636 [DOI] [PubMed] [Google Scholar]
- 21. Buttery RG, Hinrichsen CF, Weller WL, Haight JR. How thick should a retina be? A comparative study of mammalian species with and without intraretinal vasculature. Vision Res. 1991; 31: 169–187 [DOI] [PubMed] [Google Scholar]
- 22. Cavallotti C, Artico M, Pescosolido N, Feher J. Age-related changes in rat retina. Jpn J Ophthalmol. 2001; 45: 68–75 [DOI] [PubMed] [Google Scholar]
- 23. Guo L, Normando EM, Nizari S, Lara D, Cordeiro MF. Tracking longitudinal retinal changes in experimental ocular hypertension using the cSLO and spectral domain-OCT. Invest Ophthalmol Vis Sci. 2010; 51: 6504–6513 [DOI] [PMC free article] [PubMed] [Google Scholar]
- 24. Campbell MC, Hughes A. An analytic, gradient index schematic lens and eye for the rat which predicts aberrations for finite pupils. Vision Res. 1981; 21: 1129–1148 [DOI] [PubMed] [Google Scholar]
- 25. Cohan BE, Pearch AC, Jokelainen PT, Bohr DF. Optic disc imaging in conscious rats and mice. Invest Ophthalmol Vis Sci. 2003; 44: 160–163 [DOI] [PubMed] [Google Scholar]
- 26. Chou TH, Kocaoglu OP, Borja D, et al. Postnatal elongation of eye size in DBA/2J mice compared with C57BL/6J mice: in vivo analysis with whole-eye OCT. Invest Ophthalmol Vis Sci. 2011; 52: 3604–3612 [DOI] [PMC free article] [PubMed] [Google Scholar]
- 27. Jiang M, Wu PC, Fini ME, et al. Single-shot dimension measurements of the mouse eye using SD-OCT. Ophthalmic Surg Lasers Imaging. 2012; 43: 252–256 [DOI] [PMC free article] [PubMed] [Google Scholar]
- 28. Zhou X, Xie J, Shen M, et al. Biometric measurement of the mouse eye using optical coherence tomography with focal plane advancement. Vision Res. 2008; 48: 1137–1143 [DOI] [PubMed] [Google Scholar]
- 29. Segupta P. A scientific review of age determination for a laboratory rat: how old is it in comparison with human age? Biomed Int. 2011; 2: 81–89 [Google Scholar]
- 30. Ivers KM, Li C, Patel N, et al. Reproducibility of measuring lamina cribrosa pore geometry in human and nonhuman primates with in vivo adaptive optics imaging. Invest Ophthalmol Vis Sci. 2011; 52: 5473–5480 [DOI] [PMC free article] [PubMed] [Google Scholar]


