

Abstract
The predicted effect of effective population size on the distribution of fitness effects and substitution rate is critically dependent on the relationship between sequence and fitness. This highlights the importance of using models that are informed by the molecular biology, biochemistry, and biophysics of the evolving systems. We describe a computational model based on fundamental aspects of biophysics, the requirement for (most) proteins to be thermodynamically stable. Using this model, we find that differences in population size have minimal impact on the distribution of population-scaled fitness effects, as well as on the rate of molecular evolution. This is because larger populations result in selection for more stable proteins that are less affected by mutations. This reduction in the magnitude of the fitness effects almost exactly cancels the greater selective pressure resulting from the larger population size. Conversely, changes in the population size in either direction cause transient increases in the substitution rate. As differences in population size often correspond to changes in population size, this makes comparisons of substitution rates in different lineages difficult to interpret.
Keywords: nearly neutral theory, effective population size, substitution rate, protein stability, epistasis, population bottleneck
Introduction
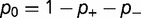
Novel mutations that appear in a genome can be advantageous, increasing the resulting organism’s fitness, deleterious, reducing the fitness, or effectively neutral, having such a small effect on fitness that the fate of the mutation in the population is dominated by random drift. The relative fraction of these three different types of mutations, and the form of the overall distribution of fitness effects ( , where
  and
and  are the fitness of the wild type and mutant, respectively) caused by such mutations, has been a topic of interest and debate (Bustamante 2005; Eyre-Walker and Keightley 2007). Characterizing this distribution is essential for understanding the nature of genetic variation, including polymorphisms that may cause or influence diseases, as well as characterizing the evolutionary dynamics.
Larger population sizes result in increased magnitude of the selective pressure acting on mutations of a given value of s. The fitness effect and the effective population size  generally appear as a product in many evolutionary and genetic calculations, so often equations reference the population-scaled fitness effect
  (
( for haploid organisms). For instance,
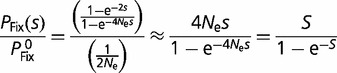
  , the probability of a new mutation with fitness effect s being fixed in an otherwise homogeneous diploid population, relative to the probability of fixation of a neutral mutation
  , is given by (Fisher 1930; Kimura 1957, 1962; Crow and Kimura 1970)
 |
(1) |
where the approximation is valid for small s.
The effective population size affects the substitution rate differently depending up the relative number of advantageous, deleterious, and neutral mutations (Gillespie 1999). If there are a substantial number of adaptive mutations, whose probability of fixation is less dependent on the population size, the substitution rate would be higher in larger populations reflecting the greater number of mutations that arise. Conversely, if the mutations are either neutral or so deleterious as to have negligible fixation probability, as suggested by the neutral theory of molecular evolution (Kimura 1968, 1983), then the substitution rate would be relatively independent of population size, with the greater number of mutations cancelling the decreased probability of fixation. The nearly neutral theory of evolution (Ohta 1973, 1992; Kimura 1983) emphasizes the role of slightly deleterious mutations, whose probability of acceptance is smaller in larger populations. This latter theory predicts that smaller populations should evolve faster.
Observations of the population dependence of the substitution rate are difficult. One approach is to examine the dependence of the substitution rate on the rate of recombination. In regions of the genome with low recombination rates, mutations in linked genes compete for fixation (Hill and Robertson 1966), which has a similar effect as a lower effective population size. High recombination rates reduce this effect, so that regions of the genome that recombine rapidly are characterized by an increased effective population size. It has been observed that regions in Drosophila genome with high recombination rates evolve slower than regions of low recombination rates, consistent with the predictions of the nearly neutral theory (Larracuente et al. 2008; Arguello et al. 2010; Campos et al. 2012). Other studies have looked at the difference in the evolution of genes on sex chromosomes, observing higher rates of nonsynonymous substitutions on the nonrecombining chromosome (Wyckoff et al. 2002; Berlin and Ellegren 2006). These types of analysis assume that the mutation process in these two different types of regions, as well as the properties of the encoded proteins (e.g., expression levels, structure, and function), are not systematically dissimilar in ways that affect the substitution rate. There are, for instance, correlations between recombination rate, GC content, mutation rate, and rate of biased gene conversion that remain to be elucidated (Hardison et al. 2003; Duret 2006; Duret and Arndt 2008). Sex chromosomes might also be subject to specific adaptive selection that cannot be easily distinguished from reduced selection.
A more direct approach is to examine how the substitution rate differs in different lineages. For instance, substitution rates have been compared in primates and rodents (Wu and Li 1985; Ohta 1995; Weinreich 2001), although such comparisons are compromised by differences in, for example, generation time, cell division rate, metabolic rate, mating behavior, ecological niche, and DNA repair mechanisms (Bromham et al. 1996; Bromham 2011). Faster evolution has been observed in endosymbiotic bacteria and fungi compared with their free-living relatives (Moran 1996; Woolfit and Bromham 2003). Endosymbiotic bacteria and fungi would have their effective population size reduced by the lower population sizes of their host, and would also be expected to undergo population bottlenecks when relatively few endosymbionts are transmitted to progeny, reducing the intra-host variation; this process is generally modelled as reducing the effective population size (Rispe and Moran 2000). The faster evolution of the endosymbionts is again consistent with the nearly neutral theory, although other biological or ecological characteristics of endosymbionts might complicate the analysis. Comparisons have been made of the rates of evolution of island and mainland populations, with the island populations again having a smaller population size due to the population bottleneck that occurs during colonialization as well as due to habitat restriction; some studies have concluded that the smaller populations evolve faster (Johnson and Seger 2001; Woolfit and Bromham 2005), although other studies have reached different or more nuanced conclusions (Charlesworth and Eyre-Walker 2007; Wright et al. 2009).
Theoretical models of these effects are often based on simple models of the fitness landscape, such that the distribution of fitness effects is constant (Ohta 1977) or that the fitness of the mutant alleles has a fixed distribution (Kingman 1978). These models can break down if the population is far from a fitness optimum due to mutation–selection balance, where the preponderance of deleterious mutations is balanced by the greater fixation probabilities of advantageous mutations (Hartl et al. 1985; Cherry 1998; Wylie and Shakhnovich 2011; Charlesworth 2013). Mutation–selection balance cannot be achieved if the distribution of selective coefficients is independent of fitness; a stable equilibrium requires that there be an increased tendency toward acceptance of deleterious mutations as the fitness increases (Cherry 1998). In the case of a fitness function that plateaus as the fitness increases, increasing the population size would result in a higher equilibrium fitness, which can reduce the fitness impact of mutations, resulting in a narrower distribution of fitness effects. Under some conditions, this contraction of the distribution in s can exactly cancel the explicit population size dependence of S, so that the distribution of population-scaled fitness effects [ ], and therefore the substitution rate, is independent of population size, even in the nearly neutral model (Cherry 1998; Charlesworth 2013).
The evolutionary process involves modifications of interacting biological macromolecules. By creating evolutionary models that explicitly include the properties of these evolving biomolecules, we can develop more realistic models of the evolutionary process, better understand how the evolutionary dynamics depends on biological context, and improve our understandings of how the properties of these biological molecules arose. To fulfill these ambitions, we need to create computational models that capture the salient aspects of the biology while still being computationally tractable.
It has been noted that much of the selection pressure on coding regions involves maintaining an adequate degree of thermodynamic stability for the resulting expressed proteins (Wang and Moult 2001; Zeldovich et al. 2007; Drummond and Wilke 2008; Serohijos et al. 2012). This has led to studies investigating how these genetic regions would evolve where the fitness corresponds to a simple function of stability, such as the fraction of proteins that would be folded at equilibrium (Williams et al. 2006; Chen and Shakhnovich 2009; Goldstein 2011; Wylie and Shakhnovich 2011; Pollock et al. 2012). We investigate the distribution of selective effects generated by such a simple model, including its dependence on the effective population size. Our results correspond roughly to the nearly neutral theory. We find that the distribution of population-scaled fitness effect [ ] is essentially independent of the effective population size, suggesting that evolutionary dynamics, at least of regions of protein-coding genes where selection for stability dominates, should be similarly independent of population size. We observe, however, a strong dependence of the distribution of fitness effects, as well as overall substitution rate, on fluctuations in population size. This result can explain why differences in substitution rates have been observed in different lineages, and indicate that the effect of population bottlenecks on substitution rates cannot be modeled through an appropriate modification of the effective population size.
Materials and Methods
Protein Model
We consider a genome containing a 900-nucleotide gene, coding for a 300-residue protein, as described in earlier publications (Williams et al. 2006; Goldstein 2011; Pollock et al. 2012). We use a simple fitness function based on protein stability, where the fitness w of a protein is equal to the probability that the protein is folded at equilibrium PFolded, given by
| (2) |
where  is the difference in free energy between the folded and unfolded states, T is the temperature, and k is Boltzmann’s constant. (Note that more negative values of
  correspond to higher stability.)
The free energy  of a protein with sequence
  in any given conformation
  is computed by summing the contact energies of all of the pairs of residues which are in contact in that conformation, where we use the contact energies determined by Miyazawa and Jernigan (1985) based on frequencies of contacts in known protein structures; residues are in contact if their
  atoms (
 for glycine) are closer than 7 Å to each other. We consider the native state of the protein to be the conformation of the purple acid phosphatase (PDB 1QHW; Lindqvist et al. 1999); the free energy for a given sequence in this particular native state is designated
  . We assume that the distribution of free energies for the large ensemble of
  unfolded states can be represented as a Gaussian distribution with mean
  and variance
  . We estimate
  and
and  by calculating the free energy of the sequence in a set of 55 alternative structures. The free energy difference between the folded and unfolded states is then given by
| (3) |
 is set to 10160. T is set to 20 °C. The probability of folding, and thus the fitness, is then calculated using equation (2).
Evolutionary Model
We initialize a nucleic acid sequence to a set of 300 random codons (excluding stop codons). The codons are translated into a protein sequence using the standard genetic code, and the free energy of folding (and organismal fitness) calculated as described earlier. We simulate evolutionary dynamics where we assume that the mutation rate is slow relative to the fixation time, so that population variation can be ignored. We calculate the rate of all 3 × 900 possible single nucleotide substitutions, equal to the rate of mutation (using a K80 nucleotide substitution model [Kimura 1980] with a transition-transversion ratio of 2.0) times the probability of fixation of the mutation, calculated by computing the free energy of folding of the mutant and using equation (1). (Mutations resulting in stop codons are considered lethal.) We estimate the time to the next substitution by drawing from an exponential distribution with decay rate equal to the sum of all of the individual substitution rates, and choose a mutation to accept with probability proportional to its substitution rate. The protein sequence evolves with increasing stability (decreasing  ) until the point of mutation–selection balance, where there is no further long-term change of stability. The simulation is then extended to an evolutionary interval of 10 nucleotide substitutions expected per nucleotide location for neutral substitutions. Only the data subsequent to the establishment of mutation–selection balance are used in the subsequent analysis. These simulations are repeated 100 times with
  = 104,
  = 106, and
  = 108.
At each time point of the simulation, we calculate the effect of every possible single nucleotide mutation, and use all of these mutations to calculate the distribution of population-scaled fitness effects [ ] as well as the instantaneous substitution rate, represented by the ratio of nonsynonymous to synonymous substitution rates (dN/dS).
Explorations of Alternative Models
How sensitive are the results to a particular model? Two aspects of this model might be particularly relevant: 1) the specific relationship between fitness and stability; 2) the epistasis between various locations in the protein in calculating the fitness. We examine these aspects sequentially.
The relationship between protein stability and organismal fitness is still unclear and is possibly complicated (Bershtein et al. 2012). In particular, there are indications that avoiding aggregation may be more important than the concentration of the folded state (Chen and Dokholyan 2008; Zhang et al. 2008; Johnson and Hummer 2011; Levy et al. 2012; Yang et al. 2012). A linear relationship has been observed between fitness cost and fraction of aggregated proteins (Geiler-Samerotte et al. 2011); such an effect would not greatly change the model discussed earlier, as it still results in a linear relationship between fraction of folded protein and fitness, albeit with a different slope. To see how sensitive the results are to variations in the fitness function, we consider a different fitness function representing a fitness penalty for aggregation, which we model using a quadratic function of the amount of unfolded protein
| (4) |
where  is chosen so that
  at
at  is roughly similar to that in the original model represented by equation (2). Thirty simulations are made for each of the three values of
  using this fitness function.
Removing Epistasis
The contribution of every residue to the fitness depends on the amino acids at every other location in the protein. This is due to two different aspects of the model. First, the energetics are based on contact potentials, which are a function of pairs of amino acids which are in contact in the native or alternative structures. Second, the fitness is a nonlinear function of the free energy of folding, as indicated by equation (2). In particular, an amino acid substitution at one location in the protein will cause a change in the protein’s stability, but the effect of this change on the protein fitness will depend on the prior stability, which depends on the amino acids found in all other locations. This can be seen if we represent s as a function of the initial stability and change in stability (Wylie and Shakhnovich 2011)
 |
(5) |
To remove these sources of epistasis, we construct a model where the fitness contribution of every amino acid at each location is fixed. We first compute the fitness wRef of the reference sequence. We then calculate the change in fitness for every single amino acid change, to generate 
 , where
 is the fitness of an amino acid sequence differing from the reference sequence by the single replacement of
  for
for  . The fitness of any arbitrary sequence is represented as
| (6) |
The fitness effect  corresponding to a mutation from amino acid
  to
to  at position l is given by
 |
(7) |
where we have taken advantage of the fact that the fitnesses during the simulation are all close to unity.
For calculating the resulting distribution of population-scaled fitness effects, we take advantage of the simplicity of the model to calculate the distributions by summing over all possible mutations from all possible codons at each location, weighted by the equilibrium probability of the original codon and the mutation, using the approaches described in Tamuri et al. (2012). We averaged over the results obtained with 10 different reference sequences.
Variations in Effective Population Size: Bottlenecks
We also perform simulations with the original model (eq. 2) where the effective population size fluctuates between 106 and 104, representing periodic population bottlenecks, with equal amounts of evolutionary time spent at each population level. The period of the oscillations in units of evolutionary time vary between 0.001 and 1.0 expected neutral substitutions per location, with 10 simulations performed for each period.
Results
After an initial period, the free energy of folding of the proteins reached values of approximately  ∼ −7 for
  = 104 to −12 kcal mol−1 for
  = 108. This degree of stability is roughly similar to that observed in real proteins. It is important to note that this stability is far from optimum; we can use hill-climbing algorithms to find sequences with stabilities in the order of −118 kcal/mol (Goldstein 2011). This marginal stability is also observed with natural proteins, which can be modified to have higher stabilities while retaining native-like activities (Serrano et al. 1993; Giver et al. 1998; Van den Burg et al. 1998; Zhao and Arnold 1999; Korkegian et al. 2005). The stability of these modelled proteins represents mutation–selection balance, where the greater number of destabilizing mutations is compensated by the higher acceptance rate for stabilizing mutations (Goldstein 2011).
Figure 1 shows the distribution of population-scaled fitness effects of nonsynonymous mutations for three different population sizes varying over four orders of magnitude. As can be seen, the distributions are extremely similar. All of the distributions of deleterious mutations are strongly leptokurtic, fitting an inverted Gamma distribution with shape parameter  . Approximately 25% of mutations are effectively neutral (
 ), approximately 25% are mildly deleterious (
 ), and 50% are strongly deleterious (
 ). Although the distribution corresponds to the near-neutral theory, the substitution rate is nearly independent of population size, in agreement with the predictions of Cherry (1998): the average ratio of nonsynonymous to synonymous substitution rates (
 ) only changes minimally, from 0.350 for
  = 104 to 0.338 for
  = 108.
Fig. 1.—
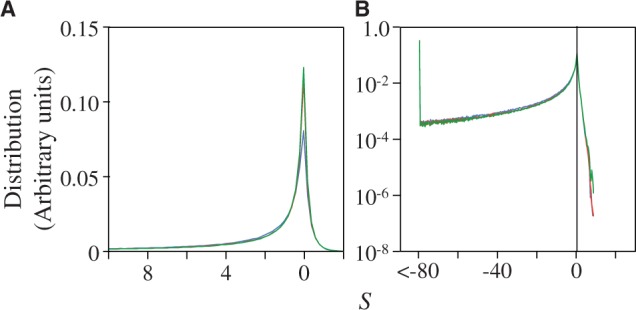
Distribution of population-scaled fitness effects for nonsynonymous mutations when fitness is proportional to the fraction of proteins folded at equilibrium, calculated using equation (2), for  = 104 (green),
  = 106 (blue), and
  = 108 (red), on linear (A) and log (B) scales.
Explorations of Alternative Models
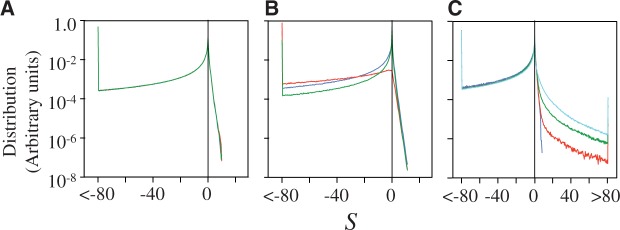
To see how the results vary with the fitness function, we perform simulations using an alternative model based on aggregation, as represented by equation (4). The resulting distribution of population-scaled fitness effects (fig. 2A) is similar to the earlier model, with a rate of evolutionary change essentially independent of effective population size, with  changing from 0.327 for
  = 104 to 0.323 for
  = 108.
Fig. 2.—
(A) Distribution of population-scaled fitness effects for nonsynonymous mutations using a fitness model penalizing unfolded protein, based on equation (4), for  = 104 (green),
  = 106 (blue), and
  = 108 (red). (B) Distribution of population-scaled fitness effects for a model where epistasis has been removed, based on equation (7), with the same color scheme as (A). (C) Distribution of population-scaled fitness effects for effective population size oscillating between 104 and 106, with the fitness calculated using equation (2), for various periods of the fluctuation: fixed at
  = 106 (blue), period = 0.1 (red), 0.01 (green), and 0.001 (cyan). Periods represent durations in evolutionary time corresponding to expected number of base substitutions per nucleotide position under conditions of neutral evolution.
Removing epistasis through the use of the model represented by equation (7) results in a strong dependence of the distribution of S on the population size, as shown in figure 2B. There is also an extremely strong dependence of the substitution rate with effective population size, with  changing from 0.725 for
  = 104 to 0.357 for
  = 106 to 0.027 for
  = 108.
Variations in Effective Population Size: Bottlenecks
In contrast to differences in effective population size, there can also be fluctuations in effective population size. We perform simulations where the effective population size alternates between  = 106 and
  = 104, as illustrated in the bottom of figure 3A, representing repetitive population bottlenecks. The resulting distribution of population-scaled fitness effects, for various timescales of population changes, is shown in figure 2C. With faster changes in population, there is a substantial increase in the number of advantageous mutations. The dependence of the rate of evolution on the period of the population changes is shown in figure 3B. With faster and faster changes, there is approximately a doubling of the average value of dN/dS. The instantaneous value of dN/dS for a period of fluctuation of 0.1, averaged over 1,000 cycles, is shown in figure 3A. Both increases and decreases in effective population sizes cause increases in the instantaneous value of dN/dS; when the population size increases, there is increased selection for greater stability, resulting in an increase in the number of stabilizing (adaptive) substitutions, while decreases in the population size results in a decrease in selective constraints, resulting in increased acceptance of slightly destabilizing substitutions.
Fig. 3.—
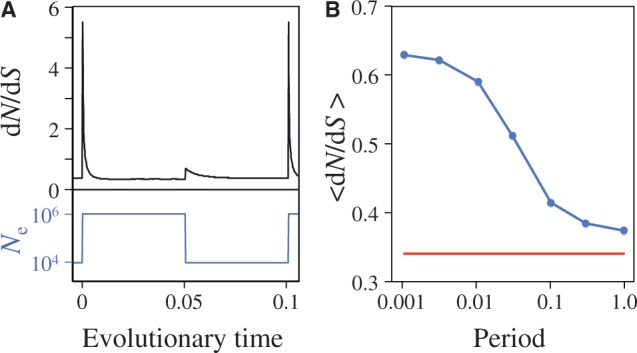
(A) Instantaneous values of dN/dS during fluctuations in effective population size, when the fluctuations have a period of 0.1. Both increases and decreases in population size cause transient increases in the rate of evolution. Periods represent durations in evolutionary time corresponding to expected number of base substitutions per nucleotide position under conditions of neutral evolution. (B) Averaged values of  for fluctuating population sizes, as a function of the period of the fluctuations (blue). The value of
  when the population is fixed at
  = 106 is shown for comparison (red).
Discussion
Using a simple but reasonable model of protein thermodynamics to provide a fitness function, we find that the distribution of the population-scaled fitness effects and the substitution rate are remarkably unaffected by the effective population size. In contrast to the small dependence of these evolutionary parameters on  , we find a strong effect from time varying effective population sizes. There is a large transient increase in the number of adaptive substitutions when the population size increases, as the protein adapts to the greater degree of selective pressure; there is also a transient increase in the number of slightly deleterious substitutions when the population size decreases, as the selective pressure relaxes and the protein evolves to lower stabilities. This effect depends on the timescale of the population fluctuations, but is significant over a wide range.
Why the Lack of Dependence on Effective Population Size?
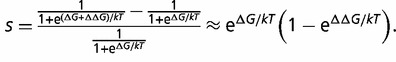
When a mutation occurs, the values of s and S corresponding to a given value of  is approximately given by
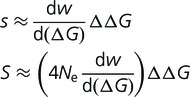 |
(8) |
where we have assumed that the fitness of the wild type is close to unity (true of these simulations) and that the magnitude of  is sufficiently small that a Taylor expansion is justified. (This is also not a bad assumption, as mutations with very large destabilizing effects will be evolutionarily unimportant, and mutations with very large stabilizing effects are extremely rare.) (A more exact but less general calculation can be performed starting with eq. 5.) For any given values of
  and
and  , S is proportional to
  , so that distribution of population-scaled selective effects,
  , is then a stretched version of
  given by
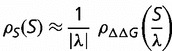 |
(9) |
where  is given by
| (10) |
The stability is based on a large number of stabilizing and destabilizing interactions, involving residues throughout the protein. The magnitude of these interactions is on the same scale as the total free energy of folding, so that significant changes in  can be caused by modifying only a few of these interactions. As a result the distribution of changes of free energy of folding,
  , is relatively unaffected by the stability
  , as long as the protein is not excessively (i.e., unrealistically) stable (Goldstein 2011), a conclusion that has been verified both by other simulations and experimental measurements (Bloom et al. 2005, 2006, 2007; Tokuriki et al. 2007).
Although  is independent
  , the slope of the fitness function of equation (2)
 |
(11) |
will be dependent on the protein stability, becoming closer to zero as the protein stability increases, so that  is dependent on
  as well as
  .
.
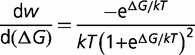
As a protein evolves toward higher stability, the distribution of  is constant but the selective pressure relaxes until the expected change in fitness, or alternatively the equilibrium average value of S for accepted mutations, is approximately zero. We can describe this equilibrium condition as
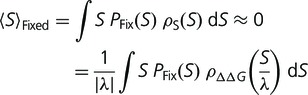 |
(12) |
where  represents the value of S averaged over fixed substitutions, and
  is the fixation probability, which we are assuming, as in equation (1), is only a function of S. Note that, as long as
  is fixed, the only adjustable parameter in equation (12) is
  . There will be a certain value of
  where equation (12) is satisfied. (For the current model, this value is approximately
  .) More negative values result in a positive
  , moving the system to a flatter region of the fitness curve, making
  less negative, while less negative values result in a positive
  . The result is that the free energy of folding will change, modifying
  until
until  , so that the change in the slope of the fitness landscape cancels the effect of the changing population size. At this equilibrium, the distribution of population-scaled fitness effects will be given by equation (9) with
  . The resulting distribution of S will be dependent on the value of
  , which will depend on the forms of
  and
and  , but not on the value of
  .
.
The generality of this argument indicates that this observation should not be dependent on a specific fitness function. What is required is for the fitness to be a concave function of some parameter and that this parameter is what Cherry terms an equimutable parameter, where the distribution of changes of this parameter with mutations is independent of its current value (Cherry 1998); for the current model, this is satisfied by the observed independence of  on
on  . It is likely that the characteristics of protein stability that provide for equimutability—that stability is a composite function that depends on contributions from many appropriately sized terms, where the rapidly declining number of increasingly stable sequences means the stability is far from optimal—is common in biology. We use fraction of proteins folded (eq. 2) as our fitness function, but alternative formulations (avoiding of self aggregation, eq. 4) give similar results. The calculation of the fitness is highly epistatic, where the contribution of each amino acid to the fitness depends on the rest of the protein sequence. This epistasis is required for this population size independence. When the epistasis is removed and the fitness becomes the sum of a large number of contributions from simple states, the fitness function ceases to be a concave function of a composite property, and a strong population size dependence results, as shown in figure 2B.
The results presented here indicate that changes in population size affect evolutionary dynamics quite differently from differences in population size, as has been suggested by Charlesworth and Eyre-Walker (2007) and Cherry (1998). In particular, they noted that large increases in population size can cause adaptive bursts that overcome the decrease in substitution rate due to the stronger selective constraints. The work presented here also emphasizes the role of population changes, except in our model it is only the changes in population size that cause significant changes in the substitution rate. As a result, population increases of arbitrary size will cause increases in the substitution rate, as there is no decrease in the substitution rate to be overcome. Similarly, decreases in the population size will cause increases in the substitution rate, but this will only be a transient effect resulting from the change in population size, rather than the difference in population size.
How Does the Substitution Rate Depend on the Distribution of Mutational Effects?
In addition to being largely independence of population size, the substitution rate will also be independent of the magnitude of the effect of mutations on the protein stability; that is, scaling all of the values of  by a constant factor
  will result in a change the stability of the protein so as to scale
  by
by  , resulting in the same distribution of
  and thus the same substitution rate. The substitution rate, however, is dependent on the shape of
  To explore this dependence, we constructed a simpler model where a fraction
  of all mutations is destabilizing (with change in free energy of folding
  ), a fraction
  is neutral (
 ), and a fraction
  is stabilizing (with change in free energy of folding
  ). The protein stability
  is adjusted until equation (12) is satisfied, and the relative fitness of the three different types of mutants and the corresponding acceptance rates calculated using equation (1). Figure 4A shows the dependence of the substitution rate
  on the fraction
  and effect
  of the destabilizing mutations (
 ,
,  ,
, 
 ). As shown, the rate is relatively insensitive to the magnitude of the destabilization, but extremely sensitive to the relative fraction. Increasing
  results in a corresponding stabilization of the protein, resulting in a movement to the flatter part of the fitness curve, reducing the impact of these deleterious mutations on the fitness. Compensation resulting from changes in
  are much weaker. Modifying the fraction and effect of stabilizing mutations shows a smaller effect, with the substitution rate increasing both with the fraction and magnitude of the stabilization, as shown in figure 4B (
 ,
,  ,
,  ).
).
Fig. 4.—
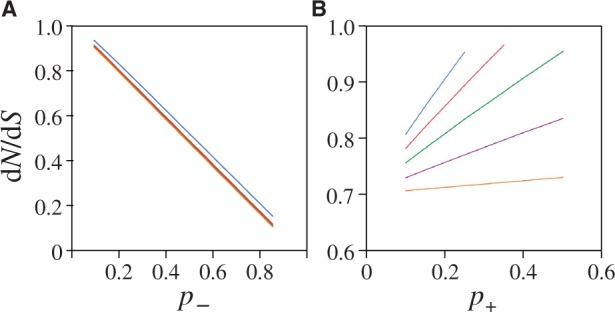
(A) Effect on dN/dS of changing the fraction of mutations that are deleterious ( ), computed using a simple model, where the effect of the mutation on the free energy of folding is equal to
  (blue),
  (red),
  (green),
  (purple), and
  (orange). Other parameters as defined in the text. (B) Effect on dN/dS of changing the fraction of mutations that are advantageous (
 ), computed using a simple model, where the effect of the mutation on the free energy of folding is equal to
  (blue),
  (red),
  (green),
  (purple), and
  (orange). Other parameters as defined in the text.
Comparison with Experimental Observations
The results presented here seem in contradiction with the observations described in the Introduction, where faster substitution rates are observed in 1) regions of the genome undergoing slow recombination compared with regions undergoing fast recombination, 2) endosymbionts compared with their free living relatives, and 3) island populations compared with mainland populations. In each of these three cases, there seems to be faster evolution in smaller populations, as would be predicted based on the nearly neutral model.
As remarked earlier, there are many complicated issues in these comparisons, so that it is difficult to conclude that the only relevant differences between these two sets are differences in effective population size. We also note that the differences in substitution rates observed in these comparisons are generally quite modest. For instance, Woolfit and Bromham (2005) observed a median increase in dN/dS of only 20% in island populations compared with mainland populations, with no significant increase in overall substitution rate. Campos et al. (2012) observed that autosomal genes in nonrecombining regions in Drosophila had a dN/dS ratio of approximately 45% higher than similar genes in recombining regions of the genome. Although it is difficult to make quantitative comparisons with the simple models presented here, and it is difficult to estimate differences in effective population sizes (Gossmann et al. 2011, 2012), position-specific measures of fitness, as represented by equation (7), result in dN/dS increasing by a over factor of over 26 as the population size is reduced from 108 to 104, which suggests that it may be the weakness of effect of population size on substitution rate that requires an explanation.
Additionally, these comparisons often interpret changes in effective population size as equivalent to differences in effective population size. Island populations undergo severe population bottlenecks, and bottlenecks are generally considered to reduce the effective population size. The analysis presented here suggests that population bottlenecks affect evolutionary dynamics quite differently from constant differences in population size, and it might be the population bottlenecks, with the resulting decrease and increase in selective constraints, that are affecting the substitution rate, while a static lower effective population size would have no such effect. Charlesworth and Eyre-Walker (2007), for instance, observed that differences in substitution rate between island and mainland populations depend upon whether a mainland population colonized an island (population size decrease in the island population) or an island population colonized a mainland (population size increase in the mainland population). Significantly, in the latter case, the mainland population generally had a higher rate of evolution than the island population, as would be predicted by the model presented here. This indicates that comparisons between the evolution of different lineages should be interpreted with care, as it would be difficult to disentangle the very different ways that static population size differences and population size fluctuations contribute to substitution rates. This is an inherent problem with this type of comparisons, as related lineages with different effective population sizes must have experienced the changes in population size that caused these differences.
A similar argument can be made comparing the effect of recombination rates on effective population size. Competition between mutations occurring at different points on a genetically linked region of the genome may correspond to reduced effective population sizes, but these mutations would occur sporadically. In this case, there would be temporal fluctuations in this effective population size, as other mutations with different fitness effects occur in nearby genes. In this way, lack of recombination would result in variations in effective population size, increasing the rate of evolutionary change, as has been observed experimentally (Larracuente et al. 2008; Arguello et al. 2010; Campos et al. 2012). Regions of low or no recombination would also be more subject to selective sweeps, providing a further mechanism for rapid changes in effective population size. Again, as with lineage-specific substitution rates, it is difficult to disentangle differences from fluctuations in effective population sizes.
Why Do Some Proteins Evolve Faster than Others?
As pointed out by Cherry (1998), with the exception of conspicuous outliers, differences in the substitution rates in different proteins is surprisingly modest, varying by approximately an order of magnitude (Grishin et al. 2000). Differences in the mutation rate in different parts of the genome would contribute to this rate variation, as would differences in the number of sites under nonthermodynamic constraints such as the requirements of functionality (Zuckerkandl 1976). In addition, as described earlier, the substitution rate is strongly dependent on  , in particular on the fraction of destabilizing mutations. It is likely that this distribution is dependent on the size, structure, composition, and environment of the protein, leading to variation in the substitution rates. Finally, there has been significant interest in proteins that are unfolded under physiological conditions, or contain significant unstructured regions (Wright and Dyson 1999; Dunker et al. 2008). The selective constraints on these proteins and regions are still poorly understood.
Limitations of the Model
Evolutionary dynamics are dependent on the mapping between genotype, phenotype, and fitness. In this article, we analyze a model of protein thermodynamics that provide a reasonable mapping between these quantities. It is known that achieving sufficient thermodynamic stability is an important selective constraint for many proteins (Wang and Moult 2001; Zeldovich et al. 2007; Drummond and Wilke 2008; Serohijos et al. 2012). Although our model of thermodynamics is, by necessity, simplistic, it does include many realistic aspects, such as the need for considering differences between the free energy of the native state and a large ensemble of alternative states and the stability being a holistic function of many epistatic energetic interactions. Importantly, it reproduces many known properties of proteins and their evolution, such as the observed marginal stability, the higher rate of evolution of exposed locations compared with buried locations, the tendency for hydrophobic residues to cluster in the interior, the dependence of protein stability on population size, and over-dispersion of the molecular clock (Goldstein 2011).
Our measure of organismal fitness, the fraction of proteins folded at equilibrium, is certainly overly simple. There are likely to be specific requirements at particular locations in the protein, necessary for achieving functionality. These requirements on the protein sequence will, however, likely be sufficiently rigid so that changes in these locations would contribute minimally to the evolutionary dynamics. Other properties, such as resistance to aggregation, are also likely significant (Chen and Dokholyan 2008; Zhang et al. 2008; Johnson and Hummer 2011; Levy et al. 2012; Yang et al. 2012). Using a different fitness function based on avoiding aggregation, as represented by equation (4), did not significantly change the results. As long as the fitness function is a concave function of free energy of folding, increasing the population size will move the protein to a higher, and correspondingly flatter, region of the fitness landscape, and will result in the population-independent substitution rates described here. This is likely true even if the fitness is a concave function of some other quantity besides protein stability (such as saturation kinetics in biochemical reactions; Hartl et al. 1985), as long as this quantity is an aggregate quantity dependent on overall properties of the protein sequence that fulfils the equimutability criterion.
An important caveat of this analysis is the assumption of a slow mutation rate, so that the time for fixation (or elimination) is short relative to the length of evolutionary time between mutations. Genetic variation in the population would affect the substitution rate and would also be dependent on the population size. Wylie and Shakhnovich (2011), for instance, have observed in a simple model that the distribution of fitness effects depends on the mutation rate, indicating that the presence of multiple mutations in the population has an effect. Similar complications can emerge if the timescale for fluctuations in population size become comparable with or shorter than the fixation time (Otto and Whitlock 1997). Neglecting this effect is a limitation of this work.
Acknowledgments
The author thanks Brian Charlesworth and Adam Eyre-Walker for helpful discussions. This work was supported by the NIMR (MRC).
Literature Cited
- Arguello JR, et al. Recombination yet inefficient selection along the Drosophila melanogaster subgroup's fourth chromosome. Mol Biol Evol. 2010;27:848–861. doi: 10.1093/molbev/msp291. [DOI] [PMC free article] [PubMed] [Google Scholar]
- Berlin S, Ellegren H. Fast accumulation of nonsynonymous mutations on the female-specific W chromosome in birds. J Mol Evol. 2006;62:66–72. doi: 10.1007/s00239-005-0067-6. [DOI] [PubMed] [Google Scholar]
- Bershtein S, Mu W, Shakhnovich EI. Soluble oligomerization provides a beneficial fitness effect on destabilizing mutations. Proc Natl Acad Sci U S A. 2012;109:4857–4862. doi: 10.1073/pnas.1118157109. [DOI] [PMC free article] [PubMed] [Google Scholar]
- Bloom JD, Labthavikul ST, Otey CR, Arnold FH. Protein stability promotes evolvability. Proc Natl Acad Sci U S A. 2006;103:5869–5874. doi: 10.1073/pnas.0510098103. [DOI] [PMC free article] [PubMed] [Google Scholar]
- Bloom JD, Raval A, Wilke CO. Thermodynamics of neutral protein evolution. Genetics. 2007;175:255–266. doi: 10.1534/genetics.106.061754. [DOI] [PMC free article] [PubMed] [Google Scholar]
- Bloom JD, et al. Thermodynamic prediction of protein neutrality. Proc. Natl Acad Sci U S A. 2005;102:606–611. doi: 10.1073/pnas.0406744102. [DOI] [PMC free article] [PubMed] [Google Scholar]
- Bromham L. The genome as a life-history character: why rate of molecular evolution varies between mammal species. Philos Trans R Soc Lond B Biol Sci. 2011;366:2503–2513. doi: 10.1098/rstb.2011.0014. [DOI] [PMC free article] [PubMed] [Google Scholar]
- Bromham L, Rambaut A, Harvey PH. Determinants of rate variation in mammalian DNA sequence evolution. J Mol Evol. 1996;43:610–621. doi: 10.1007/BF02202109. [DOI] [PubMed] [Google Scholar]
- Bustamante CD. Population genetics of molecular evolution. In: Nielsen R, editor. Statistical methods in molecular evolution. New York: Springer-Verlag; 2005. pp. 63–99. [Google Scholar]
- Campos JL, Charlesworth B, Haddrill PR. Molecular evolution in nonrecombining regions of the Drosophila melanogaster genome. Genome Biol Evol. 2012;4:278–288. doi: 10.1093/gbe/evs010. [DOI] [PMC free article] [PubMed] [Google Scholar]
- Charlesworth B. Stablizing selection, purifying selection, and mutational bias in finite populations. Genetics. 2013;194:955–971. doi: 10.1534/genetics.113.151555. [DOI] [PMC free article] [PubMed] [Google Scholar]
- Charlesworth J, Eyre-Walker A. The other side of the nearly neutral theory, evidence of slightly advantageous back-mutations. Proc Natl Acad Sci U S A. 2007;104:16992–16997. doi: 10.1073/pnas.0705456104. [DOI] [PMC free article] [PubMed] [Google Scholar]
- Chen P, Shakhnovich EI. Lethal mutagenesis in viruses and bacteria. Genetics. 2009;183:639–650. doi: 10.1534/genetics.109.106492. [DOI] [PMC free article] [PubMed] [Google Scholar]
- Chen Y, Dokholyan NV. Natural selection against protein aggregation on self-interacting and essential proteins in yeast, fly, and worm. Mol Biol Evol. 2008;25:1530–1533. doi: 10.1093/molbev/msn122. [DOI] [PMC free article] [PubMed] [Google Scholar]
- Cherry JL. Should we expect substitution rate to depend on population size? Genetics. 1998;150:911–919. doi: 10.1093/genetics/150.2.911. [DOI] [PMC free article] [PubMed] [Google Scholar]
- Crow JF, Kimura M. An introduction to population genetics theory. New York: Harper & Row; 1970. [Google Scholar]
- Drummond DA, Wilke CO. Mistranslation-induced protein misfolding as a dominant constraint on coding-sequence evolution. Cell. 2008;134:341–352. doi: 10.1016/j.cell.2008.05.042. [DOI] [PMC free article] [PubMed] [Google Scholar]
- Dunker AK, Silman I, Uversky VN, Sussman JL. Function and structure of inherently disordered proteins. Curr Opin Struct Biol. 2008;18:756–764. doi: 10.1016/j.sbi.2008.10.002. [DOI] [PubMed] [Google Scholar]
- Duret L. The GC content of primates and rodents genomes is not at equilibrium: a reply to Antezana. J Mol Evol. 2006;62:803–806. doi: 10.1007/s00239-005-0228-7. [DOI] [PubMed] [Google Scholar]
- Duret L, Arndt PF. The impact of recombination on nucleotide substitutions in the human genome. PLoS Genet. 2008;4:e1000071. doi: 10.1371/journal.pgen.1000071. [DOI] [PMC free article] [PubMed] [Google Scholar]
- Eyre-Walker A, Keightley PD. The distribution of fitness effects of new mutations. Nat Rev Genet. 2007;8:610–618. doi: 10.1038/nrg2146. [DOI] [PubMed] [Google Scholar]
- Fisher RA. The distribution of gene ratios for rare mutations. Proc R Soc Edinburgh. 1930;50:205–220. [Google Scholar]
- Geiler-Samerotte KA, et al. Misfolded proteins impose a dosage-dependent fitness cost and trigger a cytosolic unfolded protein response in yeast. Proc Natl Acad Sci U S A. 2011;108:680–685. doi: 10.1073/pnas.1017570108. [DOI] [PMC free article] [PubMed] [Google Scholar]
- Gillespie JH. The role of population size in molecular evolution. Theor Popul Biol. 1999;55:145–156. doi: 10.1006/tpbi.1998.1391. [DOI] [PubMed] [Google Scholar]
- Giver L, Gershenson A, Freskgard PO, Arnold FH. Directed evolution of a thermostable esterase. Proc Natl Acad Sci U S A. 1998;95:12809–12813. doi: 10.1073/pnas.95.22.12809. [DOI] [PMC free article] [PubMed] [Google Scholar]
- Goldstein RA. The evolution and evolutionary consequences of marginal thermostability in proteins. Proteins. 2011;79:1396–1407. doi: 10.1002/prot.22964. [DOI] [PubMed] [Google Scholar]
- Gossmann TI, Keightley PD, Eyre-Walker A. The effect of variation in the effective population size on the rate of adaptive molecular evolution in eukaryotes. Genome Biol Evol. 2012;4:658–667. doi: 10.1093/gbe/evs027. [DOI] [PMC free article] [PubMed] [Google Scholar]
- Gossmann TI, Woolfit M, Eyre-Walker A. Quantifying the variation in the effective population size within a genome. Genetics. 2011;189:1389–1402. doi: 10.1534/genetics.111.132654. [DOI] [PMC free article] [PubMed] [Google Scholar]
- Grishin NV, Wolf YI, Koonin EV. From complete genomes to measures of substitution rate variability within and between proteins. Genome Res. 2000;10:991–1000. doi: 10.1101/gr.10.7.991. [DOI] [PMC free article] [PubMed] [Google Scholar]
- Hardison RC, et al. Covariation in frequencies of substitution, deletion, transposition, and recombination during eutherian evolution. Genome Res. 2003;13:13–26. doi: 10.1101/gr.844103. [DOI] [PMC free article] [PubMed] [Google Scholar]
- Hartl DL, Dykhuizen DE, Dean AM. Limits of adaptation: the evolution of selective neutrality. Genetics. 1985;111:655–674. doi: 10.1093/genetics/111.3.655. [DOI] [PMC free article] [PubMed] [Google Scholar]
- Hill WG, Robertson A. The effect of linkage on limits to artificial selection. Genet Res. 1966;89:311–336. doi: 10.1017/S001667230800949X. [DOI] [PubMed] [Google Scholar]
- Johnson KP, Seger J. Elevated rates of nonsynonymous substitution in island birds. Mol Biol Evol. 2001;18:874–881. doi: 10.1093/oxfordjournals.molbev.a003869. [DOI] [PubMed] [Google Scholar]
- Johnson ME, Hummer G. Nonspecific binding limits the number of proteins in a cell and shapes their interaction networks. Proc Natl Acad Sci U S A. 2011;108:603–608. doi: 10.1073/pnas.1010954108. [DOI] [PMC free article] [PubMed] [Google Scholar]
- Kimura M. Some problems of stochastic processes in genetics. Ann Math Stat. 1957;28:882–901. [Google Scholar]
- Kimura M. On the probability of fixation of mutant genes in a population. Genetics. 1962;47:713–719. doi: 10.1093/genetics/47.6.713. [DOI] [PMC free article] [PubMed] [Google Scholar]
- Kimura M. Evolutionary rate at the molecular level. Nature. 1968;217:624–626. doi: 10.1038/217624a0. [DOI] [PubMed] [Google Scholar]
- Kimura M. A simple method for estimating evolutionary rate of base substitution through comparative studies of nucleotide sequences. J Mol Evol. 1980;16:111–120. doi: 10.1007/BF01731581. [DOI] [PubMed] [Google Scholar]
- Kimura M. The neutral theory of molecular evolution. Cambridge: Cambridge University Press; 1983. [Google Scholar]
- Kingman JFC. A simple model for the balance between selection and mutation. J Appl Probab. 1978;15:1–12. [Google Scholar]
- Korkegian A, Black ME, Baker D, Stoddard BL. Computational thermostabilization of an enzyme. Science. 2005;308:857–860. doi: 10.1126/science.1107387. [DOI] [PMC free article] [PubMed] [Google Scholar]
- Larracuente AM, et al. Evolution of protein-coding genes in Drosophila. Trends Genet. 2008;24:114–123. doi: 10.1016/j.tig.2007.12.001. [DOI] [PubMed] [Google Scholar]
- Levy ED, De S, Teichmann SA. Cellular crowding imposes global constraints on the chemistry and evolution of proteomes. Proc Natl Acad Sci U S A. 2012;109:20461–20466. doi: 10.1073/pnas.1209312109. [DOI] [PMC free article] [PubMed] [Google Scholar]
- Lindqvist Y, Johansson E, Kaija H, Vihko P, Schneider G. Three-dimensional structure of a mammalian purple acid phosphatase at 2.2 A resolution with a mu-(hydr)oxo bridged di-iron center. J Mol Biol. 1999;291:135–147. doi: 10.1006/jmbi.1999.2962. [DOI] [PubMed] [Google Scholar]
- Miyazawa S, Jernigan R. Estimation of effective interresidue contact energies from protein crystal structures: quasi-chemical approximation. Macromolecules. 1985;18:534–552. [Google Scholar]
- Moran NA. Accelerated evolution and Muller's rachet in endosymbiotic bacteria. Proc Natl Acad Sci U S A. 1996;93:2873–2878. doi: 10.1073/pnas.93.7.2873. [DOI] [PMC free article] [PubMed] [Google Scholar]
- Ohta T. Slightly deleterious mutant substitutions in evolution. Nature. 1973;246:96–98. doi: 10.1038/246096a0. [DOI] [PubMed] [Google Scholar]
- Ohta T. Extension to the neutral mutation random drift hypothesis. In: Kimura M, editor. Molecular evolution and polymorphism. Mishima (Japan) National Institute of Genetics; 1977. pp. 148–167. [Google Scholar]
- Ohta T. The nearly neutral theory of molecular evolution. Annu Rev Ecol Syst. 1992;23:263–286. [Google Scholar]
- Ohta T. Synonymous and nonsynonymous substitutions in mammalian genes and the nearly neutral theory. J Mol Evol. 1995;40:56–63. doi: 10.1007/BF00166595. [DOI] [PubMed] [Google Scholar]
- Otto SP, Whitlock MC. The probability of fixation in populations of changing size. Genetics. 1997;146:723–733. doi: 10.1093/genetics/146.2.723. [DOI] [PMC free article] [PubMed] [Google Scholar]
- Pollock DD, Thiltgen G, Goldstein RA. Amino acid coevolution induces an evolutionary Stokes shift. Proc Natl Acad Sci U S A. 2012;109:E1352–E1359. doi: 10.1073/pnas.1120084109. [DOI] [PMC free article] [PubMed] [Google Scholar]
- Rispe C, Moran NA. Accumulation of deleterious mutations in endosymbionts: Muller's ratchet with two levels of selection. Am Nat. 2000;156:425–441. doi: 10.1086/303396. [DOI] [PubMed] [Google Scholar]
- Serohijos AW, Rimas Z, Shakhnovich EI. Protein biophysics explains why highly abundant proteins evolve slowly. Cell Rep. 2012;2:249–256. doi: 10.1016/j.celrep.2012.06.022. [DOI] [PMC free article] [PubMed] [Google Scholar]
- Serrano L, Day AG, Fersht AR. Step-wise mutation of barnase to binase—a procedure for engineering increased stability of proteins and an experimental-analysis of the evolution of protein stability. J Mol Biol. 1993;233:305–312. doi: 10.1006/jmbi.1993.1508. [DOI] [PubMed] [Google Scholar]
- Tamuri AU, dos Reis M, Goldstein RA. Estimating the distribution of selection coefficients from phylogenetic data using sitewise mutation-selection models. Genetics. 2012;190:1101–1115. doi: 10.1534/genetics.111.136432. [DOI] [PMC free article] [PubMed] [Google Scholar]
- Tokuriki N, Stricher F, Schymkowitz J, Serrano L, Tawfik DS. The stability effects of protein mutations appear to be universally distributed. J Mol Biol. 2007;369:1318–1332. doi: 10.1016/j.jmb.2007.03.069. [DOI] [PubMed] [Google Scholar]
- Van den Burg B, Vriend G, Veltman OR, Eijsink VGH. Engineering an enzyme to resist boiling. Proc Natl Acad Sci U S A. 1998;95:2056–2060. doi: 10.1073/pnas.95.5.2056. [DOI] [PMC free article] [PubMed] [Google Scholar]
- Wang Z, Moult J. SNPs, protein structure, and disease. Hum Mutat. 2001;17:263–270. doi: 10.1002/humu.22. [DOI] [PubMed] [Google Scholar]
- Weinreich DM. The rates of molecular evolution in rodent and primate mitochondrial DNA. J Mol Evol. 2001;52:40–50. doi: 10.1007/s002390010132. [DOI] [PubMed] [Google Scholar]
- Williams PD, Pollock DD, Blackburne BP, Goldstein RA. Assessing the accuracy of ancestral protein reconstruction methods. PLoS Comput Biol. 2006;2:e69. doi: 10.1371/journal.pcbi.0020069. [DOI] [PMC free article] [PubMed] [Google Scholar]
- Woolfit M, Bromham L. Increased rates of sequence evolution in endosymbiotic bacteria and fungi with small effective population sizes. Mol Biol Evol. 2003;20:1545–1555. doi: 10.1093/molbev/msg167. [DOI] [PubMed] [Google Scholar]
- Woolfit M, Bromham L. Population size and molecular evolution on islands. Proc Biol Sci. 2005;272:2277–2282. doi: 10.1098/rspb.2005.3217. [DOI] [PMC free article] [PubMed] [Google Scholar]
- Wright PE, Dyson HJ. Intrinsically unstructured proteins: re-assessing the protein structure-function paradigm. J Mol Biol. 1999;293:321–331. doi: 10.1006/jmbi.1999.3110. [DOI] [PubMed] [Google Scholar]
- Wright SD, Gillman LN, Ross HA, Keeling DJ. Slower tempo of microevolution in island birds: implications for conservation biology. Evolution. 2009;63:2275–2287. doi: 10.1111/j.1558-5646.2009.00717.x. [DOI] [PubMed] [Google Scholar]
- Wu CI, Li WH. Evidence for higher rates of nucleotide substitution in rodents than in man. Proc Natl Acad Sci U S A. 1985;82:1741–1745. doi: 10.1073/pnas.82.6.1741. [DOI] [PMC free article] [PubMed] [Google Scholar]
- Wyckoff GJ, Li J, Wu CI. Molecular evolution of functional genes on the mammalian Y chromosome. Mol Biol Evol. 2002;19:1633–1636. doi: 10.1093/oxfordjournals.molbev.a004226. [DOI] [PubMed] [Google Scholar]
- Wylie CS, Shakhnovich EI. A biophysical protein folding model accounts for most mutational fitness effects in viruses. Proc Natl Acad Sci U S A. 2011;108:9916–9921. doi: 10.1073/pnas.1017572108. [DOI] [PMC free article] [PubMed] [Google Scholar]
- Yang JR, Liao BY, Zhuang SM, Zhang J. Protein misinteraction avoidance causes highly expressed proteins to evolve slowly. Proc Natl Acad Sci U S A. 2012;109:E831–E840. doi: 10.1073/pnas.1117408109. [DOI] [PMC free article] [PubMed] [Google Scholar]
- Zeldovich KB, Chen P, Shakhnovich EI. Protein stability imposes limits on organism complexity and speed of molecular evolution. Proc Natl Acad Sci U S A. 2007;104:16152–16157. doi: 10.1073/pnas.0705366104. [DOI] [PMC free article] [PubMed] [Google Scholar]
- Zhang J, Maslov S, Shakhnovich EI. Constraints imposed by non-functional protein-protein interactions on gene expression and proteome size. Mol Syst Biol. 2008;4:210. doi: 10.1038/msb.2008.48. [DOI] [PMC free article] [PubMed] [Google Scholar]
- Zhao HM, Arnold FH. Directed evolution converts subtilisin E into a functional equivalent of thermitase. Protein Eng. 1999;12:47–53. doi: 10.1093/protein/12.1.47. [DOI] [PubMed] [Google Scholar]
- Zuckerkandl E. Evolutionary processes and evolutionary noise at the molecular level. I. Functional density in proteins. J Mol Evol. 1976;7:167–183. doi: 10.1007/BF01731487. [DOI] [PubMed] [Google Scholar]