

Abstract
Understanding cellular interactions and entry pathways of synthetic biomaterials are highly important to improve overall labeling and delivery efficiency. Conjugated polymer nanoparticles (CPNs) are emerging, fluorescent materials that have been used for cancer cell labeling and small interfering RNA (siRNA) delivery. In this contribution, detailed biophysical properties of CPNs including entry mechanisms and subcellular localization were studied using fluorescent-based techniques. While CPNs cause no toxicity, decreased CPN uptake was observed from cancer cells pretreated with genistein, which is an inhibitor of caveolae-mediated endocytosis (CvME). CvME was further confirmed by high co-localization with caveolin-1 proteins, which are found in the caveolae and caveosomes. Excellent photophysical properties, non-toxicity, and non-destructive delivery pathways support that CPNs are promising multifunctional carriers minimizing degradation of contents during delivery.
Keywords: conjugated polymer, conjugated polyelectrolyte, conjugated polymer nanoparticle, endocytosis mechanism, small interfering RNA delivery
Introduction
Polymeric nanocarriers have received significant attentions for intracellular sensing,[1] labeling,[2] and delivery.[3] Toxicity and cellular entry pathways of the carriers significantly influence their performance. Because the cell surface contains negatively charged heparin sulfate proteoglycans and hydrophobic membrane lipids, the positively charged hydrophobic carriers are highly advantageous for interaction with cells and subsequent cellular entry.[4] Especially, carriers with high surface-to-volume ratios exhibit size, shape, and functional group-dependent cellular interactions, resulting in dramatically changed uptake paths and localizations.[5] Although endocytosis is a significant uptake mechanism in mammalian cells, the efficiency of drugs or genes will be reduced if the carrier mainly uses endosomes for entry (i.e., clathrin-mediated endocytosis, CME), because the contents in endosomes will be recycled back to extracellular environments and be degraded in acidic lysosomes.[6] Other endocytosis mechanisms such as caveolae-mediated endocytosis (CvME) and macropinocytosis are known to avoid the lysosomal degradation processes.[7] Therefore, understanding and modulating cellular entry pathways of the carriers is crucial for successful intracellular applications.
Recently, we have demonstrated that conjugated polymer nanoparticles (CPNs) fabricated from conjugated polymers (CPs) containing both hydrophobic backbones and primary amine-containing hydrophilic side chains have core-shell-like aggregation structures in water,[8] and exhibit efficient small interfering RNA (siRNA) delivery with fluorescent visualization function.[3f, 3g] Although the CPNs delivered biologically active siRNA into both plant and animal cells, and significant down-regulation of the target genes was observed without measurable toxic effects, little is known about the cellular entry kinetics and pathways, which are essential for designing novel gene or drug carriers. In this contribution, we present the CPNs’ cellular interactions and entry pathways using fluorescent-based techniques including flow cytometry and microscopic imaging. Various pharmacological inhibitors of endocytic pathways were initially used to screen entry pathways and the specific pathway was further confirmed by immunostaining. CPNs enter human cervical cancer (HeLa) cells via both energy dependent and independent pathways. Among the energy dependent pathways, CPNs use the CvME as a main route for entry, confirmed by entry inhibition from genistein pretreated cells and co-localization with an antibody specific to caveloin-1 proteins in caveosomes. CPNs are emerging carriers capable for simultaneous fluorescent labeling of target cancer cells and non-destructive delivery of drugs or genes.
Experimental Section
General
All chemicals and solvents were purchased from Fisher Scientific and used as received. Pharmacological endocytosis inhibitors such as chlorpromazine hydrochloride (Assay Designs, Inc), genistein (Acros Organics), methyl-β-cyclodextrin (Acros Organics), LY2994002 (Caymen Chemical), and cytochalasin D (Assay Designs, Inc) were purchased from Fisher Scientific. Deuterium oxide (D2O) was purchased from Cambridge Isotope Laboratories (Cambridge, MA). Molecular weight was determined by gel permeation chromatography (GPC) using polystyrene standards on a Shimadzu HPLC system equipped with PLgel 5μm MIXED-D columns. The purification of the CPN was conducted using an Ultrafiltration Stirred Cell (Millipore) with a 10kDa molecular weight cut-off (MWCO) membrane (Ultracel ultrafiltration disc). Lyophilization of the sample was performed using a Labconco FreeZone 2.5 L freeze dry system. Nuclear magnetic resonance (NMR) spectrum was recorded on a 600 MHz Avance Bruker NMR spectrometer using a 5 mm BBI probe at 298 K.
Fabrication of CPNs
In a 50 mL Schlenk flask, compound 1 (15.0 mg, 0.0279 mmol), compound 2 (20.1 mg, 0.0273 mmol), Pd(PPh3)2Cl2 (1.90 mg, 0.00271 mmol), and CuI (0.26 mg, 0.00137 mmol) were combined under nitrogen (Scheme 1). An approximately 1.5 mL of degassed mixed solvent of DMF and morpholine (3:1=v:v) was added to the reaction flask. The mixture was allowed to stir for one day at 60°C, and then cooled to room temperature. A small portion of reaction solution was diluted in THF solution for GPC measurement and the number average molecular weight was determined to be ~18,000 g/mol with polydispersity index of 1.9. To deprotect N-Boc (i.e., t-butyl carbamate) groups, 1 mL of trifluoroacetic acid was added to the polymer solution and the resulting solution was allowed to stir for one day. After adding 10 mL of glacial acetic acid, the solution was stirred for one hour. The polymer solution was then added drop wise to 500 mL of deionized water and allowed to stir for 10 m. The aqueous solution was concentrated and dialyzed using 2 L of water. After dialysis, the solution was concentrated to approximately 10 mL, and filtered using a PTFE syringe filter (0.45 μm).
Scheme 1.

Synthetic scheme of N-Boc protected poly(phenyleneethynylene)
Dynamic light scattering (DLS) and atomic force microscopic (AFM) analyses of CPNs
DLS analyses were performed using a Zetasizer nano–ZS (Zen 3600, Malvern Instruments Ltd.). AFM studies were completed using a Veeco Dimension 3100 system with Nanoscope IIIa controller. AFM imaging experiments were performed in tapping mode with the AFM probe (tip radius of curvature ~10 nm) resonating at 300 kHz. CPNs were drop-casted from suspension onto freshly cleaved mica substrates and vacuum dried for 15 min before imaging.
Cell culture
HeLa cells (Human epithelial carcinoma cell line) purchased from ATCC were cultured in MEM/EBSS medium containing 10 % fetal bovine serum and 1 % penicillin/streptomycin (Thermo Scientific) at 37 °C in a 5 % CO2 incubator.
Toxicity assay
HeLa cells (~10,000 cells/well) in 200 μL of complete medium were seeded into a 96-well plate and cultured for one day in a 5 % CO2 incubator at 37 °C. CPNs with various concentrations (1 to 40 μM) were added and incubated for 24 h. To measure toxicity, 10 μL of WST-1 solution kit (Cayman Chemical, USA) was added into each well, and the plate was further incubated for 2 h, according to the manufacturer’s protocol. After shaking the plate for 5 min, cell viability was monitored by measuring absorbance values of each well at 450 nm using a microplate well reader (Synergy 2, BioTek, USA). Relative cell viability as a function of CPN concentration was obtained by subtracting absorbance values of each sample well with control CPN absorbance at 450 nm. All measurements were triplicated and standard deviation was included in the error bar.
Flow cytometry
To determine trypan blue concentration that quenches fluorescence of CPNs adsorbed on the extracellular membrane, HeLa cells incubated with CPNs were treated with trypan blue (Amresco Inc.) before flow cytometry measurements (Accuri C6, USA). HeLa cells incubated with 20 μM of CPN for 4 h were treated with various amounts of trypan blue for 10 min. After washing with 1xPBS buffer three times, cells were detached by trypsin/EDTA and fixed with 4 % paraformaldehyde. Relative mean fluorescent intensity was decreased by ~50 % when 200 μM of trypan blue was used, indicating that the extracellular membrane adsorbed CPNs can be completely quenched above the trypan blue concentration (Supporting Information). Post-cell treatment with trypan blue was conducted for all flow cytometry analyses for entry kinetics and mechanisms.
Determining IC50 values for inhibitors
HeLa cells (~10,000 cells/well) were seeded into a 96-well plate at 24 h before conducting toxicity assay. Then, pharmacological inhibitors with various concentrations were treated into the cells and incubated for 2 h. For the cell viability test, MTT solution (1 mg/ml) was added into each well and the wells were further incubated for 2 h. Cell viability was plotted against the inhibitor concentration and IC50 values of each inhibitor were calculated by curve fitting using Origin software (Supporting Information).
Inhibition assays
For endocytosis inhibition studies, HeLa cells were seeded into a 6-well plate (~200,000/well) on one day before CPN incubation. After CPN incubation, cells were washed with 1x PBS three times followed by trypan blue treatment (200 μM) for 10 min. The detached cells were fixed with 4 % paraformaldehyde in 1x PBS for 10 min and resuspended in a flow cytometry buffer (1xPBS containing 5 % bovine serum albumin and 0.02 % sodium azide). 10,000 events per measurement were counted and mean fluorescence intensity of CPN (FL1 channel, 518 ~ 548 nm wavelength range) was measured. Averaged mean fluorescent intensity was calculated using four independent sample sets.
Non-energy dependent entry
HeLa cells were incubated with CPNs for 2 h at 4°C and at the ATP depletion condition (i.e., 0.05 % sodium azide and 25 mM 2-deoxyglucose), respectively, and fluorescent intensity of the internalized CPNs (i.e., after quenching of CPNs on the membranes) was measured by flow cytometric analysis. Mean fluorescent intensity from six independent samples was normalized to that of the control sample.
Microscopic imaging
HeLa cells (~40,000/well) were seeded into a glass-bottomed 8-well chamber slide (Lab-Tek, Nunc, USA) with 0.4 ml of complete MEM medium. After 24 h incubation at 37 °C, cells were treated with 20 μM of CPN for 24 h. LysoTracker Red DND-99 (final 200 nM, Molecular probes, USA) was introduced to the cells containing CPNs, and the cells were further incubated for 30 min at 37 °C to stain lysosomal compartments. For the golgi apparatus staining, BODIPY-TR C5-ceramide-BSA complex (final 10 μM, Molecular probes, USA) was incubated for 30 min at 4 °C. After washing with fresh medium, the cells were further incubated for 30 min at 37 °C. Hoechst 33342 (final concentration of 1 μg/ml, Invitrogen, USA) was used for nucleus staining. After washing with 1xPBS three times, cells were fixed with 4 % paraformaldehyde. Fluorescence images of the cells were obtained using a DeltaVison microscope equipped with 60x oil immersion lens. Band-pass filters were used for imaging nucleus (410–460 nm), CPNs (500–550 nm), and LysoTracker Red or BODPY-TR (575–620 nm).
Immunostaining
HeLa cells (~40,000/well) were seeded into a glass-bottomed 8-well chamber slide (Lab-Tek, Nunc, USA) with 0.4 ml of complete MEM medium. After 24 h incubation at 37 °C, cells were treated with 15 μM of CPN for 24 h. After PBS washing, cells were fixed with 4% paraformaldehyde for 10 min followed by permeabilization using Triton X-100 (0.1% in PBS) for 10 min. After blocking cells with 5% BSA for 1 h, cells were incubated with the primary antibody against caveolin-1 (Abcam, Cat# 17052, 1:500) at 4 °C for 24 h. After three times of PBS washing, the cells were further incubated with a secondary antibody (1 μg/ml, Goat polyclonal secondary antibody to Mouse IgG–H&L, Abcam, ab6787) for 2 h at room temperature. Finally cells were rinsed with PBS and treated with Hoechst dye (5 μg/μl) (Invitrogen, H21492) for 10 min for nuclear staining.
Statistical analysis
CPN uptakes under the various inhibitory conditions were evaluated by flow cytometric analysis and the mean values with standard deviation (SD) from at least three independent experiments were presented. One-way analysis of variance (ANOVA) using Origin Pro8 (Northampton, MA) was used for statistical analysis and the threshold values for statistical significance was set for p < 0.05.
Results and Discussion
Characterization of CPN
Positively charged CPNs were fabricated as previously reported[8] with a slight modification and used for cellular entry and toxicity studies.[9] t-Butyl carbamate (N-Boc) protected poly(phenyleneethynylene) (PPE) was synthesized under the palladium/copper cross-coupling reaction to measure molecular weight using GPC. Since the primary amine-containing PPE has insolubility in water and strong affinity toward most gel columns, molecular weight determination using GPC (or size exclusion chromatography in an aqueous solution) was extremely difficult. To avoid these issues, the primary amines were converted to N-Boc groups to increase organic solubility of the resulting PPE so that molecular weight can be determined by conventional GPC analysis in tetrahydrofuran (THF). N-Boc groups were converted to primary amines using trifluoroacetic acid treatment. 1H NMR spectroscopic analysis indicates that CPNs exhibit characteristic aggregation features: a very broad aromatic backbone peak and poorly resolved proton peaks for side chains (Supporting Information). The CPNs exhibited characteristic absorption and emission maxima of the aggregated conjugated backbones around ~ 450 nm and ~500 nm, respectively.
Determination of the hydrodynamic radius of CPNs at the concentration used for cellular studies (<20 μM) was not successful due to the weak scattering intensity from the loosely aggregated CPNs. Therefore, the size and shape of the CPNs at the low concentration were investigated by atomic force microscopy (AFM). Although drop casting and drying CPNs on a freshly cut mica surface will likely change the shape of CPNs due to the soft and loose aggregation nature, AFM analysis provides information on size, morphology, and softness of CPNs. As shown in Figure 1, CPNs on mica surface are flattened (i.e., pancake-like particles) with lateral diameter of ~61.5± 19.5 nm and height of 1.8±1.0 nm, and were distorted by the AFM tip. We assume that the soft particles with high void volume experienced flattening during the sample preparation and AFM imaging processes. Similar AFM images were obtained from the CPNs fabricated with different batches, implying that the CPN formation is not molecular weight dependent, but is driven by insolubility of polymers (i.e., phase-inverse precipitation mechanism).[8] Zeta potential of CPNs in water at neutral pH was ~+53 ±10 mV.
Figure 1.
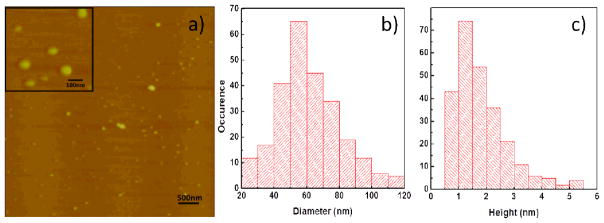
Atomic force microscopic images of CPNs (inset: image taken at higher magnification) on a freshly-cut mica surface (a), a lateral size analysis histogram (b), and a height histogram (c).
Cellular toxicity of CPNs
Metabolic activities of live cells incubated with CPNs were measured by using a WST-1 assay, which uses water-soluble tetrazolium salts. As shown in Figure 2(a), CPNs cause no toxicity under the various incubation conditions. We also confirmed that CPNs are nontoxic based on other assays including a luminescent cell viability assay.[9b]
Figure 2.

Cellular toxicity of CPNs determined by WST-1 assay (a) and cellular entry kinetics of CPNs after 2 h incubation (b). Trypan blue treatment reduces fluorescence intensity [before (■) and after (○)] by quenching CPNs adsorbed on extracellular membranes.
Cellular entry kinetics
Cellular entry kinetics was measured by flow cytometry as a function of CPN concentrations [Figure 2(b)]. Because CPNs interact with the amphiphilic cellular membranes, trypan blue (a diazo dye widely used for dead cell staining) was post-incubated to quench the fluorescence of the CPNs adsorbed on the extracellular membranes. After quenching the adsorbed CPNs, fluorescent signals were decreased to nearly half of the total fluorescent signals, indicating CPNs interact strongly with HeLa cells followed by internalization. The fluorescent intensity of the HeLa cells increased as both concentration and incubation time (Supporting Information) increased. Within 2 h of incubation, the CPNs were taken up by HeLa cells significantly, and the uptakes started to saturate above ~ 40 μM of CPNs, implying that cellular entry pathways of HeLa cells may be depleted by CPNs above the concentration.
Non-energy dependent entry
Endocytosis is an energy-dependent cellular uptake process in which cells eat (phagocytosis) or drink (pinocytosis) extracellular nutrients and macromolecules.[6a, 10] Therefore, lowering incubation temperature or using metabolic inhibitors to deplete adenosine triphosphate (ATP) will decrease endocytosis dramatically. Figure 3(a) clearly indicates that some proportions (~30%) of CPNs entered the HeLa cells through the non-energy dependent pathways. Although the exact mechanism is uncertain, we assume that the amphiphilicity of CPNs was responsible similar to the way amphiphilic cell penetrating peptides mediate the delivery of small drugs, nucleic acids, and proteins via both energy dependent and independent pathways.[11]
Figure 3.
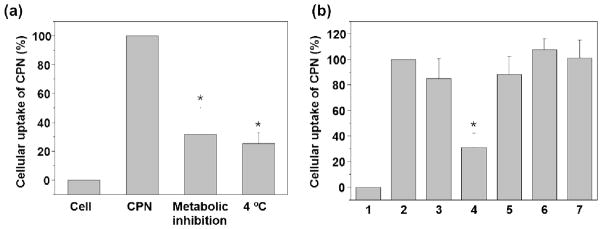
Energy independent cellular entry of CPNs (a) and endocytosis inhibition of CPNs (20 μM) by pharmacological inhibitors (b). The relative amount of CPNs in HeLa cells in the absence (2) and presence (3–7) of pharmacological inhibitors. (1) HeLa cell control, (2) CPNs only, (3) chlorpromazine (CME inhibitor, 24 μM), (4) genistein (CvME inhibitor, 210μM), (5) methyl-β-cyclodextrin (Caveolae or macropinocytosis inhibitor, 1000 μM), (6) LY294002 (macropinocytosis inhibitor, 120 μM), and (7) cytochalasin D (macropinocytosis inhibitor, 0.04 μM). CPN uptake was significantly inhibited by genistein treatment, implying that CPNs’ entry is related to CvME. CPNs use both energy dependent and independent pathways to enter cells. Error bar represents standard deviation [n=6 for (a) and n=4 for (b)].*p < 0.05.
Endocytosis of CPNs
Significant internalization reduction under the ATP depletion and at the low temperature condition indicates that the main entry pathway of CPNs to HeLa cells is energy dependent endocytosis. The entry mechanism for various synthetic polymers has been reported as endocytosis through initial interaction of positively charged polymers with the negatively charged cellular membrane.[6b, 10, 12] Among endocytosis mechanisms, CME can be distinguished by inhibition under a potassium depletion condition or by treating cells with a pharmacological inhibitor such as chlorpromazine, which specifically inhibits the pit formation by dissociating clathrin lattices. Filipin, nystatin, and methyl-β-cyclodextrin specifically bind, sequester, or deplete cholesterol, which is involved in the CvME. As a tyrosine kinase inhibitor, genistein also blocks CvME.23 Cytochalasin D causes actin depolymerization in the cytoskeleton, resulting in involvement in both the CvME and macropinocytosis.23 Bulk amounts of macromolecules can be taken up by cells via macropinocytosis, which involves cell surface ruffling. Since actin cytoskeletons affect the membrane ruffling, drugs (e.g., amiloride and its derivatives) that disrupt the function of the actin cytoskeleton can inhibit macropinocytosis. Phosphatidyl inositol-3-phosphate inhibitor, LY294002 is often used for testing macropinocytosis.23
To HeLa cells pretreated with pharmacological inhibitors at the desired concentrations, CPNs (20 μM) were introduced and incubated for 2 h before flow cytometric analysis. Because the inhibitors often cause toxic effects to cells and the inhibitory efficiency is highly cell-type dependent, we conducted a toxicity assay to determine inhibitor concentrations for the mechanistic studies (Supporting Information).[12] The inhibitor concentrations used for the mechanistic studies are known to inhibit cellular entry of well-characterized transferrin (by chlorpromazine) and lactosylceramide (by genistein) by 80–100%.[13] Mean fluorescence intensity of HeLa cells incubated with both inhibitors and CPNs was normalized to the control cells incubated with only CPNs. As shown in Figure 3(b), a significant fluorescence decrease (~60%) was observed from genistein-pretreated cells, while a moderate decrease (~10%) was observed from the cells treated with chlorpromazine and methyl-β-cyclodextrin. From the observation, we conclude that the CPNs’ main entry pathway is closely related to the CvME involving tyrosine kinases. Other inhibitors such as methyl-β-cyclodextrin (depleting cholesterol) and cytochalasin D (actin de-polymerization) influence CPNs entry moderately and little, respectively. It is not clear why CPNs use the CvME, we cautiously assume that the amphiphilic CPNs interact with various serum proteins and the CPN/protein adducts may enter the cells via caveolae-related processes (i.e., piggy back endocytosis).[6a] It is noteworthy that the positively charged amphiphilic CPNs exhibit different cellular interaction and entry behaviors from the neutral and hydrophobic conjugated polymer dots (CP dots) fabricated by re-precipitation of hydrophobic semiconducting polymers in a mixed solvent of THF and water. Fernando et al. reported that the hydrophobic CP dots were taken up by macrophage-like cells via macropinocytosis (i.e., cell drinking extracellular fluidics containing CP dots) as a main route and exhibit little cell surface adsorption or binding.[14]
Microscopic imaging
Fluorescence microscopic images of HeLa cells incubated with CPNs in the absence [Figure 4(a)] and presence [Figure 4(b)] of genistein also clearly demonstrated that the CPN internalization (seen as green dots) was inhibited by the genistein treatment. While CPNs accumulated throughout the cells including cytosolic compartments in the absence of inhibitors, CPN internalization was significantly blocked, and CPNs were mainly adsorbed on the extracellular membranes when the cells were pretreated with the inhibitor. Colocalization of CPNs with organelle-specific dyes such as a BODIPY-TR C5-ceramide-BSA (a golgi specific dye) and LysoTracker Red (a lysosome specific dye) was conducted to further investigate the entry mechanism of CPNs.[15] As shown in Figure 5, yellow spots were observed from HeLa cells incubated with CPNs for 24 h followed by staining with lysosomes [Figure 5(a)] and golgi apparatus [Figure 5(b)] specific dyes. Colocalization of CPN with the golgi specific dye supports the CvME of CPNs. As seen in Figure 5(b), however, CPNs were also found at lysosomes, implying that CPNs also use other entry pathways.
Figure 4.

Fluorescence microscopic images of HeLa cell incubated with CPNs in the presence (a) and absence (b) of genistein. Nucleus stained with a blue dye and CPNs were seen as green dots. CPN uptake was decreased when the cells pretreated with genistein. Scale bar: 10 μm.
Figure 5.

Colocalization (appeared as yellow spots in the merged images) of CPNs with (a) LysoTracker Red DND for lysosomes and (b) BODIPY-TR C5-ceramide-BSA complex for golgi staining, respectively, in Hela cells after 24 h CPN incubation.
Colocalization with caveolin-1
Caveolins are found in the caveolae, trans-golgi network, and caveosomes.[15] Therefore, colocalization of CPNs with caveolin provides a strong evidence for CvME mechanism. After incubation with CPNs for 24 h, the cells were treated with an antibody specific to caveolin-1 followed by incubating with secondary antibody to conduct fluorescence colocalization studies. As shown in Figure 6, CPNs (green) overlap well with caveloin-1 (red) appeared as either yellow or orange dots throughout the cytoplasm, indicating that CPNs were mainly taken up by the caveolin-containing organelles.
Figure 6.

Fluorescence microscopic images of HeLa cells incubated with CPNs (green) for 24 h followed by immunostaining with caveolin-1 antibodies (red). CPNs overlap with caveolin-1 throughout cytoplasm. Nucleus was stained with a blue dye.
Conclusion
We revealed that the primary amine-containing, positively charged CPNs were mainly taken up by HeLa cell via CvME, while some proportions of CPNs enter the cells using non-energy dependent entry mechanisms. Understanding and modulating entry pathways of CPNs are highly important to improving drug/gene delivery efficiency of the newly developed carriers with fluorescence sensing and imaging capabilities. Further investigation on the functional group, molecular weight, and size dependent entry mechanism is underway.
Supplementary Material
Acknowledgments
The authors acknowledge the generous funding from NIH/NIGMS SC1 (092778-01A1). The authors would also thank Ms. Yoonmi Na and Mr. Eladio Mendez for the preparation of microscopic imaging samples.
Footnotes
Supporting Information is available at Wiley Online Library or from the author. ((Other reference to the authors can also appear here, such as Author-One and Author-Two contributed equally to this work.))
Contributor Information
Dr. Junghan Lee, Department of Chemistry, Florida International University, 11200 SW 8thSt., Miami, FL 33199, USA
Ms. Megan Twomey, Department of Chemistry, Florida International University, 11200 SW 8thSt., Miami, FL 33199, USA
Mr. Christian Machado, Department of Chemistry, Florida International University, 11200 SW 8thSt., Miami, FL 33199, USA
Ms. Giselle Gomez, Department of Chemistry, Florida International University, 11200 SW 8thSt., Miami, FL 33199, USA
Ms. Mona Doshi, NanoScience Technology Center, Department of Chemistry and CREOL, The College of Optics and Photonic, University of Central Florida, Research Pavilion 4th Floor, Research, Parkway Suite 400 Orlando, FL 32826, USA
Prof. Andre. J. Gesquiere, NanoScience Technology Center, Department of Chemistry and CREOL, The College of Optics and Photonic, University of Central Florida, Research Pavilion 4th Floor, Research, Parkway Suite 400 Orlando, FL 32826, USA
Prof. Joong Ho Moon, Email: jmoon@fiu.edu, Department of Chemistry, Florida International University, 11200 SW 8thSt., Miami, FL 33199, USA
References
- 1.a) Napp J, Behnke T, Fischer L, Wurth C, Wottawa M, Katschinski DM, Alves F, Resch-Genger U, Schaferling M. Anal Chem. 2011;83:9039–9046. doi: 10.1021/ac201870b. [DOI] [PubMed] [Google Scholar]; b) Ye FM, Wu CF, Jin YH, Chan YH, Zhang XJ, Chiu DT. J Am Chem Soc. 2011;133:8146–8149. doi: 10.1021/ja202945g. [DOI] [PMC free article] [PubMed] [Google Scholar]; c) Kim JH, Lee S, Park K, Nam HY, Jang SY, Youn I, Kim K, Jeon H, Park RW, Kim IS, Choi K, Kwon IC. Angew Chem Int Ed. 2007;46:5779–5782. doi: 10.1002/anie.200700767. [DOI] [PubMed] [Google Scholar]
- 2.a) Zhang XJ, Yu JB, Wu CF, Jin YH, Rang Y, Ye FM, Chiu DT. ACS Nano. 2012;6:5429–5439. doi: 10.1021/nn301308w. [DOI] [PMC free article] [PubMed] [Google Scholar]; b) Yu JB, Wu CF, Zhang XJ, Ye FM, Gallina ME, Rong Y, Wu IC, Sun W, Chan YH, Chiu DT. Adv Mater. 2012;24:3498–3504. doi: 10.1002/adma.201201245. [DOI] [PMC free article] [PubMed] [Google Scholar]
- 3.a) Lynn DM, Langer R. J Am Chem Soc. 2000;122:10761–10768. [Google Scholar]; b) Choi JS, Nam K, Park J, Kim JB, Lee JK, Park J. J Control Release. 2004;99:445–456. doi: 10.1016/j.jconrel.2004.07.027. [DOI] [PubMed] [Google Scholar]; c) Pun SH, Bellocq NC, Liu AJ, Jensen G, Machemer T, Quijano E, Schluep T, Wen SF, Engler H, Heidel J, Davis ME. Bioconjugate Chem. 2004;15:831–840. doi: 10.1021/bc049891g. [DOI] [PubMed] [Google Scholar]; d) Srinivasachari S, Fichter KM, Reineke TM. J Am Chem Soc. 2008;130:4618–4627. doi: 10.1021/ja074597v. [DOI] [PubMed] [Google Scholar]; e) Ornelas-Megiatto C, Wich PR, Frechet JMJ. J Am Chem Soc. 2012;134:1902–1905. doi: 10.1021/ja207366k. [DOI] [PubMed] [Google Scholar]; f) Silva AT, Alien N, Ye CM, Verchot J, Moon JH. BMC PlantBiol. 2010;10:291. doi: 10.1186/1471-2229-10-291. [DOI] [PMC free article] [PubMed] [Google Scholar]; g) Moon JH, Mendez E, Kim Y, Kaur A. Chem Comm. 2011;47:8370–8372. doi: 10.1039/c1cc10991j. [DOI] [PubMed] [Google Scholar]
- 4.Nel AE, Madler L, Velegol D, Xia T, Hoek EMV, Somasundaran P, Klaessig F, Castranova V, Thompson M. Nat Mater. 2009;8:543–557. doi: 10.1038/nmat2442. [DOI] [PubMed] [Google Scholar]
- 5.Tan SJ, Jana NR, Gao SJ, Patra PK, Ying JY. Chem Mater. 2010;22:2239–2247. [Google Scholar]
- 6.a) Duncan R, Richardson SCW. Mol Pharmaceutics. 2012;9:2380–2402. doi: 10.1021/mp300293n. [DOI] [PubMed] [Google Scholar]; b) Khalil IA, Kogure K, Akita H, Harashima H. Pharmacol Rev. 2006;58:32–45. doi: 10.1124/pr.58.1.8. [DOI] [PubMed] [Google Scholar]
- 7.Lacerda L, Pastorin G, Gathercole D, Buddle J, Prato M, Bianco A, Kostarelos K. Adv Mater. 2007;19:1480–1484. [Google Scholar]
- 8.Ko YJ, Mendez E, Moon JH. Macromolecules. 2011;44:5527–5530. doi: 10.1021/ma200661h. [DOI] [PMC free article] [PubMed] [Google Scholar]
- 9.a) Rahim NAA, McDaniel W, Bardon K, Srinivasan S, Vickerman V, So PTC, Moon JH. Adv Mater. 2009;21:3492–3496. [Google Scholar]; b) Moon JH, McDaniel W, MacLean P, Hancock LE. Angew Chem Int Ed. 2007;46:8223–8225. doi: 10.1002/anie.200701991. [DOI] [PubMed] [Google Scholar]
- 10.Sahay G, Alakhova DY, Kabanov AV. J Controlled Release. 2010;145:182–195. doi: 10.1016/j.jconrel.2010.01.036. [DOI] [PMC free article] [PubMed] [Google Scholar]
- 11.Nakase I, Akita H, Kogure K, Graslund A, Langel U, Harashima H, Futaki S. Acc Chem Res. 2012;45:1132–1139. doi: 10.1021/ar200256e. [DOI] [PubMed] [Google Scholar]
- 12.Vercauteren D, Vandenbroucke RE, Jones AT, Rejman J, Demeester J, De Smedt SC, Sanders NN, Braeckmans K. Mol Therapy. 2010;18:561–569. doi: 10.1038/mt.2009.281. [DOI] [PMC free article] [PubMed] [Google Scholar]
- 13.Rejman J, Bragonzi A, Conese M. Mol Therapy. 2005;12:468–474. doi: 10.1016/j.ymthe.2005.03.038. [DOI] [PubMed] [Google Scholar]
- 14.Fernando LP, Kandel PK, Yu JB, McNeill J, Ackroyd PC, Christensen KA. Biomacromolecules. 2010;11:2675–2682. doi: 10.1021/bm1007103. [DOI] [PMC free article] [PubMed] [Google Scholar]
- 15.Pelkmans L, Helenius A. Traffic. 2002;3:311–320. doi: 10.1034/j.1600-0854.2002.30501.x. [DOI] [PubMed] [Google Scholar]
Associated Data
This section collects any data citations, data availability statements, or supplementary materials included in this article.