Abstract
Voltage-gated ion channels generate action potentials in excitable cells and help set the resting membrane potential in nonexcitable cells like lymphocytes. It has been difficult to investigate what kinds of phospholipids interact with these membrane proteins in their native environments and what functional impacts such interactions create. This problem might be circumvented if we could modify specific lipid types in situ. Using certain voltage-gated K+ (KV) channels heterologously expressed in Xenopus laevis oocytes as a model, our group has shown previously that sphingomyelinase (SMase) D may serve this purpose. SMase D is known to remove the choline group from sphingomyelin, a phospholipid primarily present in the outer leaflet of plasma membranes. This SMase D action lowers the energy required for voltage sensors of a KV channel to enter the activated state, causing a hyperpolarizing shift of the Q-V and G-V curves and thus activating them at more hyperpolarized potentials. Here, we find that this SMase D effect vanishes after removing most of the voltage-sensor paddle sequence, a finding supporting the notion that SMase D modification of sphingomyelin molecules alters these lipids’ interactions with voltage sensors. Then, using SMase D to probe lipid–channel interactions, we find that SMase D not only similarly stimulates voltage-gated Na+ (NaV) and Ca2+ channels but also markedly slows NaV channel inactivation. However, the latter effect is not observed in tested mammalian cells, an observation highlighting the profound impact of the membrane environment on channel function. Finally, we directly demonstrate that SMase D stimulates both native KV1.3 in nonexcitable human T lymphocytes at their typical resting membrane potential and native NaV channels in excitable cells, such that it shifts the action potential threshold in the hyperpolarized direction. These proof-of-concept studies illustrate that the voltage-gated channel activity in both excitable and nonexcitable cells can be tuned by enzymatically modifying lipid head groups.
INTRODUCTION
The activity of voltage-gated Na+ (NaV), Ca2+ (CaV), and K+ (KV) channels underlies the action potential in excitable nerve, muscle, and endocrine cells. KV channels also help set the resting membrane potential in such nonexcitable cells as human lymphocytes where inhibition of KV1.3 channels impairs antigen-stimulated activation of T lymphocytes (Cahalan and Chandy, 2009). However, how voltage-gated channels are tuned in nonexcitable cells remains poorly understood.
Unlike soluble proteins, ion channels are solvated not only by water but also by lipids. Whereas water molecules are chemically homogenous, lipid molecules include many types that differ from each other and could therefore interact with a given channel protein differently. Variation of lipid type at a critical site of a membrane protein may markedly alter the protein’s function. These interactions between a membrane protein and lipid molecules form the physico-chemical basis of lipid-based regulation of membrane protein function. The best example of lipid-based ion channel regulators is phosphatidylinositol 4,5-bisphosphate, a lipid present in the inner leaflet of the membrane bilayer (Huang et al., 1998). Ion channels might then be regulated through metabolic turnover or enzymatic modifications of membrane lipid molecules, manifesting themselves differently in different cell types. Intuitively, such regulation seems more likely to involve relatively minor lipid species. Thus far, channel–lipid interactions in native environments remain poorly understood. For example, there is little experimental information regarding what types of lipids in the outer leaflet of plasma membranes actually interact with native channels in cells. In principle, this information could be obtained by modifying the lipids in situ.
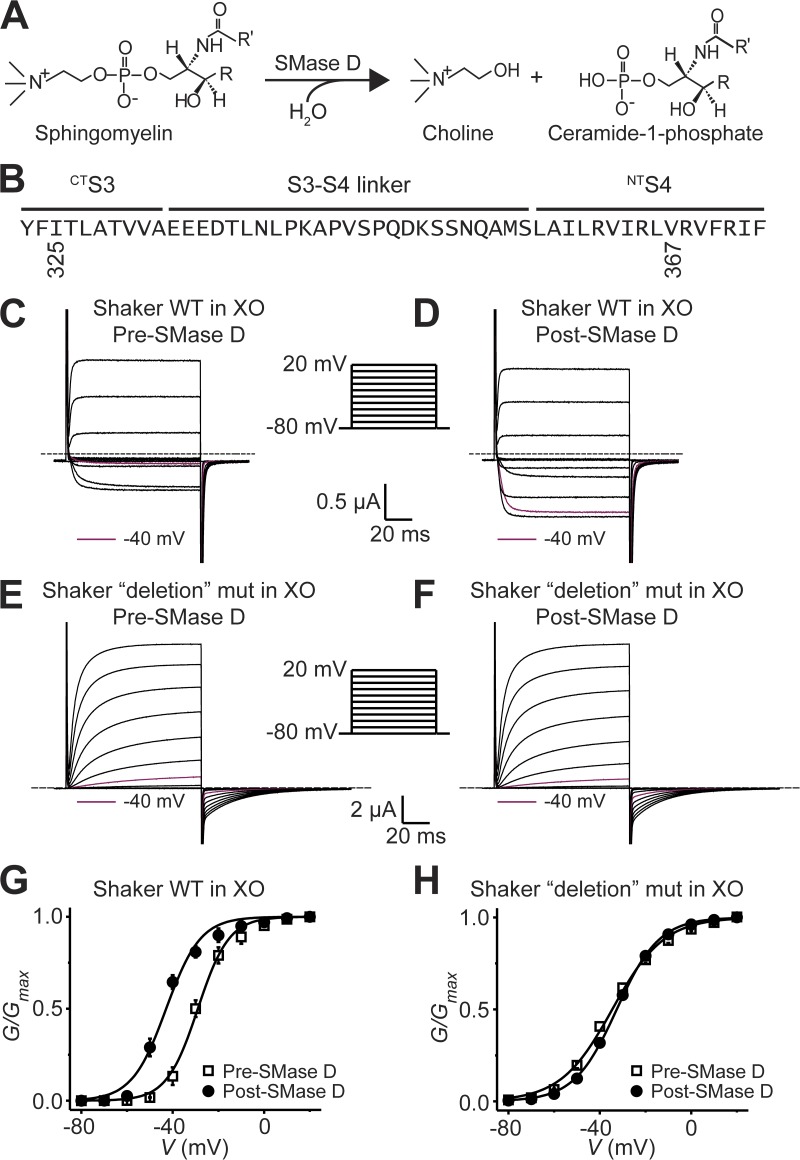
Our group has demonstrated previously in the Xenopus laevis oocyte heterologous expression system that specific lipases, such as sphingomyelinase (SMase) D, can effectively modify lipids in situ (Ramu et al., 2006; Xu et al., 2008). SMase D is the active toxin in brown spider venom and is also produced by bacteria such as Corynebacterium pseudotuberculosis (Tambourgi et al., 2010). SMase D cleaves the positively charged choline moiety from the phosphoryl group of sphingomyelin (Fig. 1 A) (Soucek et al., 1971). In Xenopus oocytes, this removal of choline lowers the energy required to activate the voltage sensors of some but not all tested KV channels (Ramu et al., 2006). Such energy reduction is manifested as a shift of both the channels’ conductance–voltage (G-V) and gating charge–voltage (Q-V) relationships in the hyperpolarized direction. This effect has been hypothesized to reflect SMase D altering interactions between sphingomyelin and the voltage sensor (Ramu et al., 2006; Milescu et al., 2009).
Figure 1.
The extracellular portion of Shaker’s paddle motif is required for SMase D sensitivity. (A) Hydrolysis scheme of sphingomyelin by SMase D. (B) Amino acid sequence of Shaker’s paddle motif. Residues from I325 through V367 were replaced with a glycine triplet in the “deletion” mutant (mut) in E, F, and H. (C–F) Wild-type currents in 100 mM of extracellular K+ ([K+]ext; C and D) and “deletion” mut currents in 20 mM [K]ext (E and F) elicited by stepping membrane voltage of Xenopus oocytes (XO) from the −80-mV holding voltage to between −80 and 20 mV in 10-mV increments at 3-s intervals before (“pre”; C and E) and after (“post”; D and F) SMase D treatment, where for comparison, the current traces at −40 mV are colored maroon. Dashed lines indicate zero current levels. (G and H) G-V curves before (open squares) and after (closed circles) SMase D treatment for wild-type (G) and “deletion” mut (H), where all data are presented as means ± SEM (n = 5). The curves are fits of Boltzmann functions, yielding the midpoint (V1/2) of −29.0 ± 0.6 mV and the apparent valence (Z) of 3.8 ± 0.3 (open squares) or V1/2 = −42.9 ± 0.9 mV and Z = 3.4 ± 0.3 (closed circles) for G, and V1/2 = −34.6 ± 0.5 mV and Z = 2.3 ± 0.1 (open squares) or V1/2 = −32.6 ± 0.2 mV and Z = 2.7 ± 0.1 (closed circles) for H.
With regard to the voltage sensor, crystallographic structures of KV channels have revealed that the N-terminal part of the fourth transmembrane segment (NTS4) harboring voltage-sensing residues, the C-terminal part of the third transmembrane segment (CTS3 or S3b), and their linker form a helix-turn-helix motif called the “voltage-sensor paddle” (Jiang et al., 2003). Electrophysiological and biochemical studies have demonstrated that the paddle does exist in the channel’s open state where CTS3 functions as a “hydrophobic stabilizer” for NTS4, such that formation of the paddle motif helps stabilize the open state (Xu et al., 2013). In the case of the Shaker KV channels, the paddle sequence contains a small (<10 residues) essential core and a much larger (>40 residues) dispensable, modulatory portion (Xu et al., 2010). It can be transferred among different channel types, and channels remain gated by membrane voltage even after deleting any consecutive residue triplets across CTS3 or NTS4 (Alabi et al., 2007; Xu et al., 2010). Therefore, the paddle motif is remarkably flexible, a feature that makes it difficult to use the common point mutation strategy to identify individual paddle residues that interact with lipid molecules.
Here, we performed the following studies. First, we tested a key prediction of the hypothesis that SMase D stimulates KV channels by altering the interaction between sphingomyelin and the voltage sensor. Second, we examined whether SMase D also stimulates NaV and CaV channels. Third, we investigated whether sphingomyelin interacts with native voltage-gated channels in mammalian cells, including nonexcitable lymphocytes, an investigation that in turn addressed whether SMase D can stimulate voltage-gated channels in both excitable and nonexcitable cells.
MATERIALS AND METHODS
Cell cultures, molecular biology, and biochemistry
For oocyte expression, the cDNAs of wild-type and mutant rNaV1.2α, rNaV1.4α, hNaV1.4α, hNaV1.5α, rNaVβ1, and hNaVβ1 were cloned in the pSP64T plasmid, and those of KV1.3 and the Shaker KV channel were cloned in the pGEM-HE plasmid, where r and h denote rat and human variants, respectively (Liman et al., 1992). The inactivation-removed rNaV1.4α-QQQ (rNaV1.4α-IR) mutant and the mutant hNaVα1.4 containing hNaVα1.5’s S5–S6 linkers were constructed as described previously (West et al., 1992a; Vilin et al., 1999). CaV2.1α and CaV2.2α, both from rabbit, and the rat CaVβ1a and rabbit CaVα2-δ subunits were cloned in pGEM-HE. For mammalian cell expression, the cDNAs of hKV1.3 and hNaVβ1 were cloned in the pIRES2-AcGFP plasmid.
The cRNAs were synthesized with T7 or SP6 polymerases using the corresponding linearized cDNAs as templates. Chinese hamster ovary (CHO), Neuro-2A (N2A) or Jurkat (clone E6-1), and human T cells were cultured in F12 Kaighn’s, MEMα, or RPMI-1640 media (Invitrogen) supplemented with 10% FBS (Hyclone) at 37°C with 5% CO2. Before recording, CHO and N2A cells were trypsinized and resuspended in recording solutions. These cell lines were obtained from ATCC, whereas human T cells were from the Penn Immunology Core (Institutional Review Board protocol 705906). For expression of KV1.3 and hNaVβ1, CHO cells were transfected with the Fugene6 (Promega) method 24–48 h before study. Harvested Xenopus oocytes were digested in collagenase-containing solution and then stored in a gentamicin-containing solution at 18°C (Spassova and Lu, 1998).
Recombinant SMase D from Loxosceles reclusa (LrSMase D) or C. pseudotuberculosis (CpSMase D) used in the studies was generated as described previously (Ramu et al., 2006, 2007). These two orthologues were shown previously to stimulate KV channels similarly (Ramu et al., 2006; Xu et al., 2008).
Electrophysiological recordings
Channel currents from whole oocytes, previously injected with the corresponding cRNA, were recorded using a two-electrode voltage-clamp amplifier (OC-725C; Warner). They were filtered at 5 kHz and sampled at 50 kHz with an analogue-to-digital converter (Digidata 1322A; Molecular Devices) interfaced to a PC. pClamp 8 (Molecular Devices) was used for amplifier control and data acquisition. The resistance of electrodes filled with 3 M KCl was ∼0.2 MΩ. NaV currents were isolated using a P/6 protocol. Steady-state inactivation curves were obtained using a double-pulse protocol, where a 50-ms first pulse from the −120-mV holding potential to between −85 and 10 mV was followed by a 50-ms second test pulse to −20 mV. Bath solutions contained (mM): for Shaker currents, 80 or 0 NaCl, 20 or 100 KCl, 0.3 CaCl2, 1 MgCl2, and 10 HEPES, pH 7.60 adjusted with NaOH; for KV1.3 currents, 80 NaCl, 20 KCl, 1 MgCl2, and 10 HEPES, pH adjusted to 7.60 with NaOH; for NaV currents, 100 Na+ (90 glutamic acid and 10 Cl−), 0.3 CaCl2, 1 MgCl2, and 10 HEPES, pH 7.60 adjusted with NaOH; for CaV currents, 10 BaCl2, 20 NaCl, 5 KCl, 60 TEA hydroxide, 1 MgCl2, and 5 HEPES, pH 7.60 adjusted with methanesulfonic acid. To test the effect of SMase D, 200 ng LrSMase D was manually added to a 100-µl bath for a final concentration of 2 ng/µl.
Channel currents from cell lines or human T cells, which were filtered at 5 kHz and sampled at 50 kHz using a Digidata 1322 interfaced to a PC, were recorded in the whole cell configuration with a patch-clamp amplifier (Axopatch 200B). pClamp 10 (Molecular Devices) was used for amplifier control and data acquisition. Electrodes were fire-polished (2–4 MΩ) and coated with beeswax. Capacitance and series resistance were electronically compensated. NaV currents were isolated using a P/4 protocol. In all whole cell recordings, the membrane potential was held at −100 mV. For all KV1.3 studies, recordings were made 5 min after establishing the whole cell configuration to obtain steady currents. To examine the voltage dependence of the deactivation kinetics of Kv1.3 channels expressed in CHO cells, the membrane potential was stepped from the −100-mV holding potential to a first pulse at 0 mV, followed by a second pulse to test potentials between −120 and −50 mV. Steady-state inactivation curves were obtained using a double-pulse protocol, where a 20-ms (CHO) or 300-ms (N2A) first pulse to between −100 and 20 mV (CHO) or −120 and 0 mV (N2A) was followed by a 10-ms (CHO) or 50-ms (N2A) second test pulse to 0 mV. In the study of NaV channels in N2A cells, 250-ms prepulses to −120 mV were used to minimize the confounding effect of potential steady-state inactivation. For KV channel recordings, the bath solution contained (mM) 145 or 130 NaCl, 5 or 20 KCl, 0.3 CaCl2, 1 MgCl2, and 10 HEPES, pH 7.30 adjusted with NaOH, and the electrode solution contained (mM) 140 KCl, 10 EGTA, 1 CaCl2, 1 MgCl2, and 10 HEPES, pH 7.30 adjusted with KOH. For NaV channel recordings, the bath solution contained (mM) 145 NaCl, 5 KCl, 0.3 CaCl2, 1 MgCl2, and 10 HEPES, pH 7.30 adjusted with NaOH, and the electrode solution contained (mM) 140 CsCl, 10 EGTA, 1 CaCl2, 1 MgCl2, and 10 HEPES, pH 7.30 adjusted with CsOH. For current-clamp experiments, constant currents (−3 to −30 pA) were injected to maintain a holding potential negative to −90 mV. Several series of 15–30 current pulses ranging from 100 to 1,000 pA (in 10–50-pA increments) were injected into individual cells for 2 ms to assess the action potential threshold. In these studies, the bath solution contained (mM) 145 NaCl, 5 KCl, 0.3 CaCl2, 1 MgCl2, and 10 HEPES, pH 7.30 adjusted with NaOH, and the electrode contained (mM) 110 K-gluconate, 20 KCl, 5 NaCl, 3 EGTA, 0.3 CaCl2, 1 MgCl2, and 10 HEPES, pH 7.30 adjusted with KOH. To test the effect of SMase D, 300 ng CpSMase D was manually added to the 600-µl recording chamber to achieve a final concentration of 0.5 ng/µl. A paired sample t test was used to determine the statistical significance of the changes both in the action potential threshold and in the amount of injected current required to depolarize the membrane potential to threshold before and after SMase D treatment.
RESULTS
Removal of the extracellular portion of the voltage-sensor paddle eliminates the SMase D sensitivity of Shaker KV channels
If SMase D stimulates KV channels by altering the interaction between sphingomyelin and the voltage sensor to promote the open state, removing most of the voltage-sensor paddle sequence should attenuate or eliminate the SMase D sensitivity. To test this prediction, we used a Shaker mutant in which 43 (I325-V367) of the 49 residues in the paddle sequence were replaced by three glycine residues (Fig. 1 B) (Xu et al., 2010). Like the wild type, this “deletion” mutant expresses voltage-gated current (Fig. 1, C and E). The midpoint of its G-V curve (constructed from the tail currents) is comparable to that of the wild type, but the slope is reduced because it has fewer voltage-sensing residues (Fig. 1, G and H). As expected, before SMase D treatment, stepping the membrane potential from the holding potential to −40 mV elicited essentially no visible wild-type Shaker current, whereas after SMase D treatment, the same voltage step elicited sizable current (Fig. 1, C and D). In contrast, the deletion mutant conducted comparably small currents at −40 mV before or after the SMase D treatment (Fig. 1, E and F). Effectively, SMase D shifted the G-V curve of the wild-type channels in the hyperpolarized direction but had little effect on that of the deletion mutant (Fig. 1, G and H). These results demonstrate the dependence of SMase D sensitivity on the paddle motif.
SMase D stimulates both heterologously expressed KV1.3 channels in CHO cells and native KV1.3 channels in human T lymphocytes
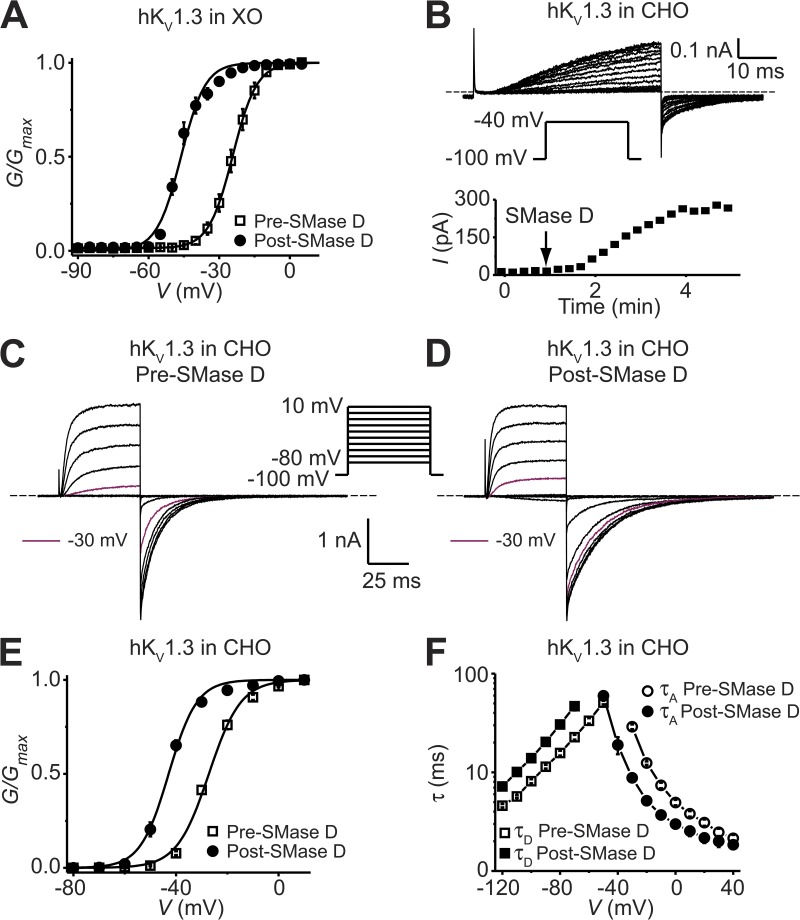
A major goal of this study is to use SMase D as a tool to determine whether sphingomyelin interacts with native KV1.3 channels in human T lymphocytes and whether chemical modification of sphingomyelin’s phosphorylcholine group by SMase D stimulates these channels. These cells are known to express a single type of KV channel, KV1.3 (Cahalan and Chandy, 2009), which we have found to be sensitive to SMase D in the oocyte expression system (Fig. 2 A). A direct demonstration of SMase D sensitivity of KV1.3 in human lymphocytes would in turn offer a clue to the question of how these voltage-gated ion channels may be tuned in nonexcitable cells.
Figure 2.
SMase D stimulates KV1.3 channels expressed in Xenopus oocytes and CHO cells. (A) G-V curves before (open squares) and after (closed circles) treatment with SMase D for KV1.3 expressed in Xenopus oocytes, where all data are presented as means ± SEM (n = 6). The curves are fits to single Boltzmann functions, yielding V1/2 = −24.2 ± 0.1 mV and Z = 5.0 ± 0.1 (open squares), and V1/2 = −46.2 ± 0.5 mV and Z = 5.0 ± 0.4 (closed circles). (B) KV1.3 currents recorded from a CHO cell in the presence of 5 mM [K+]ext elicited by repeatedly stepping the voltage every 15 s from the −100-mV holding potential to the −40-mV test potential; the addition of SMase D caused the current to increase gradually (top). Time course of the KV1.3 current increase after the addition of SMase D (bottom). (C and D) KV1.3 currents of a CHO cell (K+]ext = 20 mM) elicited by stepping membrane voltage from the −100-mV holding voltage to between −80 and 10 mV in 10-mV increments at 15-s intervals before (C) and after (D) SMase D treatment, where for comparison, the current traces at −30 mV are colored maroon. Dashed lines in B–D indicate zero current levels. (E) G-V curves of KV1.3 before (open squares) and after (closed circles) 3-min SMase D treatment, where all data are presented as means ± SEM (n = 5). The curves are fits to single Boltzmann functions, yielding V1/2 = −27.2 ± 0.4 mV and Z = 4.1 ± 0.2 (open squares), and V1/2 = −42.9 ± 0.4 mV and Z = 4.6 ± 0.3 (closed circles). (F) Voltage dependence of activation (circles) and deactivation (squares) time constants (τA and τD) of KV1.3 before (open symbols) and after (closed symbols) 3-min SMase D treatment, where all data are presented as means ± SEM (n = 5).
Sphingomyelin may make up as much as 25% of total phospholipids in oocyte membranes as opposed to <15% in many mammalian cells (Stith et al., 2000; Hermansson et al., 2005; Hill et al., 2005; Pike et al., 2005). This high sphingomyelin content of oocyte membranes could create artificial sphingomyelin–channel interactions absent in some mammalian cells. To address this issue, we first tested SMase D on KV1.3 channels heterologously expressed in CHO cells where sphingomyelin has been determined to be only 12–14% of total plasma membrane phospholipids (Hermansson et al., 2005; Pike et al., 2005). As shown in the top panel of Fig. 2 B, a voltage step to −40 mV caused KV1.3 channels to conduct no visible current, and current gradually appeared after the addition of SMase D; the time course is presented in the bottom panel. Examples of KV1.3 current responding to a series of voltage steps before and after SMase D treatment are shown in Fig. 2 (C and D). SMase D treatment shifted the G-V curve by about −15 mV (Fig. 2 E). This result shows that SMase D sensitivity is not merely a consequence of the high sphingomyelin content of oocytes. Additionally, SMase D also affects the kinetics of channel gating (Fig. 2, C and D). We estimated the rate of both current onset upon depolarization and current decay upon hyperpolarization from single-exponential fits, and plotted the τ values against membrane voltage (Fig. 2 F). SMase D left-shifts these kinetics plots by amounts comparable to that of the steady-state G-V curve. All of these findings can be explained by the scenario in which the removal of the choline group by SMase D creates a local negative offset in membrane voltage.
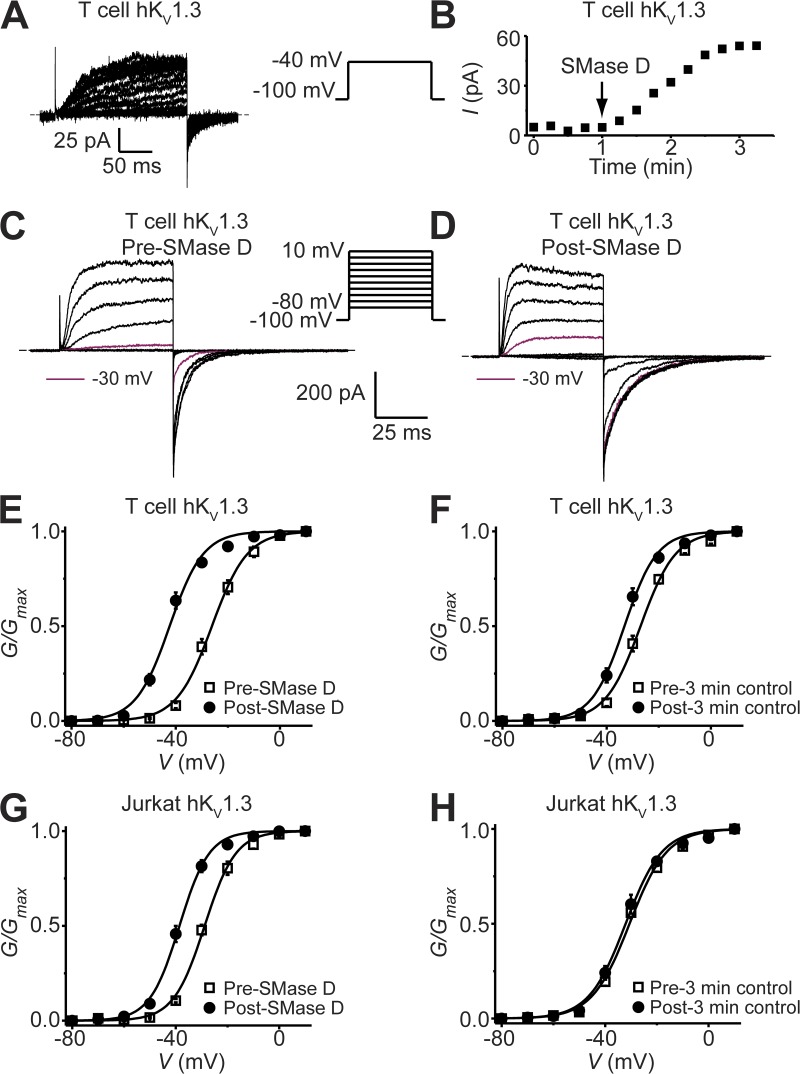
In principle, the apparent interactions between sphingomyelin molecules and KV1.3 channels heterologously expressed in oocytes and CHO cells may be the consequence of overexpression that drives the channels into some membrane domains differing from the native membrane environment of KV1.3 channels in lymphocytes. To rule out this possibility, we directly tested SMase D against native KV1.3 channels in human peripheral blood T lymphocytes, whose plasma membrane contains 11–12% sphingomyelin (Leidl et al., 2008). Fig. 3 (A–E) shows that after the addition of SMase D, KV1.3 current at −40 mV markedly increased and the channels’ G-V curve shifted by about −15 mV. However, in the absence of SMase D treatment, T cells exhibited a small “spontaneous,” time-dependent shift (Fig. 3 F), a known phenomenon of this particular cell type (Cahalan et al., 1985). This spontaneous shift itself did not result in measurable increases in KV1.3 activity at −50 mV, compared with an increase from near zero to ∼20% of maximum after SMase D treatment. Nonetheless, to rule out the possibility that the SMase D effect is merely an amplification of the time-dependent shift, we repeated the experiment on endogenous KV1.3 channels in Jurkat T cells, a leukemic cell line that lacks certain proteins (Abraham and Weiss, 2004) and exhibits no time-dependent G-V shift under comparable conditions (Fig. 3 H). Fig. 3 G shows that SMase D also shifted the G-V relationship of KV1.3 channels in Jurkat cells in the hyperpolarized direction. Thus, sphingomyelin apparently interacts with KV1.3 channels in human T lymphocytes, and removal of its choline group by SMase D indeed stimulates KV1.3 in these cells at −50 mV, the typical resting membrane potential of human T cells (Cahalan and Chandy, 2009).
Figure 3.
SMase D activates native KV1.3 channels in human T cells. (A) KV1.3 currents of a T cell recorded in the presence of 5 mM [K+]ext elicited by stepping the voltage every 15 s from the −100-mV holding potential to the −40-mV test potential. After the addition of SMase D, the current gradually increased. (B) Time course of KV1.3 current increase after the addition of SMase D. (C and D) KV1.3 currents ([K+]ext = 20 mM) elicited by stepping the membrane voltage from the −100-mV holding potential to between −80 and 10 mV in 10-mV increments at 15-s intervals before (C) and after (D) the addition of SMase D to the bath solution, where the current traces for −30 mV are colored maroon. Dashed lines in A, C, and D indicate zero current levels. (E–H) G-V curves of KV1.3 channels in T cells (E and F) and Jurkat cells (G and H) before (open squares) and after (closed circles) either a 3-min treatment with SMase D (E and G) or a 3-min control period in the absence of SMase D (F and H), where all data are presented as means ± SEM (n = 5). The curves are fits of Boltzmann functions, yielding V1/2 = −26.1 ± 0.4 mV and Z = 3.7 ± 0.2 (open squares), or V1/2 = −42.4 ± 0.6 mV and Z = 4.0 ± 0.3 (closed circles) for E; V1/2 = −27.0 ± 0.4 mV and Z = 3.8 ± 0.2 (open squares) or V1/2 = −33.2 ± 0.5 mV and Z = 4.1 ± 0.3 (closed circles) for F; V1/2 = −28.8 ± 0.4 mV and Z = 4.3 ± 0.2 (open squares) or V1/2 = −38.6 ± 0.3 mV and Z = 4.5 ± 0.2 (closed circles) for G; and V1/2 = −30.6 ± 0.5 mV and Z = 3.5 ± 0.2 (open squares) or V1/2 = −32.1 ± 0.5 mV and Z = 3.6 ± 0.2 (closed circles) for H.
SMase D stimulates NaV and CaV channels
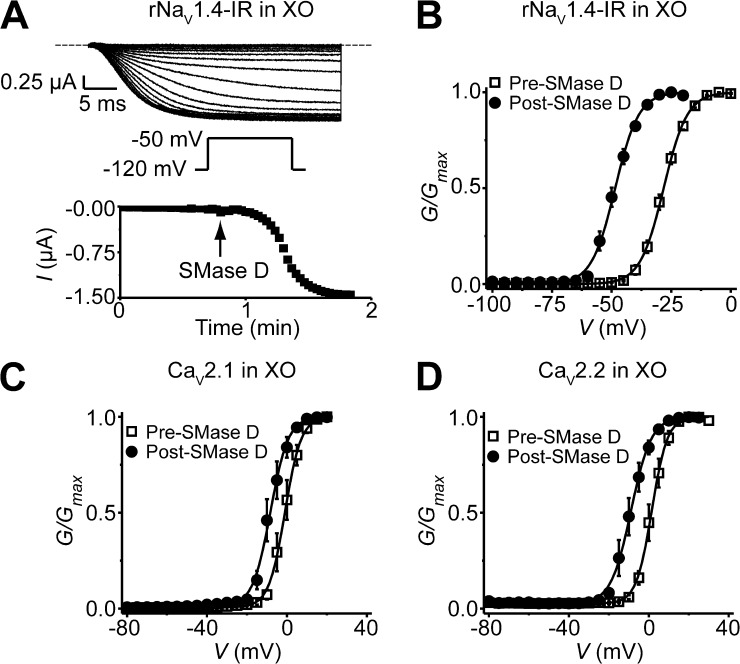
Because KV, NaV, and CaV channels all have similar voltage sensors (Swartz, 2008), we wondered whether NaV and CaV channels also interact with sphingomyelin such that they are sensitive to SMase D. For technical simplicity, we started by examining skeletal muscle rNaV1.4(α) channels with inactivation removed (rNaV1.4-IR) (West et al., 1992a), heterologously expressed in Xenopus oocytes. These channels normally exhibit little current at −50 mV, but after exposure to SMase D, inward current increased dramatically (Fig. 4 A). SMase D activated the channels by shifting their G-V relation in the hyperpolarized direction (Fig. 4 B). In addition, SMase D also left-shifted the G-V curves of CaV channels CaV2.1α (P/Q type) (Mori et al., 1991) and CaV2.2α (N type) (Williams et al., 1992), coexpressed with β1a and α2-δ subunits in oocytes (Fig. 4, C and D). This SMase D effect on CaV channels might be lessened by the use of a high concentration of extracellular Ba2+ as the charge carrier. In any case, SMase D can stimulate NaV and CaV channels, as well as KV channels.
Figure 4.
SMase D shifts the G-V curves of NaV and CaV channels expressed in Xenopus oocytes in the hyperpolarized direction. (A) NaV1.4-IR currents elicited by stepping the voltage every 4 s from the −100-mV holding potential to a −120-mV prepulse, and then to the −50-mV test potential; the dashed line indicates the zero current level. After the addition of recombinant SMase D to the bathing solution, the current gradually increased (top). Time course of NaV1.4-IR current increase after the addition of SMase D (bottom). (B–D) G-V curves before (squares) and after (circles) treatment with SMase D for NaV1.4-IR (B), CaV2.1 (C), and CaV2.2 (D), where all data are presented as means ± SEM (n = 3–9). The curves are fits of Boltzmann functions, yielding the midpoint (V1/2) of −28.2 ± 0.4 mV and the apparent valence (Z) of 5.2 ± 0.1 (open squares), or V1/2 = −48.5 ± 0.2 mV and Z = 5.2 ± 0.2 (closed circles) for B; V1/2 = −1.0 ± 0.1 mV and Z = 6.3 ± 0.2 (open squares), or V1/2 = −8.4 ± 0.2 mV and Z = 5.6 ± 0.3 (closed circles) for C; V1/2 = 1.5 ± 0.1 mV and Z = 6.6 ± 0.2 (open squares), or V1/2 = −8.9 ± 0.2 mV and Z = 5.1 ± 0.2 (closed circles) for D.
SMase D slows fast inactivation of NaV channels in Xenopus oocytes
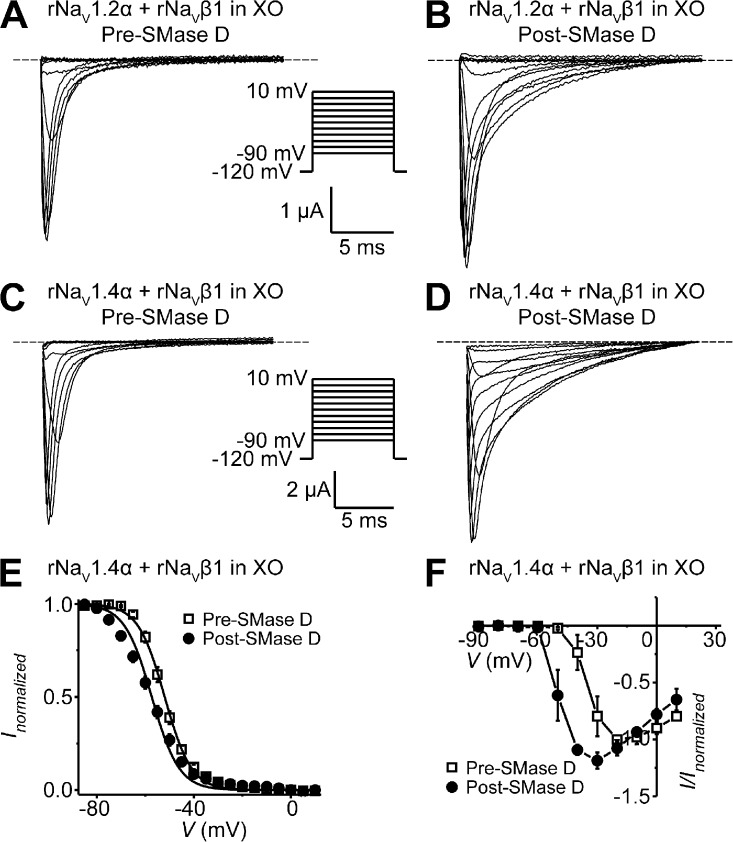
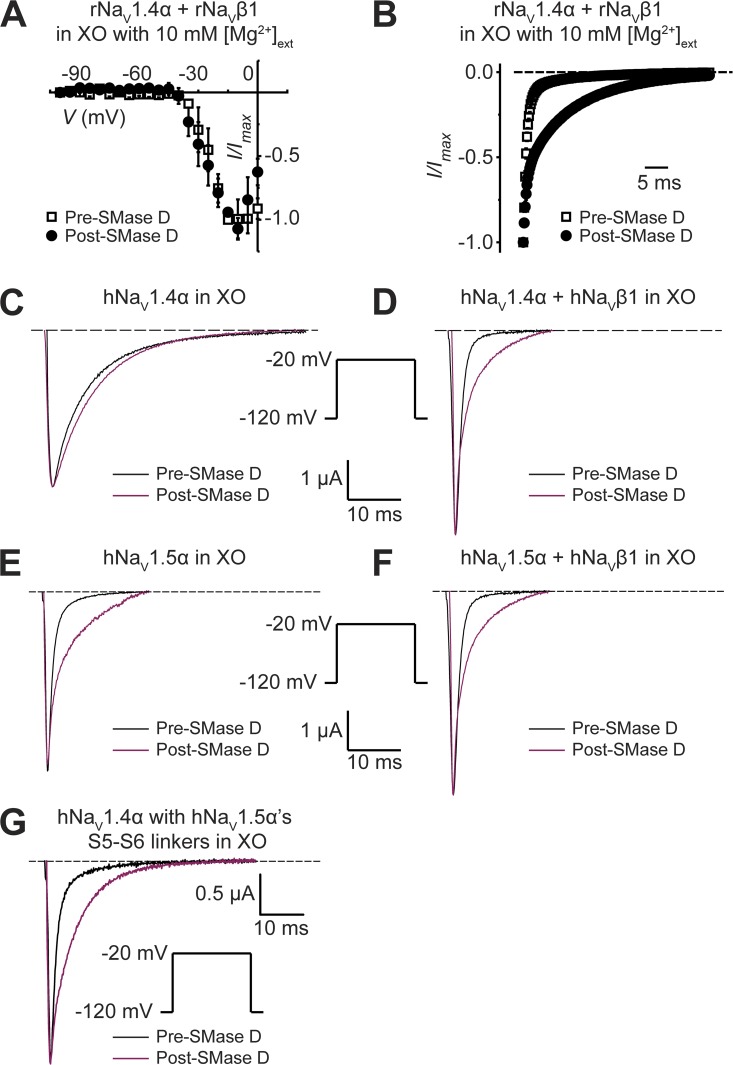
When examining wild-type NaV channels coexpressed with the NaVβ1 subunit in Xenopus oocytes, we surprisingly found that SMase D had a strong impact on the kinetics of channel inactivation. Here, we mainly discuss the data obtained from rNaV1.4 channels. However, as we will later examine native NaV1.2 channels in mammalian cells, we illustrate here as a control that in oocytes, heterologously expressed rNaV1.2 and rNaV1.4 channels exhibited similar responses to SMase D (Fig. 5, A–D). SMase D markedly slowed the inactivation of rNaV1.4α + β1 with a small alteration of the steady-state inactivation curve (Fig. 5, C–E). The current-voltage (I-V) curves constructed from NaV peak currents (Fig. 5 F) show that, as with rNaV1.4-IR, SMase D clearly induced inward Na+ current at membrane potentials as negative as −50 mV. As discussed above, this phenomenon reflects a leftward shift of the G-V relation and therefore of the I-V relation. Given that increasing the extracellular Mg2+ concentration attenuates the SMase D effect on activation gating (Ramu et al., 2006), this maneuver should also attenuate its effect on the inactivation kinetics if SMase D affects both gating properties by the same mechanism. Fig. 6 A shows that in the presence of a high extracellular concentration (10 mM) of Mg2+, the application of SMase D resulted in little shift of the I-V curve of rNaV1.4α + β1. It nonetheless still slows inactivation (Fig. 6 B). These results not only confirm that under this high Mg2+ condition SMase D remains active but also show that SMase D does not affect activation energetic and inactivation kinetics by the same mechanism.
Figure 5.
SMase D stimulates NaVα + β1 channels in oocytes and slows their inactivation. (A–D) rNav1.2α + β1 (A and B) or rNav1.4α + β1 (C and D) currents from an oocyte, before (A and C) and after (B and D) SMase D treatment, by stepping the membrane voltage from the −120-mV holding voltage to various test potentials between −90 and 10 mV. (E and F) Steady-state inactivation curves (E) and I-V relations (F) before (open squares) and after (closed circles) SMase D treatment; all data are presented as means ± SEM (n = 3–6). Curves in E are fits to single Boltzmann functions, yielding V1/2 = −52.0 ± 0.2 mV and Z = 4.7 ± 0.2 (open squares), and V1/2 = −56.1 ± 0.8 mV and Z = 3.6 ± 0.2 (closed circles).
Figure 6.
Effects of high Mg2+ and the NaVβ1 subunit on SMase D sensitivity of NaV channels. (A and B) rNaV1.4α + β1’s I-V curves (A) and inactivation time courses at −20 mV (B), collected in the presence of 10 mM of extracellular Mg2+ without (open squares) or with (closed circles) SMase D; all data are presented as means ± SEM (n = 3). (C–G) Currents of hNaV1.4α (C), hNaV1.4α + β1 (D), hNaV1.5α (E), hNaV1.5α + β1 (F), and mutant hNaV1.4α containing hNaV1.5α’s S5–S6 linkers (G), elicited by depolarizing the membrane from −120 to −20 mV before (black) and after (maroon) SMase D treatment. Dashed lines indicate the zero current level.
We next investigated whether the SMase D effect on inactivation kinetics depends on the NaVβ1 subunit. For this particular study, we switched to hNaV1.4 for two reasons. First, rNaV1.4 and hNaV1.4 behave similarly (Trimmer et al., 1989; George et al., 1992). Second, we realized that we would need to perform a comparative study between NaV1.4 and NaV1.5 and had already obtained the human versions of the two channels. When expressed alone in oocytes, NaV1.4α is known to exhibit slow (∼8-ms time constant τ) inactivation kinetics (Trimmer et al., 1989). Inactivation of hNaV1.4α was barely affected by SMase D treatment (Fig. 6 C). Coexpression of the NaVβ1 subunit is known to markedly accelerate the inactivation rate (τ of ∼1 ms; Fig. 6 D) (Isom et al., 1992; Patton et al., 1994). Under this condition, SMase D treatment slowed inactivation (Fig. 6 D), causing it to follow a double- rather than a single-exponential time course in most cases (Table 1). The τ values for the fast and slow components are ∼1 and ∼7 ms, comparable to those with and without coexpression of the NaVβ1 subunit, respectively (Table 1). In most oocyte batches, the relative amplitude of the slow phase is ∼60%, although in some batches it reaches practically 100%. Therefore, in a variable fraction (60–100%) of channels, SMase D eliminates the NaVβ1 subunit’s apparent acceleration of the inactivation.
Table 1.
The effect of SMase D on hNaV inactivation kinetics in Xenopus oocytesa
| Parameters | hNaV1.4α | hNaV1.4α + β1 | hNaV1.5α | hNaV1.5α + β1 | muthNaV1.4αb |
| Control | |||||
| τ | 7.8 ± 0.2 msc | 1.0 ± 0.1 msc | 1.1 ± 0.04 msc | 1.3 ± 0.02 msc | 2.2 ± 0.1 msc |
| SMase D | |||||
| τ | 9.5 ± 0.2 msc | 7.0 ± 0.2 msc | |||
| τ1 | 0.7 ± 0.2 msd | 0.5 ± 0.2 msd | 0.6 ± 0.1 msd | ||
| τ2 | 7.0 ± 0.2 msd | 3.8 ± 0.2 msd | 5.6 ± 0.2 msd | ||
| A1/(A1 + A2) | 0.32 ± 0.01d | 0.34 ± 0.01d | 0.47 ± 0.02d | ||
| A2/(A1 + A2) | 0.68 ± 0.01d | 0.66 ± 0.01d | 0.53 ± 0.02d |
Data is presented as mean ± SEM (n = 4 – 8).
Contains the S5–S6 linkers of hNaV1.5.
Inactivation time courses were fit to
Inactivation time courses were fit to
For comparison, we also studied cardiac hNaV1.5 channels. Inactivation kinetics of cardiac hNaV1.5 channels are comparably fast (τ of ∼1 ms) with or without the NaVβ1 subunit (Fig. 6, E and F, and Table 1) (Makita et al., 1994). Under either condition, SMase D treatment slows the inactivation kinetics of a large fraction of hNaV1.5 channels (Fig. 6, E and F, and Table 1). The S5–S6 linker of the α subunit underlies the NaVβ1-subunit effect on inactivation kinetics (Qu et al., 1999). An hNaV1.4 mutant, whose S5–S6 linkers are all replaced by the corresponding ones from hNaV1.5, acquires fast inactivation kinetics with and without coexpression of the NaVβ1 subunit (Vilin et al., 1999). We therefore tested whether the inactivation kinetics of this mutant also become sensitive to SMase D, even without coexpression of the NaVβ1 subunit. This was in fact the case (Fig. 6 G and Table 1). Thus, transferring the S5–S6 linkers of hNaV1.5α channels to hNaV1.4α channels confers both the fast inactivation kinetics and the SMase D sensitivity of hNaV1.5α upon hNaV1.4α channels.
SMase D stimulates activation but does not slow inactivation of native NaV channels in tested mammalian cells
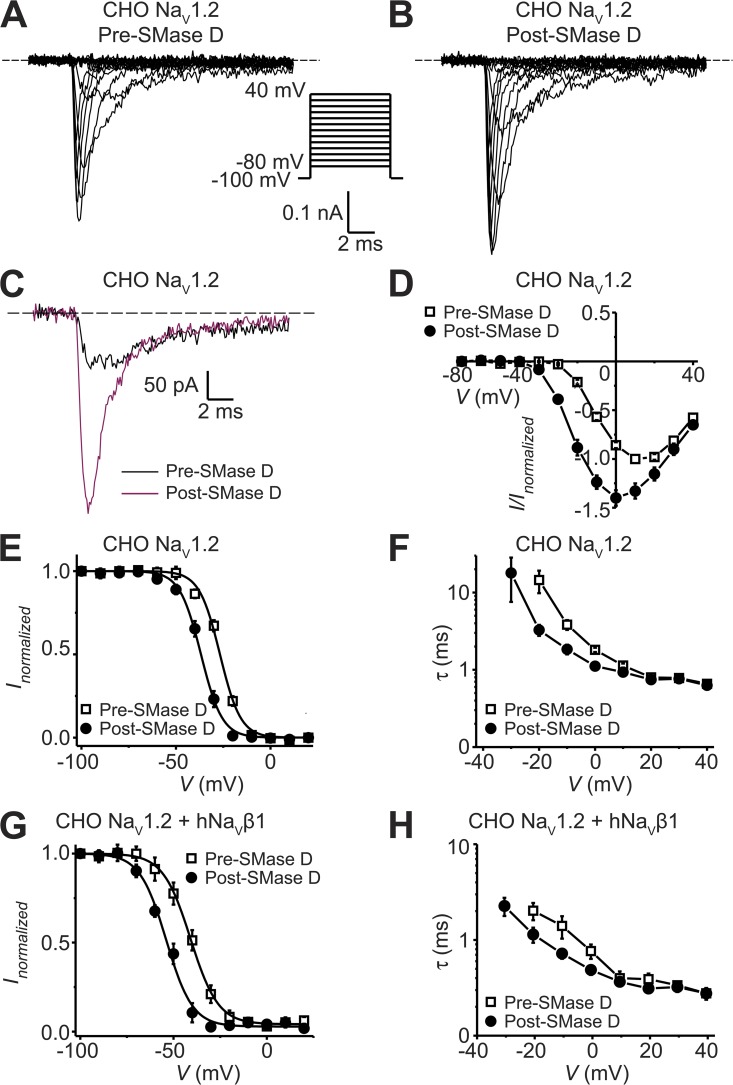
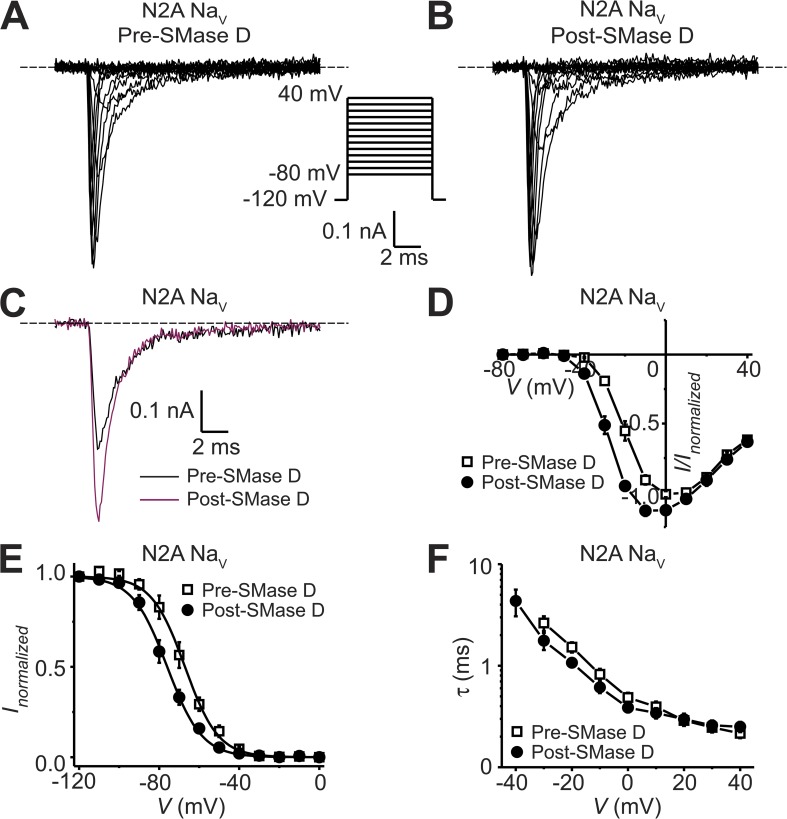
To test whether NaV channels in mammalian cells exhibit the same types of SMase D sensitivity observed in Xenopus oocytes, we continued to use CHO cells for the following reasons. These cells endogenously express mostly, if not exclusively, NaV1.2 channels with fast inactivation and may not express endogenous NaVβ1 subunits (West et al., 1992b; Lalik et al., 1993; Isom et al., 1995). Recall that in oocytes, when coexpressed with the NaVβ1 subunit, rNaV1.2 exhibited fast inactivation kinetics that were sensitive to SMase D (Fig. 5, A and B). Fig. 7 (A and B) shows two series of NaV currents recorded at various membrane potentials from a CHO cell before or after SMase D treatment. For better comparison, the current traces at −20 mV, recorded before and after SMase D treatment, are superimposed in Fig. 7 C. To our surprise, unlike what was observed in oocytes, SMase D did not slow the inactivation and, if anything, slightly accelerated it because of an expected left-shift of the voltage dependence (Fig. 7, C and F). However, like what was observed in oocytes, SMase D did activate NaV channels in CHO cells at more hyperpolarized potentials, causing a leftward shift of the descending limb of the I-V curve; peak current also increased (Fig. 7 D). In the ascending limb, which primarily reflects the decreasing driving force, the two curves tended to merge as the open probability of channels approached its maximum. As expected for an effect on voltage-sensor activation, SMase D also left-shifted both the steady-state inactivation curve (Fig. 7 E) and the voltage dependence of the fast inactivation kinetics in the hyperpolarized direction (Fig. 7 F). Thus, as opposed to what is observed in Xenopus oocytes, SMase D does not slow inactivation of NaV channels in mammalian CHO cells. However, as in oocytes, it does promote channel activation in these cells. We also tested the effect of SMase D on NaV channels in a second commonly used cell line, mouse neuroblastoma N2A cells, and observed qualitatively the same effects (Fig. 8).
Figure 7.
Effect of SMase D on native NaV channels in CHO cells. (A–C) NaV currents from a CHO cell before (A) and after (B) the addition of SMase D, elicited by stepping the membrane voltage from the −100-mV holding voltage to various test potentials between −80 and 40 mV in 10-mV increments. The current traces at −20 mV from A (black) and B (maroon) are superimposed in C. Dashed lines indicate zero current levels. (D) I-V relations before (open squares) and after (closed circles) SMase D treatment; all data are presented as means ± SEM (n = 5). (E–H) Steady-state inactivation curves (E and G) and voltage dependence of inactivation time constants (F and H) from cells expressing (G and H) or not expressing (E and F) hNaVβ1 before (open squares) and after (closed circles) SMase D treatment; all data are presented as means ± SEM (n = 5). Curves are fits to single Boltzmann functions, yielding V1/2 = −26.8 ± 0.4 mV and Z = 4.7 ± 0.3 (open squares), and V1/2 = −36.8 ± 0.3 mV and Z = 4.6 ± 0.2 (closed circles) in E; and V1/2 = −40.9 ± 0.4 mV and Z = 3.5 ± 0.2 (open squares), and V1/2 = −53.9 ± 0.7 mV and Z = 3.6 ± 0.3 (closed circles) in G.
Figure 8.
SMase D stimulates native NaV channels in N2A cells. (A–C) NaV currents from an N2A cell before (A) and after (B) the addition of SMase D, elicited by stepping the membrane voltage from the −100-mV holding voltage to a −120-mV prepulse and then to various test potentials between −80 and 40 mV in 10-mV increments. The current traces at −20 mV from A (black) and B (maroon) are superimposed in C. Dashed lines indicate zero current levels. (D–F) I-V relations (D), steady-state inactivation curves (E), and voltage dependence of inactivation time constants (F) before (open squares) and after (closed circles) SMase D treatment; all data are presented as means ± SEM (n = 5). Curves in E are fits to single Boltzmann functions, yielding V1/2 = −67.2 ± 0.4 mV and Z = 3.1 ± 0.1 (open squares), and V1/2 = −76.0 ± 0.3 mV and Z = 3.0 ± 0.1 (closed circles).
To test whether the failure of SMase D to slow NaV inactivation in CHO cells was caused by the apparent absence of the NaVβ1 subunit, we expressed the NaVβ1 subunit in CHO cells. As reported previously, expression of the NaVβ1 subunit shifted the voltage dependence of steady-state inactivation (Fig. 7, E vs. G) and inactivation kinetics (Fig. 7, F vs. H) in the hyperpolarized direction (Isom et al., 1995). These results argue that native NaV channels are under the influence of the expressed NaVβ1 subunit. Despite the functional expression of the NaVβ1 subunit in CHO cells, just as without this expression, SMase D only slightly accelerated NaV inactivation instead of slowing it as in oocytes. Thus, the insensitivity of NaV inactivation kinetics to SMase D in CHO cells is not simply caused by a lack of the NaVβ1 subunit.
SMase D shifts excitable cells’ action potential threshold in the hyperpolarized direction
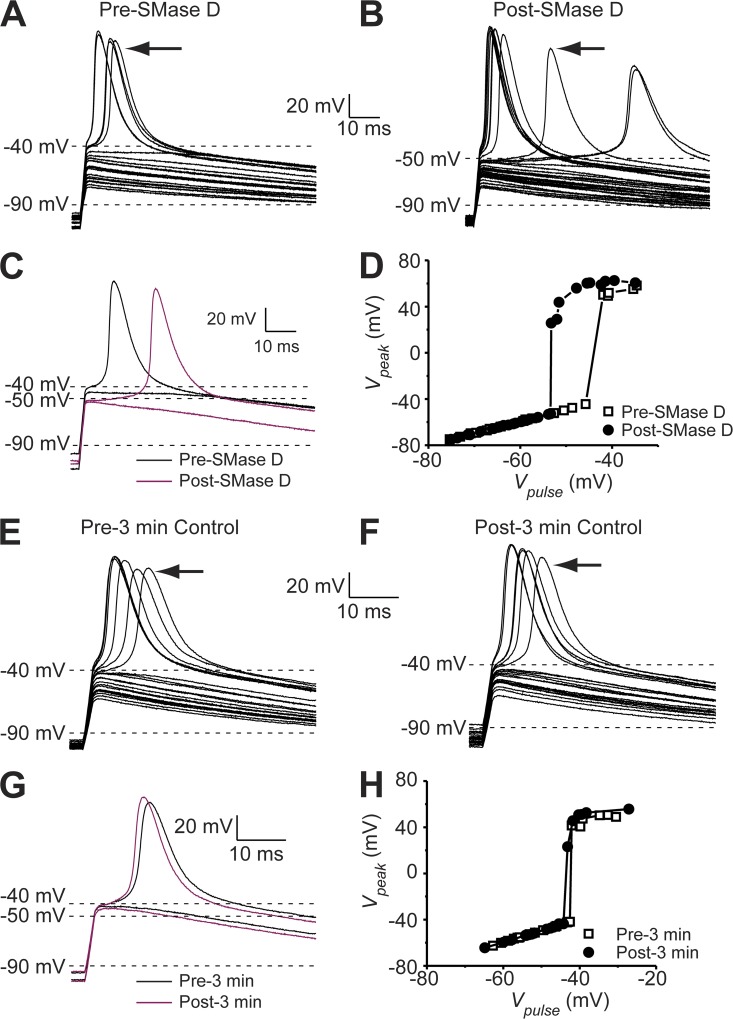
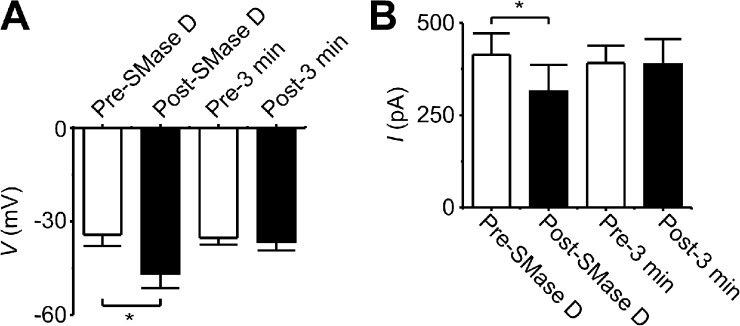
In principle, a left-shift of the G-V curve of NaV channels may result in an increase of cellular excitability. In fact, shifts as small as 5 mV can have a profound functional impact, including causing human genetic diseases (Dib-Hajj et al., 2010). We thus investigated whether SMase D could tune cellular excitability. We chose to use N2A cells because their spherical shape and modest density of NaV channels would allow better electrophysiological control compared with primary neurons. As shown in Fig. 8 D, SMase D treatment shifted the I-V curve of NaV channels in N2A cells by about −10 mV. This left-shift of the NaV I-V curve caused by SMase D is expected to result in a shift of the action potential threshold in the hyperpolarized direction. We tested this predication by examining action potentials in the current-clamp mode. We injected a small constant negative current, hyperpolarizing the resting membrane potential to around −100 mV to minimize the confounding effect of steady-state inactivation (Fig. 8 E). Fig. 9 (A and B) shows action potentials recorded from a cell, elicited before or after SMase D treatment by a series of brief and incremental depolarizing current pulses. The SMase D–caused shift of the action potential threshold in the hyperpolarized direction can be more clearly seen in Fig. 9 C. Before SMase D treatment, action potentials were triggered at about −40 mV, whereas afterward, the threshold dropped to about −50 mV. To further illustrate this point, we plotted the peak voltage for both types of traces against the membrane voltage at the end of the brief current pulse (Fig. 9 D). As expected, passive voltage responses initially rose linearly, but once action potential threshold was exceeded, the voltage rose steeply. SMase D creates a leftward shift of this plot. On average, the action potential threshold was shifted by −13 mV after SMase D treatment, and a smaller amount of injected current was required to depolarize the membrane potential to this action potential threshold (Fig. 10, A and B). As a control, we show that neither the action potential threshold nor the amount of the injected current exhibited any significant spontaneous change without the application of SMase D during the same period of time (Figs. 9, E–H, and 10, A and B). Thus, SMase D increases the N2A cell’s excitability by making the action potential threshold more negative.
Figure 9.
SMase D shifts the action potential threshold of N2A cells in the hyperpolarized direction. (A–C) Passive voltage responses and action potentials of an N2A cell elicited by several series of 2-ms current pulses between ∼200 and 500 pA in 30-pA increments before (A) and after (B) 3-min SMase D treatment. The action potentials indicated by arrows and the most depolarized passive voltage responses are replotted as black (A) and maroon (B) curves in C. (D) Peak voltages (A, open squares, and B, closed circles) plotted against the instantaneous voltage at the end of the 2-ms current pulse. (E–G) Passive voltage responses and action potentials of an N2A cell elicited by several series of 2-ms current pulses between ∼200 and 500 pA in 30-pA increments before (E) and after (F) 3-min control in the absence of SMase D treatment. The action potentials indicated by arrows and the most depolarized passive voltage responses are replotted as black (E) and maroon (F) curves in G. (H) Peak voltages (E, open squares, and F, closed circles) plotted against the instantaneous voltage at the end of the 2-ms current pulse.
Figure 10.
SMase D causes a negative shift in the action potential threshold and reduces the amount of injected current required to depolarize the membrane potential to the action potential threshold. (A) Averaged action potential threshold voltage (means ± SEM; n = 5) before (white) and after (black) SMase D treatment (P < 0.01) or before (white) and after (black) 3-min control without SMase D treatment. (B) Average injected current required to depolarize the membrane potential to the threshold (means ± SEM; n = 5) before (white) and after (black) SMase D treatment (P < 0.01) or before (white) and after (black) 3-min control without SMase D treatment. The p-values were calculated with a paired-sample, two-tailed t test method.
DISCUSSION
Voltage-gated ion channels are embedded in membrane lipids. Questions remain as to what types of phospholipids, including relatively minor species, actually interact with these integral membrane proteins in native membrane environments, and how such interactions may impact channel function. As a step toward answering these important questions, we have used SMase D as a tool to investigate sphingomyelin’s functional impact on voltage-gated ion channels in native environments.
Previously, our group discovered that in Xenopus oocytes, SMase D stimulates the Shaker and KV2.1 channels (Ramu et al., 2006). Here, we show that SMase D promotes activation of all three classes of classical voltage-gated channels, and that removing most of the Shaker channel’s paddle sequence practically eliminates the channel’s SMase D sensitivity (Figs. 1 and 4). These results, together with the following previous findings, support the hypothesis that SMase D produces this effect by altering interactions between voltage sensors and sphingomyelin molecules. First, an elevated extracellular divalent cation concentration antagonizes SMase D’s action (Ramu et al., 2006). Increasing extracellular divalent cation concentrations is known to reduce the effect of membrane surface charges on voltage sensors and inhibits activation of voltage-gated channels (Frankenhaeuser and Hodgkin, 1957; Hille, 2001). Second, a mutant cycle analysis of the interaction between a gating-modifier toxin and the voltage-sensor paddle with and without SMase D treatment suggests that sphingomyelin interacts with the paddle motif (Milescu et al., 2009). Third, SMase D also causes a hyperpolarizing shift of the Q-V curve of a bacterial voltage-sensitive phosphatase, a protein quite unlike a channel apart from its voltage sensor (Milescu et al., 2009). Additionally, structural and spectroscopic studies have shown that the outmost extracellular voltage-sensing residues of KV channels are indeed poised to interact with membrane lipids (Cuello et al., 2004; Long et al., 2007; Krepkiy et al., 2012). Moreover, electrophysiological studies indicate that the phosphoryl group of membrane lipids is critical for the proper function of the channels’ voltage sensors (Schmidt et al., 2006; Xu et al., 2008; Zheng et al., 2011). Therefore, it is reasonable to conclude that the channels’ voltage sensors interact with sphingomyelin so that SMase D modification of sphingomyelin’s head group promotes voltage-sensor activation.
The generality of the channel-stimulating effect of SMase D has been called into question by the following findings. First, under the reported conditions, the KV10.1 channel and a K+ channel gated by both voltage and Ca2+ appear to be insensitive to SMase D, even when heterologously expressed in the oocytes (Ramu et al., 2006). This observation raises the question of whether the observed SMase D effect on voltage gating occurs only in a small subset of KV channels. To address this question, we have tested other KV channels, such as KV1.3 as well as NaV and CaV channels in oocytes, and found that all of these tested channels are stimulated by SMase D (Figs. 2 A, 4, and 5). Thus, this SMase D effect seems to be a widespread phenomenon across the voltage-gated channel family. Second, the suggestion that the Xenopus oocyte membrane has much more sphingomyelin than that of many mammalian cell types, including CHO cells and lymphocytes, raises the question of whether the SMase D effect only occurs in cell membranes with very high sphingomyelin content (Stith et al., 2000; Hermansson et al., 2005; Hill et al., 2005; Pike et al., 2005; Leidl et al., 2008). To address this second question, we have tested heterologously expressed KV1.3 channels and native NaV1.2 channels in CHO cells and have found that SMase D does promote channel activation in both cases (Figs. 2, B–F, and 7). These results indicate that the voltage sensors of these voltage-gated channels do interact with sphingomyelin, even in cell membranes where sphingomyelin is a relatively minor phospholipid species. Thus, either the channels’ voltage sensors tend to interact with sphingomyelin over some other lipid types or the channels tend to be trafficked to sphingomyelin-rich domains.
The stimulatory effect of SMase D on voltage-gated channels implies that SMase D can increase cellular excitability. It may even be able to tune the activity of voltage-gated channels in nonexcitable cells. We thus directly tested SMase D against native voltage-gated channels in relevant types of mammalian cells. In a series of studies, we have demonstrated that SMase D can indeed effectively stimulate NaV channels in excitable N2A cells, boosting their excitability (Figs. 8–10). SMase D does so by a mechanism different from that of canonical excitatory neurotransmitters, which generally increase excitability by depolarizing the resting membrane potential toward the action potential threshold. It is noteworthy that although both types of mechanisms can effectively enhance cellular excitability by narrowing the gap between the resting membrane potential and the action potential threshold, they differ fundamentally in that depolarizing the membrane potential, unlike shifting the action potential threshold in the hyperpolarized direction, directly affects the driving force for permeant ions, e.g., Ca2+. Additionally, we have found that SMase D robustly stimulates endogenous KV1.3 channels in nonexcitable human T lymphocytes (Fig. 3), an experimental demonstration of how voltage-gated ion channels may be tuned in these nonexcitable cells.
One important and unexpected SMase D effect is that it markedly slows inactivation of certain NaV channels under specific expression conditions. In oocytes, SMase D slows the inactivation of NaV1.4α channels only when they are coexpressed with the NaVβ1 subunit and that of NaV1.5α channels, even when they are not coexpressed with the NaVβ1 subunit (Figs. 5 and 6). In stark contrast, SMase D does not slow the inactivation kinetics of native NaV channels in two tested mammalian cell lines (Figs. 7 and 8), and this is true even when the NaVβ1 subunit is functionally overexpressed (Fig. 7 H). These findings offer new insight into how the NaVβ1 subunit and phospholipids may affect NaV inactivation kinetics.
First, the appearance that in Xenopus oocytes SMase D eliminates the NaVβ1 acceleration of NaV1.4α inactivation may be explained by the scenario in which sphingomyelin couples the NaVα-β1 subunit interaction. However, this scenario cannot straightforwardly explain why in oocytes NaV1.5α itself exhibits fast inactivation and its inactivation kinetics can likewise be slowed by SMase D. An alternative explanation is that the NaVβ1subunit helps optimize the sphingomyelin–NaV1.4α interactions that enable fast inactivation, whereas NaV1.5α can achieve functionally comparable interactions with sphingomyelin even without the NaVβ1 subunit.
Second, in mammalian cells, NaV’s activation energetics but not its inactivation kinetics are sensitive to SMase D (Figs. 7 and 8). Thus, sphingomyelin has functionally impactful interactions with the channel protein at the activation-related site(s) but not at the site(s) related to inactivation kinetics. The idea of functionally separate channel–sphingomyelin interactions is supported by the following findings. A high concentration of the extracellular divalent cation Mg2+ apparently counteracts the SMase D effect on the channels’ activation energetics but not on their inactivation kinetics (Fig. 6, A and B). Furthermore, SMase D sensitivity of activation energetics depends on the paddle motif, whereas SMase D sensitivity of inactivation kinetics can be conferred upon insensitive channels by transferring the S5–S6 linkers from sensitive channels (Figs. 1 and 6). The observation that in mammalian cells NaV channels exhibit SMase D–insensitive fast-inactivation implies that the site related to inactivation kinetics is occupied by lipids other than sphingomyelin. In oocytes, sphingomyelin occupancy at this site might then be a consequence of the greater sphingomyelin abundance of oocyte membranes. On the other hand, if in CHO cells sphingomyelin truly does not occupy the inactivation kinetics–related site, its occupancy at the activation-related site then implies that sphingomyelin has a lower “affinity” (relative to competing lipids) for the former site than the latter one.
In summary, enzymatic removal of sphingomyelin’s choline group can activate certain members of all three classes of voltage-gated channels at near-resting membrane potentials by shifting their G-V curves in the hyperpolarized direction. SMase D stimulation of native KV1.3 channels in human T lymphocytes provides a clue to the extant question of how voltage-gated ion channels in nonexcitable cells may be tuned. On the other hand, the effect of SMase D on the action potential threshold exemplifies how an extracellular lipase may tune cellular excitability by modulating activation gating of NaV channels. Thus, these proof-of-concept studies demonstrate the potential for the voltage-gated channel activity of nonexcitable cells and the membrane electrical excitability of excitable cells to be pharmacologically or physiologically tuned by enzymatically modifying their head-group chemistry or regulating the relative abundance of minor lipid species. Given that sphingomyelin is a relatively minor species in some mammalian cell membranes, the observed SMase D effect on activation gating of these voltage-gated channels implies that the channels’ voltage sensors have some preference for sphingomyelin over some other lipid types, or that the channels are preferentially trafficked to sphingomyelin-rich domains. In addition, SMase D slows inactivation of NaV channels heterologously expressed in oocytes but not those of native NaV channels in tested mammalian cells. This different, NaVβ1-related SMase D sensitivity of NaV inactivation kinetics underscores the impact of cell membrane lipid environments on channel function, which are set by characteristic cellular lipid metabolism. Thus, SMase D has helped to reveal the potentially profound impact of modification and metabolism of membrane lipids on ion channel function.
Acknowledgments
We thank S. Billington and K. Lynch for SMase D cDNAs; A. George and A. Golding for wild-type and mutant NaV cDNAs; T. Snutch and J. Yang for CaV cDNAs; J. Wooltorton for technical advice on action potential recordings; and P. De Weer for review of the manuscript.
This study was supported by the National Institutes of Health: a research grant to Z. Lu from the National Institute of General Medical Science (RO1 GM55560) and a fellowship grant to D.J. Combs from the National Institute of Neurological Disorders and Strokes (F31 NS73070). Z. Lu is an investigator of the Howard Hughes Medical Institute.
Sharona E. Gordon served as editor.
Footnotes
Abbreviations used in this paper:
- CaV
- voltage-gated Ca2+
- CHO
- Chinese hamster ovary
- KV
- voltage-gated K+
- N2A
- Neuro-2A
- NaV
- voltage-gated Na+
- SMase
- sphingomyelinase
References
- Abraham R.T., Weiss A. 2004. Jurkat T cells and development of the T-cell receptor signalling paradigm. Nat. Rev. Immunol. 4:301–308 10.1038/nri1330 [DOI] [PubMed] [Google Scholar]
- Alabi A.A., Bahamonde M.I., Jung H.J., Kim J.I., Swartz K.J. 2007. Portability of paddle motif function and pharmacology in voltage sensors. Nature. 450:370–375 10.1038/nature06266 [DOI] [PMC free article] [PubMed] [Google Scholar]
- Cahalan M.D., Chandy K.G. 2009. The functional network of ion channels in T lymphocytes. Immunol. Rev. 231:59–87 10.1111/j.1600-065X.2009.00816.x [DOI] [PMC free article] [PubMed] [Google Scholar]
- Cahalan M.D., Chandy K.G., DeCoursey T.E., Gupta S. 1985. A voltage-gated potassium channel in human T lymphocytes. J. Physiol. 358:197–237 [DOI] [PMC free article] [PubMed] [Google Scholar]
- Cuello L.G., Cortes D.M., Perozo E. 2004. Molecular architecture of the KvAP voltage-dependent K+ channel in a lipid bilayer. Science. 306:491–495 10.1126/science.1101373 [DOI] [PubMed] [Google Scholar]
- Dib-Hajj S.D., Cummins T.R., Black J.A., Waxman S.G. 2010. Sodium channels in normal and pathological pain. Annu. Rev. Neurosci. 33:325–347 10.1146/annurev-neuro-060909-153234 [DOI] [PubMed] [Google Scholar]
- Frankenhaeuser B., Hodgkin A.L. 1957. The action of calcium on the electrical properties of squid axons. J. Physiol. 137:218–244 [DOI] [PMC free article] [PubMed] [Google Scholar]
- George A.L., Jr, Komisarof J., Kallen R.G., Barchi R.L. 1992. Primary structure of the adult human skeletal muscle voltage-dependent sodium channel. Ann. Neurol. 31:131–137 10.1002/ana.410310203 [DOI] [PubMed] [Google Scholar]
- Hermansson M., Uphoff A., Käkelä R., Somerharju P. 2005. Automated quantitative analysis of complex lipidomes by liquid chromatography/mass spectrometry. Anal. Chem. 77:2166–2175 10.1021/ac048489s [DOI] [PubMed] [Google Scholar]
- Hill W.G., Southern N.M., MacIver B., Potter E., Apodaca G., Smith C.P., Zeidel M.L. 2005. Isolation and characterization of the Xenopus oocyte plasma membrane: a new method for studying activity of water and solute transporters. Am. J. Physiol. Renal Physiol. 289:F217–F224 10.1152/ajprenal.00022.2005 [DOI] [PubMed] [Google Scholar]
- Hille B. 2001. Ion Channels of Excitable Membranes. Third edition Sinauer Associates, Inc., Sunderland, MA: 814 pp [Google Scholar]
- Huang C.L., Feng S., Hilgemann D.W. 1998. Direct activation of inward rectifier potassium channels by PIP2 and its stabilization by Gβγ. Nature. 391:803–806 10.1038/35882 [DOI] [PubMed] [Google Scholar]
- Isom L.L., De Jongh K.S., Patton D.E., Reber B.F., Offord J., Charbonneau H., Walsh K., Goldin A.L., Catterall W.A. 1992. Primary structure and functional expression of the β1 subunit of the rat brain sodium channel. Science. 256:839–842 10.1126/science.1375395 [DOI] [PubMed] [Google Scholar]
- Isom L.L., Scheuer T., Brownstein A.B., Ragsdale D.S., Murphy B.J., Catterall W.A. 1995. Functional co-expression of the β1 and type IIA α subunits of sodium channels in a mammalian cell line. J. Biol. Chem. 270:3306–3312 10.1074/jbc.270.43.25696 [DOI] [PubMed] [Google Scholar]
- Jiang Y., Lee A., Chen J., Ruta V., Cadene M., Chait B.T., MacKinnon R. 2003. X-ray structure of a voltage-dependent K+ channel. Nature. 423:33–41 10.1038/nature01580 [DOI] [PubMed] [Google Scholar]
- Krepkiy D., Gawrisch K., Swartz K.J. 2012. Structural interactions between lipids, water and S1-S4 voltage-sensing domains. J. Mol. Biol. 423:632–647 10.1016/j.jmb.2012.07.015 [DOI] [PMC free article] [PubMed] [Google Scholar]
- Lalik P.H., Krafte D.S., Volberg W.A., Ciccarelli R.B. 1993. Characterization of endogenous sodium channel gene expressed in Chinese hamster ovary cells. Am. J. Physiol. 264:C803–C809 [DOI] [PubMed] [Google Scholar]
- Leidl K., Liebisch G., Richter D., Schmitz G. 2008. Mass spectrometric analysis of lipid species of human circulating blood cells. Biochim. Biophys. Acta. 1781:655–664 10.1016/j.bbalip.2008.07.008 [DOI] [PubMed] [Google Scholar]
- Liman E.R., Tytgat J., Hess P. 1992. Subunit stoichiometry of a mammalian K+ channel determined by construction of multimeric cDNAs. Neuron. 9:861–871 10.1016/0896-6273(92)90239-A [DOI] [PubMed] [Google Scholar]
- Long S.B., Tao X., Campbell E.B., MacKinnon R. 2007. Atomic structure of a voltage-dependent K+ channel in a lipid membrane-like environment. Nature. 450:376–382 10.1038/nature06265 [DOI] [PubMed] [Google Scholar]
- Makita N., Bennett P.B., Jr, George A.L., Jr 1994. Voltage-gated Na+ channel β1 subunit mRNA expressed in adult human skeletal muscle, heart, and brain is encoded by a single gene. J. Biol. Chem. 269:7571–7578 [PubMed] [Google Scholar]
- Milescu M., Bosmans F., Lee S., Alabi A.A., Kim J.I., Swartz K.J. 2009. Interactions between lipids and voltage sensor paddles detected with tarantula toxins. Nat. Struct. Mol. Biol. 16:1080–1085 10.1038/nsmb.1679 [DOI] [PMC free article] [PubMed] [Google Scholar]
- Mori Y., Friedrich T., Kim M.S., Mikami A., Nakai J., Ruth P., Bosse E., Hofmann F., Flockerzi V., Furuichi T., et al. 1991. Primary structure and functional expression from complementary DNA of a brain calcium channel. Nature. 350:398–402 10.1038/350398a0 [DOI] [PubMed] [Google Scholar]
- Patton D.E., Isom L.L., Catterall W.A., Goldin A.L. 1994. The adult rat brain β1 subunit modifies activation and inactivation gating of multiple sodium channel α subunits. J. Biol. Chem. 269:17649–17655 [PubMed] [Google Scholar]
- Pike L.J., Han X., Gross R.W. 2005. Epidermal growth factor receptors are localized to lipid rafts that contain a balance of inner and outer leaflet lipids: a shotgun lipidomics study. J. Biol. Chem. 280:26796–26804 10.1074/jbc.M503805200 [DOI] [PMC free article] [PubMed] [Google Scholar]
- Qu Y., Rogers J.C., Chen S.F., McCormick K.A., Scheuer T., Catterall W.A. 1999. Functional roles of the extracellular segments of the sodium channel α subunit in voltage-dependent gating and modulation by β1 subunits. J. Biol. Chem. 274:32647–32654 10.1074/jbc.274.46.32647 [DOI] [PubMed] [Google Scholar]
- Ramu Y., Xu Y., Lu Z. 2006. Enzymatic activation of voltage-gated potassium channels. Nature. 442:696–699 10.1038/nature04880 [DOI] [PubMed] [Google Scholar]
- Ramu Y., Xu Y., Lu Z. 2007. Inhibition of CFTR Cl− channel function caused by enzymatic hydrolysis of sphingomyelin. Proc. Natl. Acad. Sci. USA. 104:6448–6453 10.1073/pnas.0701354104 [DOI] [PMC free article] [PubMed] [Google Scholar]
- Schmidt D., Jiang Q.X., MacKinnon R. 2006. Phospholipids and the origin of cationic gating charges in voltage sensors. Nature. 444:775–779 10.1038/nature05416 [DOI] [PubMed] [Google Scholar]
- Soucek A., Michalec C., Soucková A. 1971. Identification and characterization of a new enzyme of the group “phospholipase D” isolated from Corynebacterium ovis. Biochim. Biophys. Acta. 227:116–128 10.1016/0005-2744(71)90173-2 [DOI] [PubMed] [Google Scholar]
- Spassova M., Lu Z. 1998. Coupled ion movement underlies rectification in an inward-rectifier K+ channel. J. Gen. Physiol. 112:211–221 10.1085/jgp.112.2.211 [DOI] [PMC free article] [PubMed] [Google Scholar]
- Stith B.J., Hall J., Ayres P., Waggoner L., Moore J.D., Shaw W.A. 2000. Quantification of major classes of Xenopus phospholipids by high performance liquid chromatography with evaporative light scattering detection. J. Lipid Res. 41:1448–1454 [PubMed] [Google Scholar]
- Swartz K.J. 2008. Sensing voltage across lipid membranes. Nature. 456:891–897 10.1038/nature07620 [DOI] [PMC free article] [PubMed] [Google Scholar]
- Tambourgi D.V., Gonçalves-de-Andrade R.M., van den Berg C.W. 2010. Loxoscelism: From basic research to the proposal of new therapies. Toxicon. 56:1113–1119 10.1016/j.toxicon.2010.01.021 [DOI] [PubMed] [Google Scholar]
- Trimmer J.S., Cooperman S.S., Tomiko S.A., Zhou J.Y., Crean S.M., Boyle M.B., Kallen R.G., Sheng Z.H., Barchi R.L., Sigworth F.J., et al. 1989. Primary structure and functional expression of a mammalian skeletal muscle sodium channel. Neuron. 3:33–49 10.1016/0896-6273(89)90113-X [DOI] [PubMed] [Google Scholar]
- Vilin Y.Y., Makita N., George A.L., Jr, Ruben P.C. 1999. Structural determinants of slow inactivation in human cardiac and skeletal muscle sodium channels. Biophys. J. 77:1384–1393 10.1016/S0006-3495(99)76987-0 [DOI] [PMC free article] [PubMed] [Google Scholar]
- West J.W., Patton D.E., Scheuer T., Wang Y., Goldin A.L., Catterall W.A. 1992a. A cluster of hydrophobic amino acid residues required for fast Na+-channel inactivation. Proc. Natl. Acad. Sci. USA. 89:10910–10914 10.1073/pnas.89.22.10910 [DOI] [PMC free article] [PubMed] [Google Scholar]
- West J.W., Scheuer T., Maechler L., Catterall W.A. 1992b. Efficient expression of rat brain type IIA Na+ channel α subunits in a somatic cell line. Neuron. 8:59–70 10.1016/0896-6273(92)90108-P [DOI] [PubMed] [Google Scholar]
- Williams M.E., Brust P.F., Feldman D.H., Patthi S., Simerson S., Maroufi A., McCue A.F., Veliçelebi G., Ellis S.B., Harpold M.M. 1992. Structure and functional expression of an ω-conotoxin-sensitive human N-type calcium channel. Science. 257:389–395 10.1126/science.1321501 [DOI] [PubMed] [Google Scholar]
- Xu Y., Ramu Y., Lu Z. 2008. Removal of phospho-head groups of membrane lipids immobilizes voltage sensors of K+ channels. Nature. 451:826–829 10.1038/nature06618 [DOI] [PMC free article] [PubMed] [Google Scholar]
- Xu Y., Ramu Y., Lu Z. 2010. A shaker K+ channel with a miniature engineered voltage sensor. Cell. 142:580–589 10.1016/j.cell.2010.07.013 [DOI] [PMC free article] [PubMed] [Google Scholar]
- Xu Y., Ramu Y., Shin H.G., Yamakaze J., Lu Z. 2013. Energetic role of the paddle motif in voltage gating of Shaker K+ channels. Nat. Struct. Mol. Biol. 20:574–581 10.1038/nsmb.2535 [DOI] [PMC free article] [PubMed] [Google Scholar]
- Zheng H., Liu W., Anderson L.Y., Jiang Q.X. 2011. Lipid-dependent gating of a voltage-gated potassium channel. Nat Commun. 2:250 10.1038/ncomms1254 [DOI] [PMC free article] [PubMed] [Google Scholar]


