

Abstract
Schizophrenia is a complex disorder, and there is substantial evidence supporting a genetic etiology. Despite this, prior attempts to localize susceptibility loci have produced predominantly suggestive findings. A genome-wide scan for schizophrenia susceptibility loci in 22 extended families with high rates of schizophrenia provided highly significant evidence of linkage to chromosome 1 (1q21-q22), with a maximum heterogeneity logarithm of the likelihood of linkage (lod) score of 6.50. This linkage result should provide sufficient power to allow the positional cloning of the underlying susceptibility gene.
Schizophrenia is a serious neuropsychiatric illness affecting ~1% of the general population. Family, twin, and adoption studies have demonstrated that schizophrenia is predominantly genetic, with a high heritability (1). Segregation analyses have failed to clearly support a single model of inheritance, with the suggestion of several, possibly interacting, susceptibility loci (2). The existence of a spectrum of related psychiatric disorders has led to uncertainty over the most appropriate phenotype for use in genetic studies. The complex genetics, unclear role of environmental interactions, and phenotypic uncertainty have led to the view that significant genetic linkage will not be easily obtained (3). Of the complete genome scans for schizophrenia susceptibility loci published to date (4 –14), only one (8) has reported a significant linkage result, to chromosome 13q32, which was recently confirmed in our independent sample of families (15). Suggestive (although not significant) results have been obtained to many other chromosomal regions, but the multitude of these findings and the broad regions involved limit their usefulness as starting points for positional cloning.
We conducted a genome-wide search for loci contributing to risk for schizophrenia in a group of 22 families, selected for study because multiple relatives were clinically diagnosed with schizophrenia or schizoaffective disorder. Canadian families of Celtic (n = 21) or German (n = 1) descent were recruited for study if schizophrenic illness appeared to be segregating in a unilineal (one side of the family only), autosomal dominant manner (16, 17). An average of 13.8 individuals per family participated in the study, and five families had 20 to 29 members participating. An average of 3.6 individuals with schizophrenia or schizoaffective disorder participated per family, with 15 individuals with these diagnoses participating in the largest family. On average, two additional participating family members were diagnosed as affected under a broader definition of schizophrenia-related disorders (18). Family members diagnosed as affected spanned three generations in 27% of families. Individuals reported by history to be affected spanned three or four generations in 45% of families. Overall, 304 subjects were evaluated (18), and 288 subjects had DNA samples available. DNA samples were genotyped with 381 simple tandem repeat markers with an average heterozygosity of 0.76 and an average marker density of 9 centimorgans (cM) (19). Parametric linkage analyses were conducted (20), as they are more powerful than nonparametric methods (21, 22) and are robust methods for detecting linkage despite errors or simplifications in the analyzing model, as long as both a dominant and a recessive model are used (21–24). To minimize multiple tests, we selected four genetic models, dominant and recessive for each of a “narrow” and a “broad” diagnostic classification (18, 25). The narrow classification included the diagnoses of schizophrenia and chronic schizoaffective disorder; the broad classification included these and several schizophrenia-spectrum disorders (18). The parameters of the dominant and recessive genetic models were derived from population prevalence and twin concordance rates for schizophrenia and related spectrum disorders (25). Although these parameters are almost certainly not accurate, particularly because they model single-gene inheritance, parametric linkage analysis with single-gene models is a powerful method for detecting linkage to traits controlled by multiple interacting genes, even when certain parameters, such as penetrance, are set to arbitrary values (21–24).
The threshold to declare significance in linkage studies of complex disorders is the subject of debate (26 –28). So as to avoid increasing the number of false-positive results due to multiple testing, statistical corrections are required to account for analysis with multiple markers, multiple inheritance models and diagnostic classifications, and genetic heterogeneity. Unfortunately, the exact appropriate correction may be difficult to determine (26 –28). Alternatively, simulation studies of unlinked “replicates” can empirically determine how frequently any given logarithm of the likelihood of linkage (lod) score will occur in the absence of linkage, accurately accounting for multiple markers and models. Simulation studies with 2500 unlinked replicates were conducted to determine the lod scores corresponding to P = 0.05 (29). This produced a lod score threshold for significance of 3.3 under the hypothesis of homogeneity and 3.5 under the hypothesis of heterogeneity. Simulation studies with linked replicates were also conducted to assess the power of this sample to detect linkage under the four models used in this study (30). These demonstrated good power to detect linkage under all models when 75% or more of families were linked to a given disease locus (31).
A plot of two-point lod scores for the genome-wide scan is shown in Fig. 1. The highest lod score observed was 5.79 [P < 0.0002; (32)] under the narrow definition of illness and a recessive mode of inheritance with marker D1S1679, which maps to chromosome 1q22. Lod scores >2.0 were obtained with five adjacent markers from 1q, spanning a region of approximately 39 cM. Significant linkage was not detected to any other chromosome when two-point analysis was used. All two-point lod scores >1.5 are summarized in Table 1 (33).
Fig. 1.
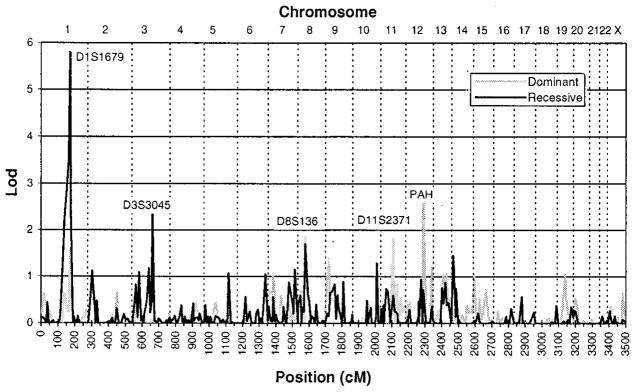
Two-point lod scores for the genome-wide scan. Affected and unaffected individuals in 22 families segregating schizophrenia were genotyped at 381 marker loci throughout the genome. Maximum two-point lod scores under the narrow definition (18) and the assumption of genetic heterogeneity are plotted as a function of marker location in centimorgans for both recessive and dominant models of inheritance. Chromosome number is designated at the top of the plot.
Table 1.
List of all markers with lod scores >1.5. The single phenotype and inheritance model producing the highest lod score is given for each marker. Zmax, maximum lod score; θ, recombination fraction; α, proportion of families linked to a given locus; N, narrow; B, broad; R, recessive; D, dominant.
| Marker | Chromosome location | Map location* | Model | Two-point analysis
|
Three-point analysis
|
||||||
|---|---|---|---|---|---|---|---|---|---|---|---|
| Homogeneity
|
Heterogeneity
|
Heterogeneity
|
|||||||||
| Zmax | θ | Zmax | θ | α | Zmax | α | Location of Zmax* | ||||
| Chromosome 1 | |||||||||||
| D1S1631 | 1p21 | 137 | NR | 2.13 | 0.2 | 2.19 | 0.1 | 0.65 | 2.57 | 0.75 | 147 |
| D1S3723 | 1p21-p13 | 141 | NR | 2.29 | 0.1 | 2.39 | 0.1 | 0.75 | 3.65 | 0.70 | 148 |
| D1S534 | 1p13 | 152 | NR | 2.90 | 0.1 | 2.90 | 0.1 | 1 | 3.65 | 0.70 | 147 |
| D1S1653 | 1q21-q22 | 164 | NR | 3.52 | 0.1 | 3.52 | 0.1 | 1 | 6.05 | 0.75 | 170 |
| D1S1679 | 1q22 | 171 | NR | 5.77 | 0.05 | 5.79 | 0.05 | 0.95 | 6.05 | 0.75 | 170 |
| D1S1677 | 1q22-q23 | 176 | NR | 2.15 | 0.1 | 2.26 | 0.1 | 0.80 | 5.72 | 0.60 | 171 |
| Chromosome 2 | |||||||||||
| D2S2952 | 2p24 | 18 | BR | 1.37 | 0.2 | 1.97 | 0.05 | 0.40 | 2.00 | 0.45 | 28 |
| D2S1400 | 2p23-p22 | 28 | BR | 1.70 | 0.2 | 1.98 | 0.05 | 0.60 | 2.42 | 0.65 | 18 |
| Chromosome 3 | |||||||||||
| D3S3045 | 3q13 | 124 | NR | 2.11 | 0.2 | 2.40 | 0.1 | 0.75 | 1.73 | 0.65 | 114 |
| Chromosome 7 | |||||||||||
| D7S1802 | 7p13 | 33 | ND | 0.80 | 0.2 | 1.03 | 0.05 | 0.55 | 1.59 | 1 | 54 |
| Chromosome 8 | |||||||||||
| D8S1106 | 8p22 | 26 | BD | 1.95 | 0.2 | 2.10 | 0.2 | 0.75 | 2.33 | 0.80 | 5 |
| D8S136 | 8p21 | 44 | BD | 2.09 | 0.2 | 2.16 | 0.2 | 0.80 | 2.80 | 0.90 | 65 |
| Chromosome 11 | |||||||||||
| D11S2371 | 11q13-q23 | 76 | ND | 0.56 | 0.2 | 1.84 | 0 | 0.55 | 1.88 | 0.55 | 76 |
| Chromosome 12 | |||||||||||
| PAH | 12q22-q24 | 109 | ND | 2.31 | 0.1 | 2.60 | 0 | 0.70 | 1.71 | 0.50 | 109 |
| Chromosome 13 | |||||||||||
| D13S317 | 13q22 | 64 | ND | 1.02 | 0.2 | 1.02 | 0.2 | 0.95 | 1.56 | 1 | 85 |
| D13S793 | 13q31-q32 | 76 | BR | 1.44 | 0.1 | 1.47 | 0.1 | 0.9 | 3.81 | 0.65 | 77 |
| D13S779 | 13q32 | 83 | BR | 1.87 | 0.1 | 2.41 | 0 | 0.55 | 2.34 | 0.45 | 83 |
| Chromosome 17 | |||||||||||
| D17S784 | 17p12-p11 | 117 | BR | 2.18 | 0.1 | 2.19 | 0.1 | 0.95 | 1.54 | 1 | 138 |
Distances from pter in centimorgans.
Parametric multipoint analyses of complex disorders must be approached with caution, as incorrect analysis models can exclude a true linked locus from the region between close flanking markers (34). However, multipoint analyses are useful for combating the practical limitations caused by uninformative marker typings, which can either inflate or deflate the lod score. With large, complex pedigrees, simultaneous analysis of multiple highly polymorphic marker loci can be computationally prohibitive, especially when large regions of the genome are scanned for linkage. We therefore conducted three-point analyses with adjacent marker loci and the disease locus for all markers in the genome scan and four-point analyses in the region of significant linkage on 1q. Mul-tipoint analysis with chromosome 1 markers produced a maximum lod score of 6.50 [P < 0.0002; (32)] between the markers D1S1653 and D1S1679, under the recessive-narrow model and with an estimated 75% of families linked to this locus (Fig. 2). Only multipoint analysis on chromosome 13 produced additional significant results, with a maximum lod score of 3.81 [P = 0.02; (32)] under the recessive-broad model at D13S793 with an estimated 65% of families linked to this region, consistent with our previous findings in these same families (15).
Fig. 2.

Multipoint lod scores for the schizophrenia susceptibility locus relative to markers in the 1q21-q23 region. Parametric four-point lod scores were calculated with the narrow defi-nition (18) and the markers D1S1653, D1S1679, and D1S1677 under the recessive model of inheritance. The results are plotted as a function of distance from D1S1653 under the assumption of homogeneity (100% of families linked) and heterogeneity (75% of families linked). In both cases, the maximum lod scores were located within the 12-cM interval between the markers D1S1653 and D1S1679, rising from a value of 5.89 (P < 0.0002) under homogeneity to 6.50 (P < 0.0002) under heterogeneity.
There have been suggestive linkage results for chromosome 1q22-q23 under autosomal recessive inheritance in one published (6), and one preliminary (35), genome scan. Studies showing association of schizophrenia with the Duffy blood group (36), a hetero-chromatin variant (37), a fragile site (38), and a potassium channel gene [KCNN3 (39)], provide further prior evidence for a susceptibility gene in this region. However, most genome scans and association studies have not led to significant results for the 1q21-q23 region or have provided suggestive linkage of major psychotic illness to the more distal regions of 1q25-q32 (40) or 1q32-q41 (14), perhaps due to the genetic heterogeneity of schizophrenia and/or low power of some studies.
This unequivocally significant linkage finding seems somewhat unexpected for schizophrenia, given the multiple challenges of this complex disorder. However, these results confirm the predictions of simulation studies that parametric linkage analysis with simple genetic models, when conducted under both a dominant and recessive mode of inheritance, is a powerful method for detecting linkage to susceptibility loci in complex disorders (21–24). Although nonparametric (NPL) methods as implemented in GENE-HUNTER or affected sibpair analysis are widely used, simulation studies indicate they are not as powerful (21, 22), and sample considerations may limit their utility. As many of the affected-relative pairs in this sample were not within sibships, affected sibpair analysis was not an appropriate choice. The large size of many of the extended families exceeded the capacity of GENE-HUNTER, limiting the utility of that analysis package. Although analysis with multiple other packages could facilitate cross-study comparisons, we have adopted the approach suggested by Risch and Botstein (27) and have reported the power of our study sample to detect linkage under the models tested as well as the significance level of positive results.
This study demonstrates the importance of careful family selection. Because of the time and effort required to identify and collect pedigrees with three or more affected individuals in multiple generations, most studies have focused on gathering large numbers of small nuclear families or pairs of affected siblings, increasing the chance of a clinically and genetically heterogeneous sample. As our simulation studies illustrate (30), power to detect linkage is greatly reduced when a significant proportion of the sample is unlinked to a particular locus. The population selected for study, the inclusion criteria, and fortuitous sample variation may have all combined to produce a group of families with a high proportion linked to the susceptibility locus on 1q21-q22. We are likely to have failed to detect linkage to any contributing loci that are present in less than half of the families we studied (30).
Multiple susceptibility loci are almost certainly involved in the etiology of schizophrenia, with significant evidence for an additional locus on 13q32, even within this set of families. The magnitude of the chromosome 1 linkage finding, coupled with the clear localization to the interval between the markers D1S1653 and D1S1679, should facilitate efforts to positional clone this susceptibility gene. It is hoped that better understanding of the genetic factors involved in this common, devastating disorder will lead to earlier and more effective interventions.
Acknowledgments
We would like to thank the participating families, whose contributions have made these studies possible; R. Forsythe and P. Forsythe for years of support; J. Hayter, M. Kahn, D. Little, J. Hogan and D. Hayden for technical assistance; J. Ott and V. Vieland for advice on statistical issues. Supported by the Medical Research Council of Canada (A.S.B., L.M.B., W.G.H.), the EJLB Foundation Scholar Research Programme (L.M.B.), the National Institute of Mental Health grant K08 MH01392 (L.M.B.), the Ontario Mental Health Foundation (A.S.B.), the Bill Jeffries Schizophrenia Endowment Fund (A.S.B.), Nova Scotia Schizophrenia Society (A.S.B.), and the Ian Douglas Bebensee Foundation (A.S.B.). W.G.H. is supported by a Vancouver Hospital Scientist Award. Genotyping services were provided by the Center for Inherited Disease Research (CIDR). CIDR is fully funded through a contract from the National Institutes of Health to Johns Hopkins University, Contract Number N01-HG-65403.
References and Notes
- 1.McGuffin P, Asherson P, Owen M, Farmer A. Br J Psychiatry. 1994;164:593. doi: 10.1192/bjp.164.5.593. [DOI] [PubMed] [Google Scholar]
- 2.Risch N. Am J Hum Genet. 1990;46:222. [PMC free article] [PubMed] [Google Scholar]
- 3.Straub RE, MacLean CJ, O’Neill FA, Walsh D, Kendler KS. Mol Psychiatry. 1997;2:148. doi: 10.1038/sj.mp.4000258. [DOI] [PubMed] [Google Scholar]
- 4.Coon H, et al. Am J Med Genet Neuropsychiatr Genet. 1994;54:59. [Google Scholar]
- 5.Moises HW, et al. Nature Genet. 1995;11:321. doi: 10.1038/ng1195-321. [DOI] [PubMed] [Google Scholar]
- 6.Shaw SH, et al. Am J Med Genet Neuropsychiatr Genet. 1998;81:364. [Google Scholar]
- 7.Levinson DF, et al. Am J Psychiatry. 1998;155:741. doi: 10.1176/ajp.155.6.741. [DOI] [PubMed] [Google Scholar]
- 8.Blouin JL, et al. Nature Genet. 1998;20:70. doi: 10.1038/1734. [DOI] [PubMed] [Google Scholar]
- 9.Cloninger CR, et al. Am J Med Genet Neuropsychiatr Genet. 1998;81:275. [Google Scholar]
- 10.Kaufmann CA, et al. Am J Med Genet Neuropsychiatr Genet. 1998;81:282. [Google Scholar]
- 11.Faraone SV, et al. Am J Med Genet Neuropsychiatr Genet. 1998;81:290. [Google Scholar]
- 12.Rees MI, et al. Mol Psychiatry. 1999;4:353. doi: 10.1038/sj.mp.4000521. [DOI] [PubMed] [Google Scholar]
- 13.Williams NM, et al. Hum Mol Genet. 1999;8:1729. doi: 10.1093/hmg/8.9.1729. [DOI] [PubMed] [Google Scholar]
- 14.Hovatta I, et al. Am J Hum Genet. 1999;65:1114. doi: 10.1086/302567. [DOI] [PMC free article] [PubMed] [Google Scholar]
- 15.Brzustowicz LM, et al. Am J Hum Genet. 1999;65:1096. doi: 10.1086/302579. [DOI] [PMC free article] [PubMed] [Google Scholar]
- 16.Bassett AS, Collins EJ, Nuttall SE, Honer WG. Schizophr Res. 1993;11:9. doi: 10.1016/0920-9964(93)90033-f. [DOI] [PMC free article] [PubMed] [Google Scholar]
- 17.Bassett AS, Honer WG. Am J Hum Genet. 1994;54:864. [PMC free article] [PubMed] [Google Scholar]
- 18.Informed consent was obtained from all subjects after an explanation of possible consequences. Protocols were approved by the Institutional Review Boards of Rutgers University and the University of Toronto. Direct interviews conducted with the Structured Clinical Interview from DSM-III-R (SCID-I) for major disorders and the SCID-II for personality disorders, collateral information, and medical records were used for 297 subjects to make consensus diagnoses based on DSM-III-R criteria from American Psychiatric Association. Diagnostic and Statistical Manual of Mental Disorders: DSM-III-R. Vol. 3. American Psychiatric Association; Washington, DC: 1987. rev. ed.. Details of the diagnostic and ascertainment methods have been described (16, 17). Seven additional deceased subjects received consensus diagnoses on the basis of medical records and collateral information. The diagnostic classifications “narrow” and “broad” were used, with 79 and 123 affected individuals in each category, respectively. Individuals were considered affected under the narrow diagnostic classification if they were diagnosed with schizophrenia or chronic schizoaffective disorder. Individuals were considered affected under the broad diagnostic classification if they had been diagnosed with one of those disorders or with a nonaffective psychotic disorder, schizotypal personality disorder, or paranoid personality disorder. Two subjects were coded as diagnosis unknown, because mental retardation hindered full assessment. Five of the deceased subjects were coded as affected under the broad diagnostic classification but unknown under the narrow classification, as conclusive narrow diagnostic elements could not be obtained. Full diagnoses were available on the remaining 297 subjects, and all individuals not categorized as affected under a given diagnostic scheme were classified as unaffected.
- 19.DNA was extracted from blood samples or lymphoblastoid cell lines using the GenePure system (Gentra Systems). DNA from each subject was genotyped by means of 381 markers from the Weber version 6.0 Screening Set. Genotyping was conducted in our laboratory and the laboratories of the Center for Inherited Disease Research (CIDR; Johns Hopkins University, Baltimore, MD). In our laboratory, genotypes were generated by polymerase chain reaction (PCR) amplification incorporating radiolabeled dCTP. Sample handling, PCR amplification, gel electrophoresis, and genotype interpretation procedures have been described [ Brzustowicz LM, et al. Am J Hum Genet. 1997;61:1388. doi: 10.1086/301623.]. Genotype generation by CIDR was based on automated fluorescent microsatellite analysis, with further details available at the CIDR Web site [www.cidr.jhmi.edu/].
- 20.Standard parametric likelihood analysis was performed by means of FASTLINK [ Cottingham RW, Jr, Idury RM, Schaffer AA. Am J Hum Genet. 1993;53:252.] for two-point linkage and VITESSE [ O’Connel JR, Weeks DE. Nature Genet. 1995;11:402. doi: 10.1038/ng1295-402.] for multi-point linkage analysis. Multipoint analysis has the advantage of utilizing data from multiple linked markers to maximize the information in a given pedigree and may also provide better localization of the linked locus. The admixture test as implemented in HOMOG [41, pp. 220–226] was used to test for genetic heterogeneity. To minimize inaccuracies due to errors in pedigree structure, including undetected nonpaternity, branches of extended pedigrees that were connected through more than one individual without available DNA were removed from the main pedigrees and analyzed as separate pedigrees. This resulted in three small branches (total of 23 individuals) being removed from three pedigrees. After this pruning, 89 individuals with no diagnostic or genotype information were needed to accurately represent the pedigree structures of the entire dataset.
- 21.Durner M, Vieland VJ, Greenberg DA. Am J Hum Genet. 1999;64:281. doi: 10.1086/302181. [DOI] [PMC free article] [PubMed] [Google Scholar]
- 22.Abreu PC, Greenberg DA, Hodge SE. Am J Hum Genet. 1999;65:847. doi: 10.1086/302536. [DOI] [PMC free article] [PubMed] [Google Scholar]
- 23.Vieland VJ, Greenberg DA, Hodge SE. Hum Hered. 1993;43:329. doi: 10.1159/000154155. [DOI] [PubMed] [Google Scholar]
- 24.Greenberg DA, Abreu P, Hodge SE. Am J Hum Genet. 1998;63:870. doi: 10.1086/301997. [DOI] [PMC free article] [PubMed] [Google Scholar]
- 25.When the narrow diagnostic classification was used, the dominant model was schizophrenia susceptibility allele frequency (pA) = 0.0045, penetrance of disease (f) of 0.75, 0.50, and 0.001 for disease homozygotes (AA), heterozygotes (Aa), and normal homozygotes (aa), respectively; the recessive model was pA = 0.065, f (AA) = 0.50, f (Aa) = 0.0015, and f(aa) = 0.0015. Under the broad diagnostic classification, the dominant model was pA = 0.007, f (AA) = 0.90, f(Aa) = 0.80, and f(aa) = 0.009 and the recessive model was pA = 0.10, f(AA) = 0.60, f(Aa) = 0.01, and f(aa) = 0.01. For X-linked markers, the same penetrances were used for females, with f(aa) used for f(a) and f(Aa) used for f(A) for males for the dominant models, and f(AA) used for f(A) for the recessive models. Marker allele frequencies were estimated with a set of 30 unrelated subjects from these families.
- 26.Lander E, Kruglyak L. Nature Genet. 1995;11:241. doi: 10.1038/ng1195-241. [DOI] [PubMed] [Google Scholar]
- 27.Risch N, Botstein D. Nature Genet. 1996;12:351. doi: 10.1038/ng0496-351. [DOI] [PubMed] [Google Scholar]
- 28.Morton NE. Am J Hum Genet. 1998;62:690. doi: 10.1086/301741. [DOI] [PMC free article] [PubMed] [Google Scholar]
- 29.We generated 2500 unlinked “replicates” (datasets with the pedigree structures and diagnoses of the actual study coupled with genotype data simulated without regard to diagnostic status) of the full genome scan using SIMULATE [ Terwilliger JD, Speer M, Ott J. Genet Epidemiol. 1993;10:217. doi: 10.1002/gepi.1370100402.]. Analysis was as for the actual study data (20), except that only two-point analysis was conducted. Two distributions of maximum lod scores were constructed, using the highest score from each replicate under homogeneity (LOD) and under heterogeneity (HLOD). The highest score obtained was 5.08. The P values corresponding to LODs and HLODs of 3, 4, and 5 were calculated from the distributions and BINOM was used to determine the 95% confidence intervals (CIs) for those values [(41), pp. 48–50]. The P values [95% CI] for LODs of 3, 4, and 5 were 0.099 [0.087–0.11], 0.012 [0.0078–0.017], and 0.0008 [0.0001–0.0029], respectively. For HLODs of 3, 4, and 5 the P values were 0.16 [0.14–0.17], 0.016 [0.012–0.022], and 0.0008 [0.0001–0.0029], respectively. The estimates for a score of 5 were based on only two observations, producing the wide CI, and reflecting the difficulty in estimating rare events.
- 30.Linked replicates were generated using SLINK [ Ott J. Proc Natl Acad Sci USA. 1999;86:4175.Weeks DE, Ott J, Lathrop GM. Am J Hum Genet. 1990;47:A204.]. A single marker 5 cM from the disease gene and with four alleles of equal frequency was simulated. Each of the four genetic models (25) was used to generate 250 replicates with 100%, 95%, 90%, 75%, or 50% of families linked. Two-point analysis was conducted on each replicate with all four generating models under homogeneity and heterogeneity. As expected, the highest expected lod (ELOD) scores were obtained when the analysis model matched the generating model. Incorrect mode of inheritance reduced the ELODs much more than incorrect diagnostic model (31). Power to detect linkage at P = 0.05 with the correct model was excellent (>75%) under all models with 90% or more of families linked. With 100% of families linked, even the least powerful model, recessive-narrow, produced an ELOD of 5.6, with 40% of replicates producing a lod of 6 or higher. Power for all models dropped to 50 to 75% when 75% of families were linked. Power to detect linkage was very poor (<35%) when only 50% of families were linked, regardless of the model used.
- 31.Supplementary data on the power simulations can be found in Web table 1 at www.sciencemag.org/feature/data/1047911.shl
- 32.It is impractical to use simulations to estimate the probability of very rare events, such as obtaining a high lod score by chance. Therefore, the significance of lod scores >5 was determined by statistical methods. Twice the natural logarithm of the likelihood ratio asymptotically approaches the chi-square distribution as sample size increases. The simulation results under no linkage were used to test the adequacy of the chi-square approximation for this study sample. As marker density was less than 8 cM, the 381 markers were treated as independent tests, as were the two modes of inheritance [(41), pp. 75–79]. As the two diagnostic classifications were not independent, bounding P values were calculated from the chi-square with 1 d.f. by considering these as either one or two tests. For a lod of 3, under homogeneity, this produced a range for the P value of 0.077–0.155, which contained the simulation-derived P value estimate of 0.099. Similar results confirming the adequacy of the chi-square were obtained for lods of 4 and 5. Under heterogeneity the appropriate chi-square has >1 but <2 d.f., so the same approach of calculating bounding values for the P value was used, producing similar agreement with the results of the simulations. For a lod of 6.50 under heterogeneity, this produced a range for the P value of 0.00002 to 0.0002. Although the simulation results suggest that the actual P value is much closer to the smaller end of this interval, P values were conservatively reported as less than the calculated upper bound.
- 33.Supplementary data on all two-point analyses can be found in Web table 2 at www.sciencemag.org/feature/data/1047911.shl
- 34.Risch N, Giuffra L. Hum Hered. 1992;42:77. doi: 10.1159/000154047. [DOI] [PubMed] [Google Scholar]
- 35.Gurling HMD, et al. Mol Psychiatry. 1999;4:S4. [Google Scholar]
- 36.Saha N, Tay JS, Tsoi WF, Kua EH. Genet Epidemiol. 1990;7:303. doi: 10.1002/gepi.1370070408. [DOI] [PubMed] [Google Scholar]
- 37.Kosower NS, et al. Am J Med Genet. 1995;60:133. doi: 10.1002/ajmg.1320600209. [DOI] [PubMed] [Google Scholar]
- 38.Fananas L, Fuster C, Guillamat R, Miro R. Am J Psychiatry. 1997;154:716. doi: 10.1176/ajp.154.5.716a. [DOI] [PubMed] [Google Scholar]
- 39.Dror V, et al. Mol Psychiatry. 1999;4:254. doi: 10.1038/sj.mp.4000508. [DOI] [PubMed] [Google Scholar]
- 40.Detera-Wadleigh SD, et al. Proc Natl Acad Sci USA. 1999;96:5604. doi: 10.1073/pnas.96.10.5604. [DOI] [PMC free article] [PubMed] [Google Scholar]
- 41.Ott J. Analysis of Human Genetic Linkage. 3. Johns Hopkins Univ. Press; Baltimore: 1999. [Google Scholar]