Abstract
Background
Sensitivity of standard urine cytology for detecting urothelial carcinoma of the bladder (UCB) is low, attributable largely to its inability to process entire samples, paucicellularity, and presence of background cells.
Objective
Evaluate performance and practical applicability of a novel portable microfiltration device for capture, enumeration, and characterization of exfoliated tumor cells in urine, and compare it with standard urine cytology for UCB detection.
Methods
A total of 54 urine and bladder wash samples from patients undergoing surveillance for UCB were prospectively evaluated by standard and microfilter-based urine cytology. Head-to-head comparison of quality and performance metrics, and cost effectiveness was conducted for both methodologies.
Results
Five samples were paucicellular by standard cytology; no samples processed by microfilter cytology were paucicellular. Standard cytology had 33.3% more samples with background cells that limited evaluation (p<0.001). Microfilter cytology was more concordant (κ=50.4%) than standard cytology (κ=33.5%) with true UCB diagnosis. Sensitivity, specificity, and accuracy were higher for microfilter cytology compared to standard cytology (53.3%/100%/79.2%, versus 40%/95.8%/69.9%, respectively). Microfilter-captured cells were amenable to downstream on-chip molecular analyses. A 40ml sample was processed in under 4 minutes by microfilter cytology compared to 5.5 minutes by standard cytology. Median microfilter cytology processing and set-up costs were approximately 63% cheaper and 80 times lower than standard cytology, respectively.
Conclusions
The microfiltration device represents a novel non-invasive UCB detection system that is economical, rapid, versatile, and has potentially better quality and performance metrics than routine urine cytology, the current standard-of-care.
Keywords: Bladder cancer, Nanotechnology, Urine cytology, Screening, Surveillance
INTRODUCTION
Urothelial carcinoma of the bladder (UCB), a common malignancy, accounts for one of the highest management costs per patient of any cancer.1,2 Non-invasive tumors, the most common UCB subtype, are treated with bladder-sparing surgeries and are at high risk for recurrence.3 Guidelines therefore demand frequent, long-term follow-up by cytology and cystoscopy.4,5 Non-invasive UCB detection techniques including standard urine cytology and adjunct molecular tests have been unable to substitute or reduce the need for cystoscopy, leading to steady rise in its use with increasing financial burden on the healthcare system.6 Standard cytology is limited by its sensitivity, often due to paucicellularity and presence of confounding background non-urothelial cells.7 An alternate sensitive, rapid, and cost-effective UCB detection and surveillance assay would therefore be beneficial.
This prospective, proof-of-concept study describes the development of a novel microfilter-based device for capture, on-chip enumeration, and characterization of exfoliated tumor cells from urine of subjects undergoing screening or surveillance for UCB. The principle of cell-size-based capture is used to trap and enrich larger tumor cells on a small surface area, while smaller background-blood cells pass through the filter. The goal was to determine whether microfilter-based cytology was at least comparable, if not superior, to standard urine cytology with respect to performance metrics, processing time, and costs.8
MATERIALS AND METHODS
Microfiltration device fabrication
1cm×1cm transparent parylene microfilter membranes of 10μm thickness were precision-engineered by photolithography as described previously.9 After iterative testing to optimize filtration efficacy and cytological evaluation, a 6mm×6mm filtration area with 90,000 evenly distributed circular pores of 7.5μm diameter was constructed; center-to-center distance between adjacent pores was 20μm (Figure 1). Each microfilter was sandwiched between two polydimethylsiloxane slabs with a central area cut out to accommodate it, placed within an acrylic housing device and clamped at opposite ends to create a leak-proof cassette. 20ml syringe containing the sample was attached to the upper acrylic jig’s luer lock, and filtrate flowed into a beaker from an outlet at the cassette’s bottom.
Figure 1. Illustration of microfilter device.
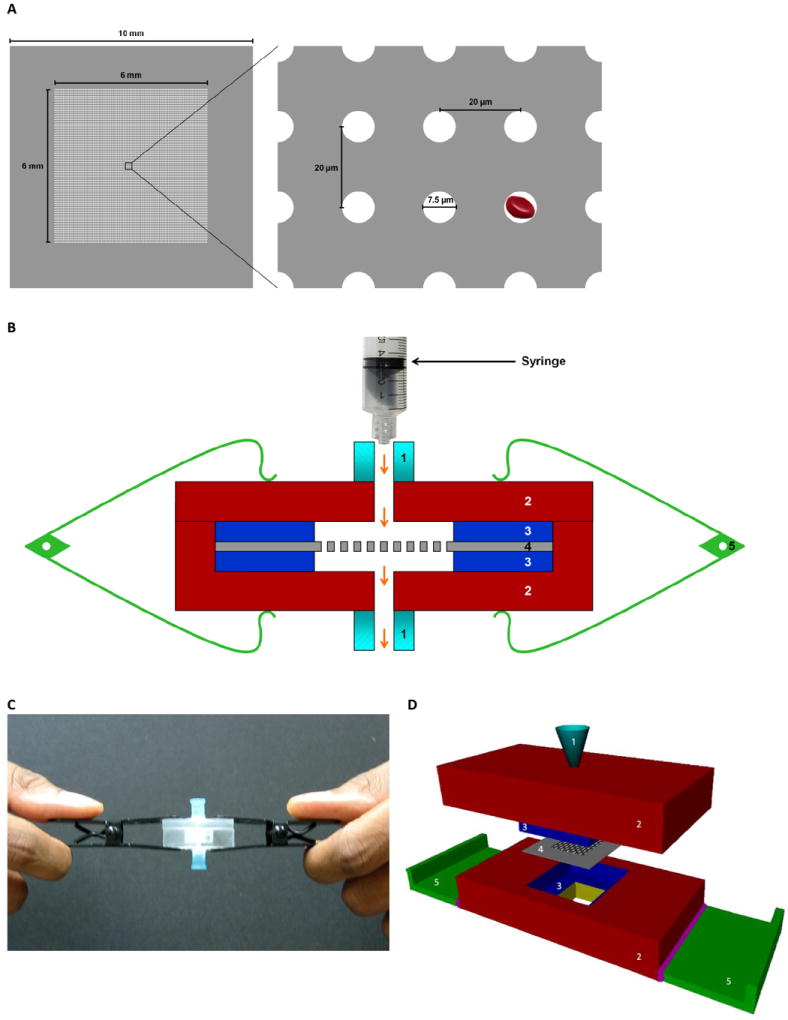
(A) Schematic shows the parylene microfilter membrane (left panel) having an effective filtration area of 6 mm × 6 mm with a matrix of 300 × 300 evenly distributed pores. Each circular pore is 7.5 μm in diameter, with center-to-center distance of 20 μm between adjacent pores (right panel). As depicted, an average-sized RBC can pass through the pores easily. (B) Cross-sectional representation of the device shows the parylene microfilter sandwiched between two layers of polydimethylsiloxane enclosed in an acrylic housing, and clamped at both ends. Arrows indicate direction of fluidic flow. (C) shows the currently used microfilter device, and (D) shows a conceptual design of the second generation of the device where the parylene microfilter is encased within a self-contained acrylic housing unit. Labels: 1, luer lock connector port; 2, acrylic housing; 3, polydimethylsiloxane slab; 4, parylene microfilter; 5, clamp.
Cell line
T24 bladder cancer cells were propagated in McCoy’s 5A medium supplemented with 50 units/ml of penicillin and streptomycin, and 10% fetal bovine serum.
Sample acquisition and processing
Voided urine and bladder wash samples from patients undergoing surveillance for UCB were collected prospectively under an Institutional Review Board-approved protocol. Bladder washings were also collected from confirmed UCB patients to better estimate sensitivity and potential qualitative differences between both cytology methodologies. Voided urine was also collected from normal donors with no evidence of UCB. Informed consent was obtained from all subjects. Cystoscopy-guided biopsy results were considered confirmatory for UCB diagnosis.
To optimize a fixation protocol that maintained cellular morphology while passing urine through the microfilter, varying concentrations and fixation times for ethanol, the standard fixative for urine cytology, were tested on normal urine spiked with T24 cells. 25% ethanol was identified as most optimal, and was also ideal for standard cytology.
For processing, 40ml sample was diluted 1:1 in phosphate buffered saline and ethanol, and incubated on rotator at room temperature for 20 minutes. Samples were then equally divided and processed by both methodologies, or stored at 4°C. For standard cytology, 40ml diluted sample was centrifuged for 10 minutes at 2,500 rotations per minute (rpm), and 2-3 sediment drops were cytocentrifuged onto a glass slide at 12,500 rpm for 2 minutes per routine protocol. For microfilter cytology, diluted sample was passed through the microfiltration device under steady low pressure until 40ml was processed or filtration pressure increased. Microfilter was then disengaged from the cassette and placed on a positively-charged glass slide. Slides containing cytocentrifuged samples and filters then underwent routine Papanicolaou (Pap) staining.10
Cytological interpretation
Slides were evaluated and re-reviewed by a cytopathologist and genitourinary pathologist, blinded to clinical diagnosis. Per standard criteria, samples were classified as: (1) paucicellular, no tumor cells identified, (2) normal, (3) atypia, favor reactive, (4) atypia, rule out low-grade, (5) atypia, rule out high-grade, or (6) highly suspicious for malignancy.11-13 For binary categorization, groups 1-3 were considered negative, and groups 4-6 were considered positive for presence of carcinoma. To evaluate confounding effects of background red (RBCs) and white (WBCs) blood cells, a semi-quantitative categorization was adopted: (1) no background cells present, (2) background cells present, not affecting evaluation, (3) background cells present, moderately limiting evaluation, and (4) background cells present, severely limiting evaluation.
Fluorescence in situ hybridization (FISH)
UroVysion FISH (Abbott Molecular, Des Plaines, IL, USA) was performed on microfilter-captured tumor cells to detect anueploidies of chromosomes 3, 7, 17, and 9p21 deletions per manufacturer’s instructions.14 Number of probe signals in individual tumor cells was counted.
Reverse transcription polymerase chain reaction (RT-PCR)
Following on-chip lysis of microfilter-captured T24 cells, total RNA was extracted using RNeasy kit (Qiagen, Valencia, CA, USA). Following cDNA synthesis, RT-PCR was performed to assay for glyceraldehyde 3-phosphate dehydrogenase (GAPDH) housekeeping gene. Transcript was visualized by agarose-gel electrophoresis.
Data analysis
The primary aim was to determine any qualitative and performance superiority of microfilter cytology over standard cytology for UCB detection. Associations between categorical variables were analyzed using contingency tables. Concordance between binary cytologic calls and definitive UCB diagnosis was assessed by κ statistic.15 Logistic regression and areas under receiver operating characteristic (ROC) curves were used to compare performance accuracies. Analyses were performed using SPSS 17.0. All p-values are two-sided; p≤ 0.05 was considered statistically significant.
The secondary aim was to assess the practical utility of microfilter-based cytology. Cost comparison analysis was performed to determine differences in logistical, procedural, and equipment-related expenses as described previously.16 Costs were calculated assuming samples were transported to a reference laboratory from community-based centers within a state, and maximum number of samples were shipped and processed to optimally use available logistics.
RESULTS
Microfilter processing capacity
Centrifuge capacity limits standard cytology to only process 40ml of diluted sample per case. To estimate the volume that the microfilter could process, normal urine spiked with 135 to 150,000 T24 cells were filtered. Volumes and concentrations at which microfilter clogging, as observed by increased filtration pressure, occurred were noted. For a 90,000-pore microfilter, up to 200ml of donor urine spiked with up to 30,000 cells could be filtered without clogging.
Patient characteristics and cytology quality
Excluding normal specimens, the study included 54 test samples (16 voided urines, 38 bladder washes) from 44 patients. 33 (75%) patients were male (median age, 66.5 years; range, 42-83 years). 22 (50%) patients were diagnosed with UCB, which accounted for 30 (55.6%) samples. Of these, 15 (50%) and 9 (30%) samples corresponded to stage ≤T1 and low-grade tumors, respectively. Sample source (voided urine or bladder wash) or interval between collection and processing (median, 3 days; range, 15 minutes-21 days) did not affect either cytology technique (Supplementary Table 1). For standard cytology, up to 10 diluted samples could be processed simultaneously in 55 minutes. For microfilter cytology, a 40ml diluted sample could be processed in no more than 4 minutes.
5 (9.3%) samples were designated “paucicellular, no tumor cells identified” by standard cytology; no samples processed by microfilter cytology were deemed paucicellular. Microfilter-based cytology allowed capture and clear visualization of several malignant cell clusters in all cases while eliminating background RBCs and WBCs in the filtrate (Figure 2A,B). The procedure demonstrated greater tumor cell enrichment with minimal background cells (Figure 2C). In contrast, standard cytology had substantially more background cells, especially in patients with macroscopic hematuria (Figure 2D). More samples processed by standard cytology (n=22, 40.7%) had background cells that moderately or severely limited evaluation than microfilter cytology (n=4, 7.4%) (p<0.001, Figure 3).
Figure 2. Representative photomicrographs of microfilter and standard urine cytology.
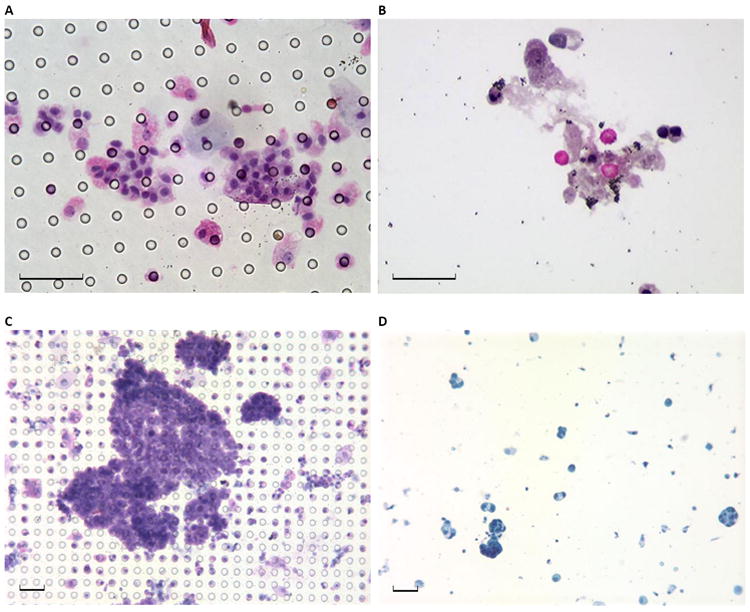
(A) Pap stained urine cytology preparation from a 47 year old male patient who underwent evaluation for microhematuria and was subsequently diagnosed with low-grade bladder cancer shows tumor cell enrichment with no background cells on the microfilter, and (B) filtrate from the same sample shows RBCs and WBCs that were not trapped by the microfilter and do not contaminate the field. (C) Pap stained urine cytology preparation from a 54 year old male patient with bladder cancer shows several clusters of easily identifiable malignant cells captured on the microfilter, while (D) standard urine cytology from the same patient shows sparsely distributed cells, confounding normal blood cells and non-specific background elements. Black scale bar represents 40 μm.
Figure 3. Effect of background cells on standard and microfilter-based urine cytology evaluation.
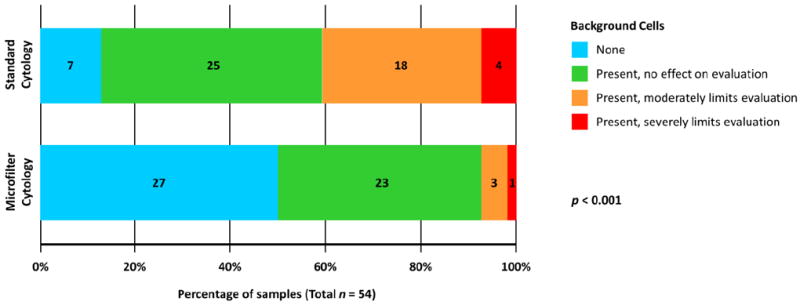
Based on the effects of confounding normal blood cells on cytology evaluation, samples assessed by each methodology were categorized into four groups. The percentages of samples in each group are plotted along the horizontal axis, and numbers of samples within individual groups are noted in their respective bars. Significantly higher proportion of samples processed by standard cytology had background cells that moderately or severely limited evaluation than microfilter-based cytology (p < 0.001).
Performance comparisons
An effort was made to examine whether microfilter cytology was at least equivalent to standard cytology for identifying UCB. Cystoscopy-guided biopsy was the benchmark for true UCB diagnosis. Of five cases that were paucicellular by standard cytology, two were categorized as highly suspicious for malignancy by microfilter cytology; UCB was detected in these cases clinically.
While true UCB diagnosis was associated with binary calls made by standard (p=0.003) and microfilter-based (p<0.001) cytology, κ was higher for the latter (50.4% versus 33.5%), implying greater degree of concordance of microfilter cytology with actual diagnosis (Table 1). While microfilter-based and standard cytology had comparable specificities (100% versus 95.8%), sensitivity was relatively higher for the former (53.3% versus 40%). Accuracy of predicting UCB presence, as measured by area under ROC curve, was 79.2% for microfilter-based versus 69.9% for standard cytology (Figure 4).
Table 1.
Performance metrics of standard urine cytology and microfilter-based urine cytology for bladder cancer detection.
| n | Standard Cytology
|
Microfilter Cytology
|
|||||
|---|---|---|---|---|---|---|---|
| Negative* n (row %) | Positive n (row %) | p | Negative* n (row %) | Positive n (row %) | p | ||
| Definitive Diagnosis | 0.003† | <0.001† | |||||
| No bladder cancer | 24 | 23 (95.8) | 1 (4.2) | 24 (100) | 0 (0.0) | ||
| Bladder cancer | 30 | 18 (60.0) | 12 (40.0) | 14 (46.7) | 16 (53.3) | ||
|
|
|
|
|||||
| Kappa Statistic | 33.5% | 0.002 | 50.4% | <0.001 | |||
| Sensitivity (95% CI) | 40.0% (22.7%–59.4%) | 53.3% (34.3%–71.7%) | |||||
| Specificity (95% CI) | 95.8% (78.9%–99.9%) | 100% (85.8%–100%) | |||||
Includes paucicellular samples.
By Fisher’s exact test.
Abbreviation: CI, confidence interval.
Figure 4. Accuracy of bladder cancer detection by standard and microfilter cytology.
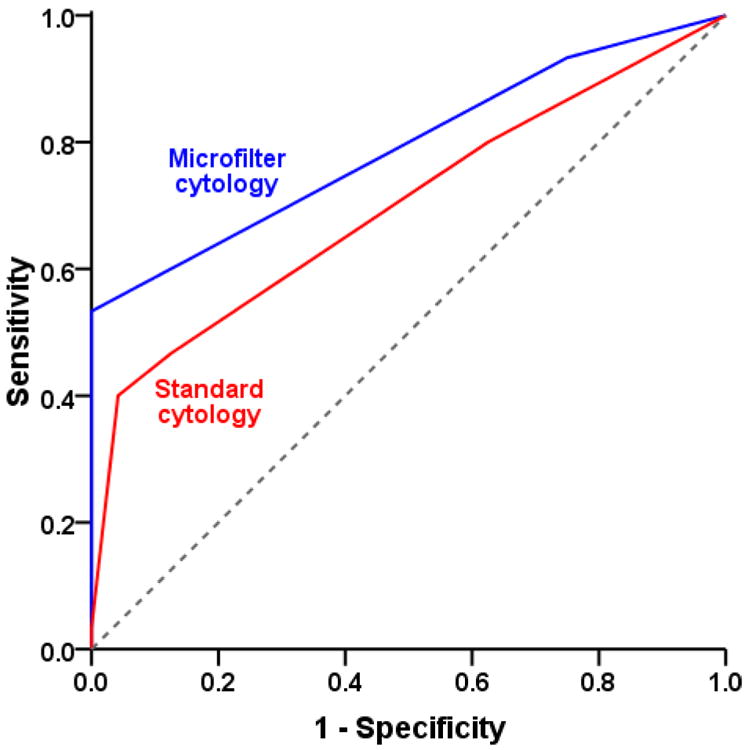
Predictive accuracy, as measured by area under a receiver operating characteristic curve, was assessed for both methodologies. The accuracy for standard cytology (red) was 69.9%, while that for microfilter cytology (blue) was 79.2%.
Among UCB samples, microfilter-based cytology detected an additional 13.3% and 13.4% of stage ≤T1 and >T1 tumors, respectively, over standard cytology. It also detected an additional 11.2% and 14.3% of low-grade and high-grade tumors, respectively, compared to standard cytology (Supplementary Figure 1).
Based on the six-tier classification scale, 26 (48.1%) samples were categorized identically by standard and microfilter cytology. 36 (66.7%) and 11 (20.4%) samples were categorized as negative and positive for UCB, respectively, by both techniques (p<0.001, Table 2). 7 samples had discrepant interpretations by the two techniques, of which microfilter cytology correctly identified UCB presence in 6 (85.7%) samples.
Table 2.
Associations of diagnostic calls between standard urine cytology and microfilter-based urine cytology techniques.
| All Samples
|
True Negative Samples
|
True Positive Samples
|
|||||||
|---|---|---|---|---|---|---|---|---|---|
| n | Negative by microfilter cytology† n (row %) | p | n | Negative by microfilter cytology† n (row %) | p | n | Negative by microfilter cytology† n (row %) | p | |
| Standard Cytology | <0.001 | NC | <0.001 | ||||||
| Negative* | 41 | 36 (87.8) | 23 | 23 (100) | 18 | 13 (72.2) | |||
| Positive | 13 | 2 (15.4) | 1 | 1 (100) | 12 | 1 (8.3) | |||
Includes paucicellular samples.
Remaining samples in each row were categorized as positive by microfilter cytology.
p-value calculated by Fisher’s exact test.
Abbreviation: NC, not computed.
On-chip processing for genetic analysis
As proof-of-concept evaluation of the microfilter for specialized imaging, normal urine spiked with T24 cells were filtered following fixation, and UroVysion FISH was performed directly on the cells captured on microfilter. Figure 5 demonstrates evidence of aneuploidy involving chromosomes 3, 7 and 17 in the captured cells.
Figure 5. On-chip fluorescent in situ hybridization on captured tumor cells for chromosomal alterations.
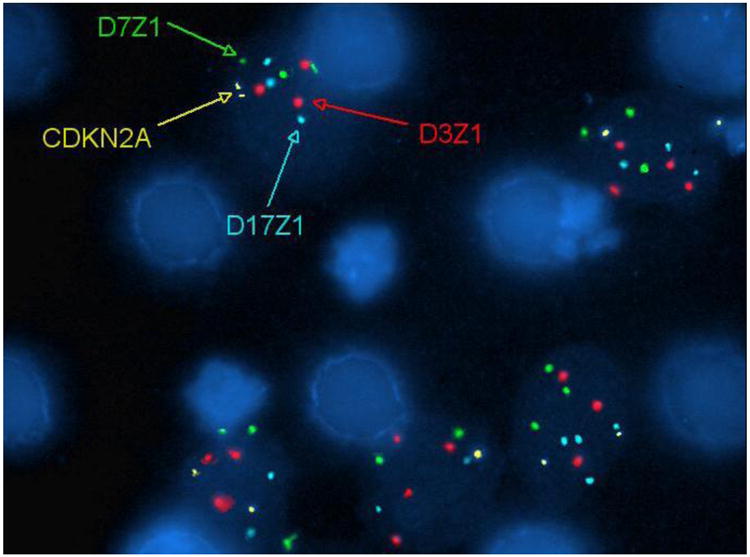
UroVysion FISH was performed on T24 cells spiked into normal urine that were captured on-chip. A DNA probe panel for the centromeric regions of chromosomes 3 (D3Z1, red), 7 (D7Z1, green) and 17 (D17Z1, aqua), and the 9p21 region (CDKN2A, gold) was used. Aneuploidy involving chromosomes 3, 7 and 17 are observed. The microfilter architecture does not interfere with the visualization of the FISH probes.
To examine feasibility of transcriptomic evaluation of microfilter-captured cells, 20ml normal urine samples spiked with 3.5×10⁴ T24 cells fixed in ethanol were processed by microfilter and routine cytocentrifugation. Following on-chip cell lysis, RT-PCR using the resulting lysate showed presence of GAPDH transcripts, as evidenced by an electrophoretic band that was comparable to that obtained by cytocentrifugation (Figure 6). These experiments indicate that downstream molecular analyses can be performed using microfilter-captured tumor cells on-chip.
Figure 6. Reverse transcription polymerase chain reaction of genomic material from on-chip captured tumor cells.
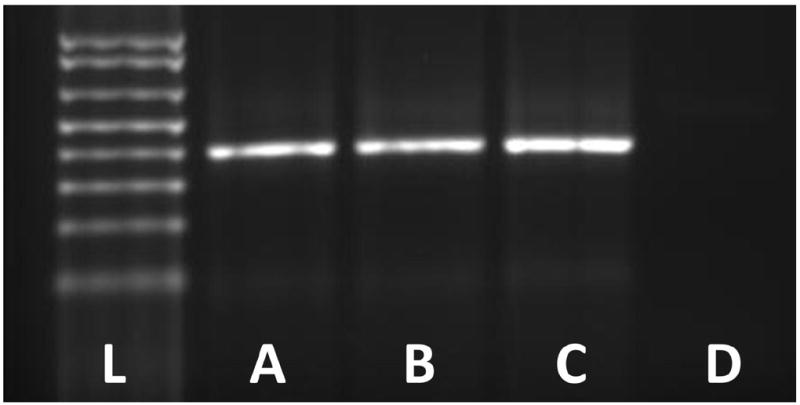
Gel electrophoresis to visualize transcripts of the GAPDH housekeeping gene was performed using total RNA extracted from the lysates of (A) T24 bladder cancer cells serving as positive control, (B) T24 cells spiked in 20ml normal urine, fixed in 25% ethanol, and processed by the microfilter, (C) T24 cells spiked in 20ml normal urine, fixed in 25% ethanol, and processed by routine cytocentrifugation, and (D) 20ml normal urine with 25% ethanol processed by routine cytocentrifugation serving as negative control. For each reaction using T24 cells, a total of 3.5×10⁴ cells were used. For microfilter processing, captured cells were lysed on-chip. (L) represents the DNA ladder. The PCR product size corresponds to 391 base pairs.
Cost-efficiency analysis
To evaluate the economic feasibility of microfilter-based urine cytology, an analysis of basic equipment and running costs was performed (Table 3). Median transportation and processing costs were $21.97 and $8.14 for standard and microfilter cytology, respectively. This difference was attributable, in large part, to shipping expenses – standard cytology necessitates expedited shipping of bulky liquid samples from point-of-collection to a reference laboratory, increasing costs substantially compared to shipping processed microfilters in envelopes. Median laboratory equipment costs for standard cytology ($11,227.63) were over 80 times higher than microfilter cytology ($136.40). Standard cytology also necessitates batch-processing of samples to run equipment at full capacity.
Table 3.
Cost analysis of standard urine cytology versus microfilter-based urine cytology techniques.
| Item | Standard Cytology
|
Microfilter Cytology
|
||||
|---|---|---|---|---|---|---|
| Description | Cost per sample | Cost per unit | Description | Cost per sample | Cost per unit | |
| Sample Transportation | ||||||
| Packaging | • Plastic specimen container | 0.40 | • Regular envelope | 0.02 | ||
| • Specimen transport box | 1.15 | • Biohazard specimen bag | 0.20 | |||
| Shipping 1 | • Next Day Air delivery | 14.87 (6.30-44.27) | • Next Day Air delivery | 3.57 (0.95-13.42) | ||
| Subtotal | 16.42 (7.85-45.82) | 3.79 (1.17-13.64) | ||||
| Sample Preparation | ||||||
| Cytotechnologist 2 | • For sample loading, centrifugation, slide preparation, cytocentrifugation (approx. 5.5 minutes per sample) | 2.75 | • On-site filtration, slide preparation (maximum 4 minutes per sample) | 2.00 | ||
| Consumables | • Centrifuge tube | 0.45 | • 20 ml syringe | 0.45 | ||
| • Cytology Funnel | 1.45 | • Microfilter | 1.00 | |||
| • Glass slide | 0.20 | • Glass slide | 0.20 | |||
| • Ethanol fixative | 0.20 | • Ethanol fixative | 0.20 | |||
| • Miscellaneous (gloves, pipette tips, PAP stain dyes etc.) | 0.50 | • Miscellaneous (gloves, pipette tips, PAP stain dyes etc.) | 0.50 | |||
| Subtotal | 5.55 | 4.35 | ||||
| Basic Equipment 3 | ||||||
| • Centrifuge | 3,937.00 (2,878.00-5,729.00) | Reusable glass beakers (12/set) | 131.40 (59.70-303.20) | |||
| • Cytocentrifuge | 7,000.00 (3,693.00-10,510.00) | • Reusable acrylic cassettes | 5.00 (3.50-6.50) | |||
| • Cytocentrifuge clips (6/pack) | 290.63 (191.95-326.29) | |||||
| Subtotal | 11,227.63 (6,762.95-16,565.29) | 136.40 (63.20-309.70) | ||||
| GRAND TOTAL | 21.97 (13.40-51.37) | 11,227.63 (6,762.95-16,565.29) | 8.14 (5.52-17.99) | 136.40 (63.20-309.70) | ||
Assuming intra-state delivery in flat-rate overnight box (for urine samples) or envelope (for processed microfilters), shipping maximum number of samples per package. Costs may be higher for specialized medical courier services.
Wage calculated at $30 per hour.
Does not account for equipment maintenance and depreciation costs, which are higher for standard cytology.
Above estimates also do no account for (a) cytopathology evaluation time, which is shorter for microfilter cytology, and (b) facility set-up costs, which may vary by institution and geography.
All estimated costs in US dollars.
For line items >$3.00, median costs are indicated; range provided within parentheses.
DISCUSSION
We introduce a novel precision-engineered microfilter for capture, enrichment and characterization of tumor cells exfoliated in urine of UCB patients. It uses the principle of cell-size-based capture wherein larger tumor cells are captured and enriched on a small surface area while smaller blood cells pass through the microfilter. These results suggest that microfilter cytology is relatively more sensitive, specific, accurate, rapid and cost-effective for UCB detection than routine urine cytology, the current standard-of-care.
Standard urine cytology has high specificity (83%-99.7%) but low sensitivity (20%-53%), especially in low-grade UCB.17,18 Several factors contribute to this problem – only a small volume of urine can be processed, and only a fraction of the sample can be used for analysis, decreasing the likelihood of capturing tumor cells, especially in paucicellular samples. Abundant RBCs in urine of patients with hematuria, the most common presenting symptom of UCB, and WBCs in patients undergoing surveillance after intravesical instillations following bladder-sparing surgeries, can also inhibit cytological evaluation.7 Modifications to standard cytology including liquid-based and nitrocellulose filtration-based techniques have been unable to address these concerns: background cell elimination is suboptimal, and additional sample-transfer steps increase processing time, costs and potential for loss of critical diagnostic cells.19,20 The microfiltration device resolves these issues by rapidly capturing cells of interest while eliminating background cells, processing the entire specimen, and allowing downstream characterization of captured cells. Routine cytological criteria can be easily applied towards specimen evaluation directly on microfilters. No additional training is required for physicians who are familiar with conventional cytology.
Older technologies using polycarbonate and nitrocellulose filters fell out of favor for cytological applications due to uneven pore size and distribution, cells in different planes of focus due to filter thickness, and potential for background staining.9,21 The microfilter’s precise fabrication, high fill factor, favorable aspect ratio, and uniform pore distribution eliminates these drawbacks with virtually no clogging and rapid filtration of large volumes. Its thin profile, transparency, and inert nature permits superior microscopic visualization, and allows chromosomal and molecular analyses to be performed directly on the filter. Using model systems, we have demonstrated multiplexed immunocytodetection on-chip without transferring cells from the filter to a slide.22 Such probe-based interrogation can allow on-chip integration of techniques such as ImmunoCyt and UroVysion; the ability to eliminate RBCs and enrich tumor cells can improve their performance by reducing false-positive and false-negative calls in cases of hematuria and paucicellularity, respectively.3 Label-free imaging techniques can also be applied on-chip to improve accuracy.23 Furthermore, extraction of genomic material from captured cells can allow downstream expression profiling without requiring invasive procedures to sample tumor cells.24-26
The device’s second prototype will house the microfilter in a self-contained disposable cassette to enable point-of-collection sample filtration with few preparatory steps (Figure 1D). On-site filtration permits processing of fresh urine samples with minimal or no training, avoids shipment of bulky biological fluids that eliminates chances of spillage or sample loss, and allows cellular evaluation immediately on-chip. In addition to expediting processing, the technology does not restrict laboratories to only process samples in batches, thereby optimizing time and resources. Despite being an invasive procedure, cystoscopy in conjunction with biopsy is the gold standard for UCB diagnosis as it compensates for the low sensitivity of standard cytology.27 The portability, operational simplicity and inexpensive transport associated with the microfiltration device makes it attractive for under-funded and low-resource communities. Its cost-effectiveness and improved detection metrics may also reduce the frequent need for adjunct analyses, including cystoscopy, and can have potentially impact overall UCB management costs.
This initial feasibility study with proof-of-principle evaluation of downstream applications has some limitations. Bladder wash and urine specimens were used to increase sample size that may have impacted sensitivities of both techniques. “Atypia, rule out low-grade” samples that were a priori categorized as carcinoma may include occasional papillary urothelial neoplasms of low malignant potential that may not be considered as UCB;28 the limited sample size prevented performance of stratified analyses for such phenotypic subtypes. These caveats indicate the need for larger population-based analyses. While these initial results suggest improved performance for microfilter-based cytology, the technique would nevertheless be a relatively better alternative even if its sensitivity and specificity were comparable to standard cytology given its attributes of being faster and cheaper.
In conclusion, the microfilter cytology technique addresses several limitations of standard urine cytology, can be used at the bed-side or in-office, processes samples rapidly, is cheaper, versatile, and potentially more sensitive and accurate for UCB detection. The device can capture and enumerate tumor cells from urine while eliminating background cells, and can possibly serve as a platform for downstream on-chip molecular analyses. If validated in larger prospective settings, the microfilter’s tumor cell enrichment capability may be especially useful for paucicellular specimens where it potentially outperforms routine cytology.
Supplementary Material
Acknowledgments
The authors thank Yao-Shan Fan, Marineide Brinn, Carmen Casas, Ana Prada, and Jinghong Peng of the Cytogenetics and Molecular Diagnostics Laboratory at the University of Miami Miller School of Medicine for their technical support. This work was supported by the U.S. National Institutes of Health/National Cancer Institute grant R33-CA-123027, and the Whittier Bionanotechnology Program. These study sponsors had no involvement in the study design; collection, analysis and interpretation of data; writing of the manuscript; and decision to submit the manuscript for publication.
Footnotes
Publisher's Disclaimer: This is a PDF file of an unedited manuscript that has been accepted for publication. As a service to our customers we are providing this early version of the manuscript. The manuscript will undergo copyediting, typesetting, and review of the resulting proof before it is published in its final citable form. Please note that during the production process errors may be discovered which could affect the content, and all legal disclaimers that apply to the journal pertain.
References
- 1.Mitra AP, Datar RH, Cote RJ. Molecular pathways in invasive bladder cancer: new insights into mechanisms, progression, and target identification. J Clin Oncol. 2006;24:5552–64. doi: 10.1200/JCO.2006.08.2073. [DOI] [PubMed] [Google Scholar]
- 2.Birkhahn M, Mitra AP, Cote RJ. Molecular markers for bladder cancer: the road to a multimarker approach. Expert Rev Anticancer Ther. 2007;7:1717–27. doi: 10.1586/14737140.7.12.1717. [DOI] [PubMed] [Google Scholar]
- 3.Mitra AP, Cote RJ. Molecular pathogenesis and diagnostics of bladder cancer. Annu Rev Pathol. 2009;4:251–85. doi: 10.1146/annurev.pathol.4.110807.092230. [DOI] [PubMed] [Google Scholar]
- 4.Clark PE, Agarwal N, Biagioli MC, et al. NCCN Clinical Practice Guidelines in Oncology: Bladder Cancer. Fort Washington, PA: National Comprehensive Cancer Network; 2013. [Google Scholar]
- 5.Babjuk M, Oosterlinck W, Sylvester R, et al. EAU guidelines on non-muscle-invasive urothelial carcinoma of the bladder, the 2011 update. Eur Urol. 2011;59:997–1008. doi: 10.1016/j.eururo.2011.03.017. [DOI] [PubMed] [Google Scholar]
- 6.Hemani ML, Makarov DV, Huang WC, et al. The effect of changes in Medicare reimbursement on the practice of office and hospital-based endoscopic surgery for bladder cancer. Cancer. 2010;116:1264–71. doi: 10.1002/cncr.24875. [DOI] [PubMed] [Google Scholar]
- 7.Mitra AP, Cote RJ. Molecular screening for bladder cancer: progress and potential. Nat Rev Urol. 2010;7:11–20. doi: 10.1038/nrurol.2009.236. [DOI] [PubMed] [Google Scholar]
- 8.Brown FM. Urine cytology: Is it still the gold standard for screening? Urol Clin North Am. 2000;27:25–37. doi: 10.1016/s0094-0143(05)70231-7. [DOI] [PubMed] [Google Scholar]
- 9.Zheng S, Lin H, Liu JQ, et al. Membrane microfilter device for selective capture, electrolysis and genomic analysis of human circulating tumor cells. J Chromatogr A. 2007;1162:154–61. doi: 10.1016/j.chroma.2007.05.064. [DOI] [PubMed] [Google Scholar]
- 10.Carson FL, Hladik C. Histotechnology: A Self-Instructional Text. 3. Chicago, IL: American Society for Clinical Pathology; 2009. Cytopreparatory techniques; pp. 352–65. [Google Scholar]
- 11.Bardales RH. Practical Urologic Cytopathology. New York, NY: Oxford University Press; 2002. Primary tumors of the urinary tract; pp. 122–202. [Google Scholar]
- 12.Brimo F, Vollmer RT, Case B, et al. Accuracy of urine cytology and the significance of an atypical category. Am J Clin Pathol. 2009;132:785–93. doi: 10.1309/AJCPPRZLG9KT9AXL. [DOI] [PubMed] [Google Scholar]
- 13.Mokhtar GA, Al-Dousari M, Al-Ghamedi D. Diagnostic significance of atypical category in the voided urine samples: A retrospective study in a tertiary care center. Urol Ann. 2010;2:100–6. doi: 10.4103/0974-7796.68857. [DOI] [PMC free article] [PubMed] [Google Scholar]
- 14.Sarosdy MF, Kahn PR, Ziffer MD, et al. Use of a multitarget fluorescence in situ hybridization assay to diagnose bladder cancer in patients with hematuria. J Urol. 2006;176:44–7. doi: 10.1016/S0022-5347(06)00576-3. [DOI] [PubMed] [Google Scholar]
- 15.Landis JR, Koch GG. The measurement of observer agreement for categorical data. Biometrics. 1977;33:159–74. [PubMed] [Google Scholar]
- 16.Piaton E, Hutin K, Faÿnel J, et al. Cost efficiency analysis of modern cytocentrifugation methods versus liquid based (Cytyc Thinprep) processing of urinary samples. J Clin Pathol. 2004;57:1208–12. doi: 10.1136/jcp.2004.018648. [DOI] [PMC free article] [PubMed] [Google Scholar]
- 17.Lotan Y, Roehrborn CG. Sensitivity and specificity of commonly available bladder tumor markers versus cytology: results of a comprehensive literature review and meta-analyses. Urology. 2003;61:109–18. doi: 10.1016/s0090-4295(02)02136-2. [DOI] [PubMed] [Google Scholar]
- 18.Carmack AJ, Soloway MS. The diagnosis and staging of bladder cancer: From RBCs to TURs. Urology. 2006;67:3–8. doi: 10.1016/j.urology.2006.01.026. [DOI] [PubMed] [Google Scholar]
- 19.Piaton E, Faynel J, Hutin K, et al. Conventional liquid-based techniques versus Cytyc Thinprep processing of urinary samples: a qualitative approach. BMC Clin Pathol. 2005;5:9. doi: 10.1186/1472-6890-5-9. [DOI] [PMC free article] [PubMed] [Google Scholar]
- 20.Nassar H, Ali-Fehmi R, Madan S. Use of ThinPrep monolayer technique and cytospin preparation in urine cytology: a comparative analysis. Diagn Cytopathol. 2003;28:115–8. doi: 10.1002/dc.10245. [DOI] [PubMed] [Google Scholar]
- 21.Voss JS, Kipp BR, Krueger AK, et al. Changes in specimen preparation method may impact urine cytologic evaluation. Am J Clin Pathol. 2008;130:428–33. doi: 10.1309/VP1XQ5GPQ687W1HU. [DOI] [PubMed] [Google Scholar]
- 22.Lin HK, Zheng S, Williams AJ, et al. Portable filter-based microdevice for detection and characterization of circulating tumor cells. Clin Cancer Res. 2010;16:5011–8. doi: 10.1158/1078-0432.CCR-10-1105. [DOI] [PMC free article] [PubMed] [Google Scholar]
- 23.Angeletti C, Harvey NR, Khomitch V, et al. Detection of malignancy in cytology specimens using spectral-spatial analysis. Lab Invest. 2005;85:1555–64. doi: 10.1038/labinvest.3700357. [DOI] [PubMed] [Google Scholar]
- 24.Birkhahn M, Mitra AP, Williams AJ, et al. Predicting recurrence and progression of noninvasive papillary bladder cancer at initial presentation based on quantitative gene expression profiles. Eur Urol. 2010;57:12–20. doi: 10.1016/j.eururo.2009.09.013. [DOI] [PMC free article] [PubMed] [Google Scholar]
- 25.Mitra AP, Almal AA, George B, et al. The use of genetic programming in the analysis of quantitative gene expression profiles for identification of nodal status in bladder cancer. BMC Cancer. 2006;6:159. doi: 10.1186/1471-2407-6-159. [DOI] [PMC free article] [PubMed] [Google Scholar]
- 26.Mitra AP, Pagliarulo V, Yang D, et al. Generation of a concise gene panel for outcome prediction in urinary bladder cancer. J Clin Oncol. 2009;27:3929–37. doi: 10.1200/JCO.2008.18.5744. [DOI] [PMC free article] [PubMed] [Google Scholar]
- 27.Pasin E, Josephson DY, Mitra AP, et al. Superficial bladder cancer: an update on etiology, molecular development, classification, and natural history. Rev Urol. 2008;10:31–43. [PMC free article] [PubMed] [Google Scholar]
- 28.Fujii Y, Kawakami S, Koga F, Nemoto T, Kihara K. Long-term outcome of bladder papillary urothelial neoplasms of low malignant potential. BJU Int. 2003;92:559–62. doi: 10.1046/j.1464-410x.2003.04415.x. [DOI] [PubMed] [Google Scholar]
Associated Data
This section collects any data citations, data availability statements, or supplementary materials included in this article.


