Abstract
Low-level laser therapy (LLLT) is a non-thermal phototherapy used in several medical applications, including wound healing, reduction of pain and amelioration of oral mucositis. Nevertheless, the effects of LLLT upon cancer or dysplastic cells have been so far poorly studied. Head and neck cancer patients receiving LLLT for oral mucositis, for example, might have remaining tumor cells that could be stimulated by LLLT. This study demonstrated that LLLT (GaAlAs – 660 nm or 780 nm, 40 mW, 2.05, 3.07 or 6.15 J/cm2) can modify oral dysplastic cells (DOK) and oral cancer cells (SCC9 and SCC25) growth by modulating the Akt/mTOR/CyclinD1 signaling pathway; LLLT significantly modified the expression of proteins related to progression and invasion in all the cell lines, and could aggravate oral cancer cellular behavior, increasing the expression of pAkt, pS6 and Cyclin D1 proteins and producing an aggressive Hsp90 isoform. Apoptosis was detected for SCC25 and was related to pAkt levels.
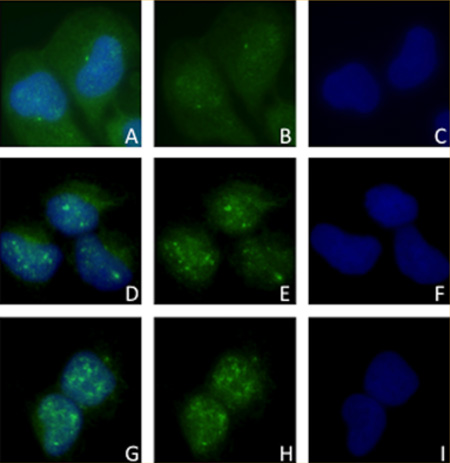
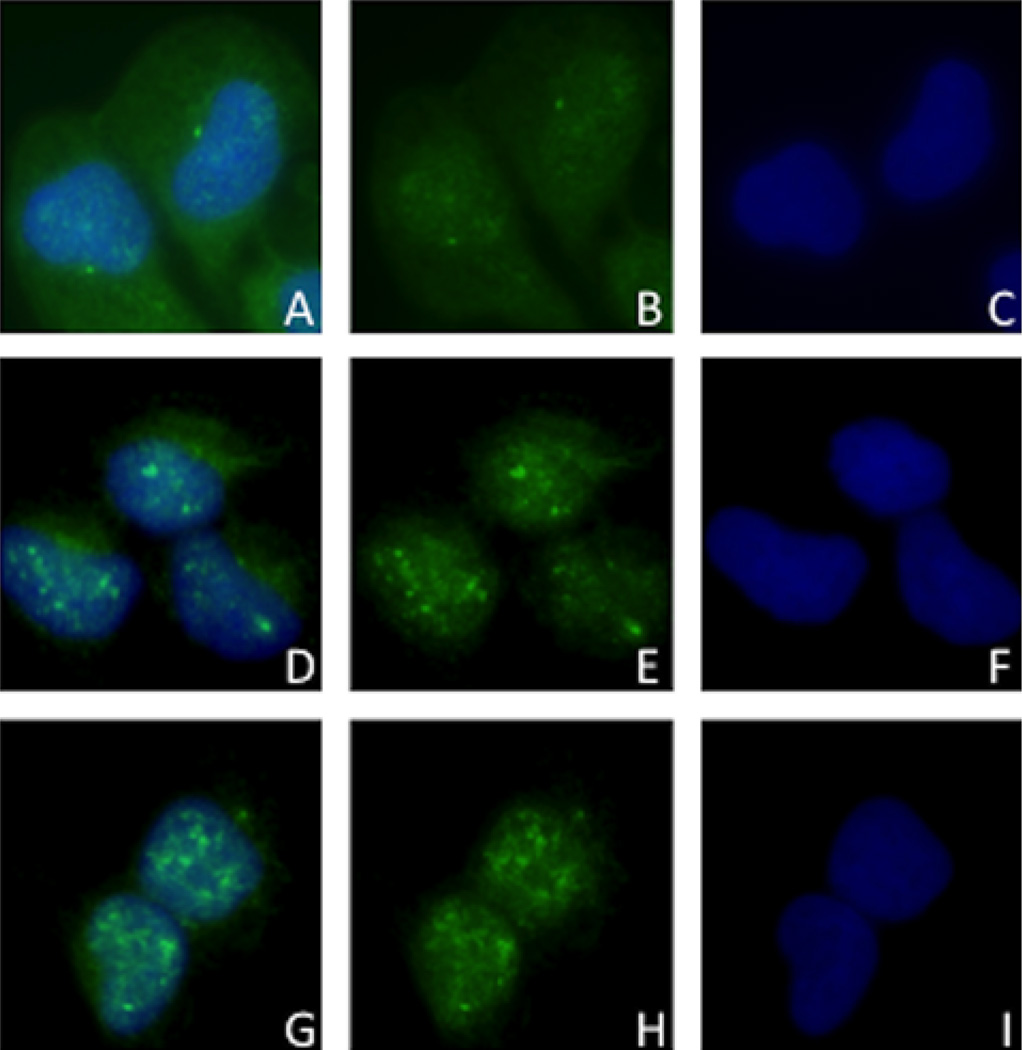
Translocation of pAkt seen through Immunofluorescence from cytoplasm of control SCC9 cells (A) to nuclei of red (D) and infrared (G) laser irradiated cells. B, E and H: pAkt staining in control, red and infrared laser groups, respectively. C, F and I: nuclear DAPI in control, red and infrared groups, respectively.
Keywords: laser therapy, low-level, mouth neoplasms, proto-oncogene proteins c-akt, HSP90 heat-shock proteins, TOR serine-threonine kinases, ribosomal protein S6, Ccnd1 protein
1. Introduction
Oral squamous cell carcinoma (OSCC) is a major problem worldwide (more than 95% of oral malignancies) [1]. Its main risk factors are smoking and drinking habits [2], and evidences point the human papillomavirus (HPV) infection as a potential risk for OSCC [3, 4]. Besides surgery, radiotherapy and chemotherapy are often employed in treatment of oral cancer, and as a consequence of the interaction of radiation and drug therapy, a cancer patient may suffer oral mucositis (incidence of oral mucositis varies significantly depending on the drugs and treatment regimens used) [5, 6]. Oral mucositis is characterized by severe and painful mucosal ulcerations and can occur in patients with different solid tumors [5].
One of the recognized promising treatments for oral mucositis is low-level laser therapy (LLLT) [6, 7], which involves the light stimulation of the tissues using nonionizing, non-thermal red or near infrared wavelengths [8]. LLLT is known to be effective for wound healing, inflammation and pain reduction [8, 9] and can reduce clinical oxidative stress in various lesions [10], being investigated in the brain for stroke, traumatic brain injuries [11] and neurodegenerative disorders [12].
LLLT may become a routine practice in the prevention and treatment of oral mucositis [13], since encouraging results have already been reported [14–16]; however, the possibility of an accidental exposure of dysplastic or even cancer cells during LLLT exists [17, 18], and has so far been poorly investigated. Authors have contra-indicated the application of LLLT for proliferative and malignant lesions [19]; but in head and neck cancer some remaining tumor cells may accidentally be exposed in the LLLT irradiation field, especially when patients receive LLLT for oral mucositis [20].
Different outcomes can actually occur when LLLT is delivered to different types of cells [21–23]. Cancer cells, for example, can proliferate when irradiated with LLLT [24]. Thus, this study sought to evaluate the outcome of oral dysplastic and oral cancer cells after being exposed to LLLT using different parameters. We aimed to specifically investigate the influence of LLLT on a well-established signaling pathway related to aggressiveness of head and neck cancer, namely the Akt/mTOR/CyclinD1 pathway [25, 26].
2. Material and methods
2.1 Low-level laser stimulation and Cell viability
Dysplastic oral keratinocytes – DOK cell line (European Collection of Cell Cultures – EACC, Wiltshire, England) and oral squamous cell carcinoma cell lines SCC9 and SCC25 (ATCC, VA, USA) were cultured in Eagle medium modified by Dulbecco (Sigma-Aldrich, St. Louis, MO, USA) supplemented with 10% fetal bovine serum and 1% penicillin/streptomycin (Sigma-Aldrich) at 37 °C under 5% CO2.
For cell viability assay, cells were cultured in 96-well black tissue-culture treated microplates (Greiner – Bio-one, Brazil) at 1 × 10⁴/well (n = 4); incubated for 24 h and then irradiated with LLLT (Twin laser MMO, SP, Brazil – spot area = 0,039 cm2) at 40 mW to form different groups: control (no light); 2.05 J/cm2; 3.07 J/cm2 and 6.15 J/cm2. The laser light was either red (660 nm) or near-infrared (780 nm), and one trained investigator always performed the irradiation; the laser tip touched the bottom of the wells and was perpendicular to the surface. After light stimulation, cellular viability was determined with a 3-hour MTS assay at 12, 24, 48 and 72 hours (Promega, Wisconsin, USA).
2.2 Western blot
Six different experimental groups (6.15 J/cm2 red and near-infrared for DOK; 2.05 J/cm2 red and near-infrared for SCC9 and 3.07 J/cm2 red and near-infrared for SCC25) were selected from the cell viability analyses, as shown in the RESULTS section; these different groups were submitted to Western blot analysis. Cells were lysed with lysis buffer (10 mM Tris-HCl pH 7,5; 1 mM of EDTA; 1% Triton X-100; 150 mM NaCl; 1% DOC and 0,1% SDS) containing freshly added protease inhibitor cocktail (Sigma-Aldrich) for 20 minutes at 4 °C. The cells were then scraped and the lysates were collected and cleared by centrifugation at 15000 rpm for 10 minutes at 4 °C.
Protein concentrations of all samples were determined using the Pierce BCA method (Pierce Biotechnology, Rockford, IL) following the manufacturer’s protocol. Thirty micrograms of protein were loaded on polyacrylamide gels and transferred to a PVDF membrane. After blocking in 5% non-fat dry milk or BSA, the membranes were incubated overnight at 4 °C with the following primary antibodies: anti-Akt at 1 : 1000 (Cell Signaling, Danvers, MA, USA – #9272); anti-pAkt at 1 : 1000 (Cell Signaling – 7985R); anti-Hsp90 at 1 : 1000 (Cell Signaling – #4875); anti-S6 at 1 : 1000 (Cell Signaling – 2217); anti-pS6ser235/236 at 1 : 1000 (Cell Signaling – 2211); anti-pS6ser240/244 at 1 : 1000 (Cell Signaling – 2215); anti-Cyclin D1 at 1 : 1000 (Cell Signaling – 2922); and anti-beta-actin at 1 : 6000 (Sigma-Aldrich, St. Louis, MO); and for 1 h at room temperature with peroxidase-conjugated secondary antibody (IgG-HRP, Santa Cruz Biotechnology, Santa Cruz, CA).
Bound antibody was detected by a colorimetric method using Opti 4CN kit (Bio-rad Laboratories, Hercules, CA, USA). Beta-actin was used as a loading control. To quantify the bands obtained through Western blot, their respective areas were measured with a standardized rectangle (sample tool); the width of the sample tool was of one third of the band width [27], and the number of pixels inside this rectangle was counted with the help of ImageJ software (U.S. National Institutes of Health, Bethesda, Maryland, USA). The number of pixels of each band was always divided by the number of pixels of its respective beta-actin band. The values obtained were then compared with each other using statistical analysis as described below.
2.3 Immunofluorescence
The same experimental groups utilized for Western blot were analyzed for the cellular localization of different proteins through immunofluorescence microscopy. The antibodies used for this assay were the same as those used for Western blot and are described above.
DOK, SCC9 and SCC25 cells were seeded on coverslips and then received LLLT as mentioned before. Cells were then fixed and permeabilized in cooled absolute methanol at −20 °C for 6 minutes. Briefly, the cells were incubated with blocking solution (1% bovine serum albumin) for 30 min and followed incubation with each antibody described previously for 90 min at room temperature in a humidified chamber. Next, the cells were washed in PBS (Phosphate Buffered Saline) and incubated with a FITC conjugated antibody (Vector Laboratories, Ind. Burlingame, CA, USA) for 45 min in the dark. After PBS washing, the coverslips were mounted using mounting media containing DAPI (Vectashield: DAPI, Vector Laboratories, CA, USA) and imaged with a Zeiss Axio Imager.A1 microscope (Carl Zeiss, Germany).
2.4 Apoptosis assay
The most statistically significant reductions observed in cell growth curves were submitted to the apoptosis assay TUNEL (TdT-mediated dUTP Nick-End Labeling – Promega, Madison, Wisconsin, EUA). All groups were seeded as described for immunofluorescence, receiving LLLT accordingly.
For TUNEL assay the cells were fixed in paraformaldehyde solution at 4% for 25 minutes at 4 °C. Then the coverslips were washed twice in PBS (5 minutes each), following permeabilization with Triton X-100 solution at 2%, diluted in PBS at room temperature. After washing, the coverslips were incubated with the reagents of the DeadEnd Fluorometric Tunel System kit (Promega, Inc.), according to the manufacturer’s instructions.
In order to compare the apoptotic rate of the LLLT groups with their respective controls, an apoptotic index was determined through arbitrarily choosing four microscopic fields (200×) and counting the total cell number and the number of cells in apoptosis and performing a ratio between them.
2.5 Statistical Analysis
The statistical tests consisted on descriptive analyses based on media plus standard deviation. It was utilized a two-way ANOVA test followed by Tukey test for the cell viability assays and a two-way ANOVA test followed by a Student‘s T test for the western blot bands quantification. The level of significance was of 5% and the Bonferroni correction was employed.
3. Results
3.1 Cell viability may be enhanced or diminished as a consequence of LLLT
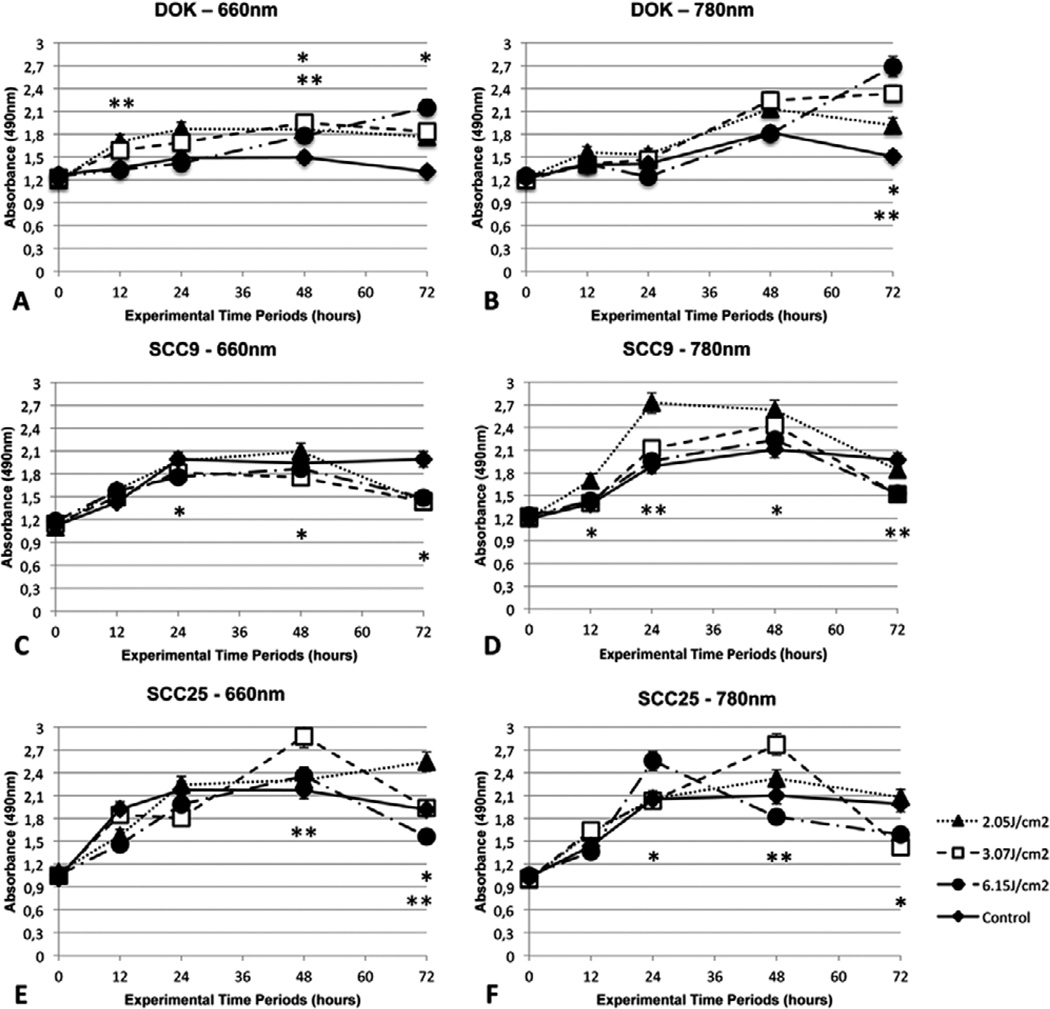
The curves and the statistically significant results between each laser dose and its respective control group are illustrated in Figure 1. LLLT as performed in this study was able to induce either proliferation or growth inhibition depending on the parameters employed and also on the cell line studied. As shown in Figure 1 (A–B) the dysplastic cell line DOK showed enhanced cellular viability throughout all of the experimental periods and with all the employed laser wavelengths and doses.
Figure 1.
Cell viability assay (media plus standard deviation) illustrated by the absorbance of 490 nm light by DOK (A, B), SCC9 (C, D) and SCC25 cells (E, F) after LLLT with 660 nm or 780 nm at 12, 24, 48 and 72 hours. Statistically significant differences are represented between a laser group and its respective control (* p < 0.05; ** p < 0.01).
On the other hand, the cancer cell line SCC9 presented differing behavior involving general enhanced cell viability with the near-infrared wavelength and pronounced inhibition of growth with the red wavelength Figure 1C–D. SCC25 cell line also showed marked growth stimulation at some fluences with both the wavelengths Figure 1E–F, while both SCC9 and SCC25 had a tendency to show lower levels of cell viability at the latest evaluation time point Figure 1C–F.
3.2 Akt/mTOR signaling pathway may be influenced by LLLT
By studying the statistical analysis of the curves illustrated in Figure 1, six groups were selected for further experiments involving Western blots, immunofluorescence and TUNEL. These groups were: 6.15 J/cm2 at 12, 48 and 72 hours for DOK cell line; 2.05 J/cm2 at 12, 24 and 72 hours for SCC9 and 3.07 J/cm2 at 12, 48 and 72 hours for SCC25. All of these groups were divided into control, red laser (660 nm) and infrared laser (780 nm).
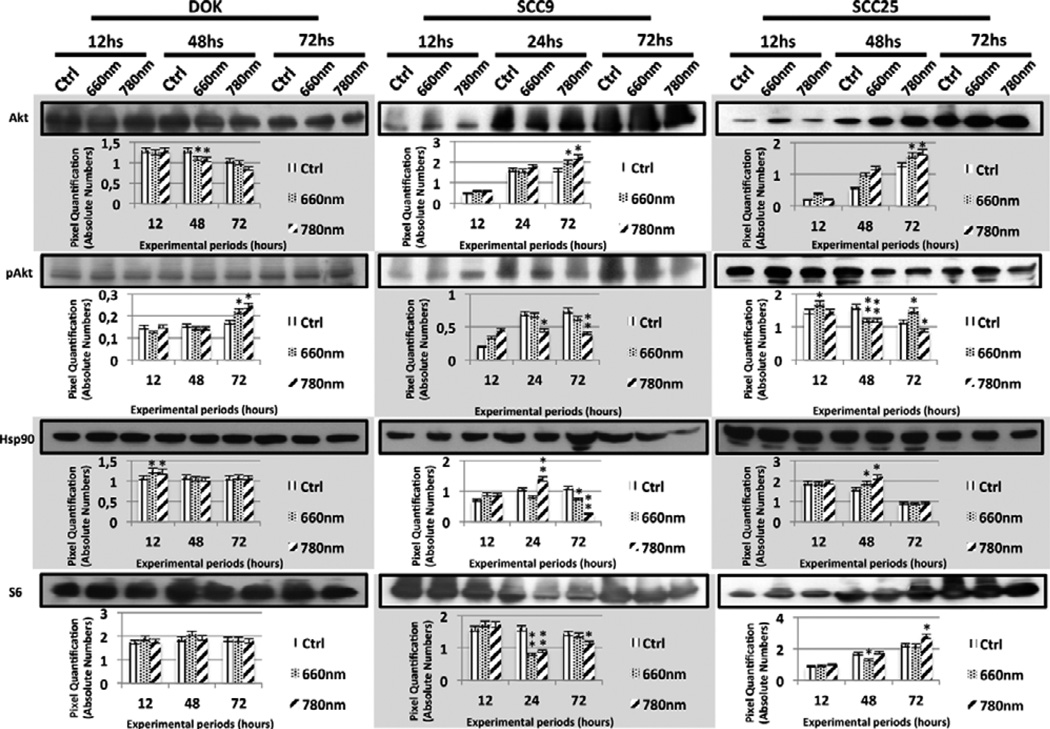
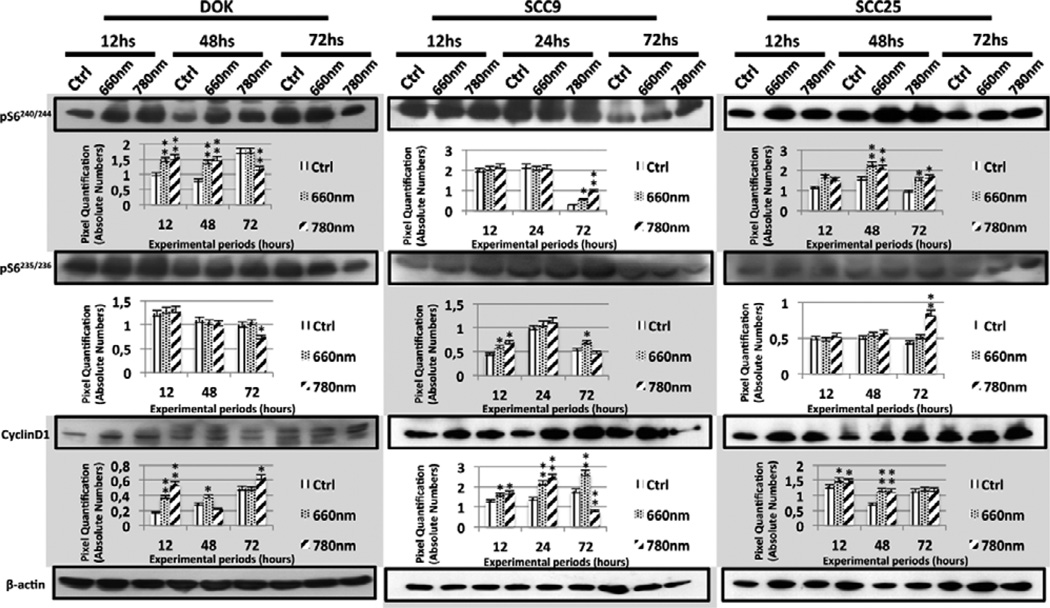
The expression levels of different proteins related to the Akt/mTOR/CyclinD1 signaling pathway were influenced by LLLT as performed in this study. The Western blot bands that corresponded to these expressed levels along with their pixel quantification are illustrated in Figures 2 and 3.
Figure 2.
Western Blot bands and their respective quantification to illustrate the expression levels of Akt, pAkt, Hsp90 and S6 proteins in control and laser groups (660 nm and 780 nm) of DOK, SCC9 and SCC25 cell lines. Statistically significant results are represented between a laser group and its control (* p < 0.05; ** p < 0.01).
Figure 3.
Western Blot bands and their respective quantification to illustrate the expression levels of pS6240/244, pS6235/236 and Cyclin D1 in control and laser groups (660 nm and 780 nm) of DOK, SCC9 and SCC25 cell lines. Statistically significant results are represented between a laser group and its control (* p < 0.05; ** p < 0.01).
Among the most relevant results found through Western blot were augmented expression of pAkt, enhanced levels of pS6 and Cyclin D1 and also the maintenance or appearance of Hsp90N, depending on the cell line and laser parameters employed (Figure 2 and 3). Although there were punctual diminishments in pAkt expression in all studied cell lines, there were remarkable enhancements in pAkt levels in DOK at 72 hours and a more immediate influence on SCC25 at 12 hours after LLLT (Figure 2).
Hsp90 levels were enhanced in DOK cells at 12 hours, while Hsp90N appearance or maintenance was interestingly correlated to laser irradiation in SCC9 and SCC25 (Figure 2). Frequently there was detection of augmented levels of pS6ser240/244 and pS6ser235/236 in all cell lines, although a focal decay was detected in DOK (near-infrared laser irradiation at 72 hours) for both pS6 phosphorylation sites (Figure 3). Laser irradiation was also responsible for general enhanced levels of Cyclin D1 in all cell lines (Figure 3).
3.3 Qualitative expression of Akt/mTOR related proteins after LLLT
The intracellular localization of the studied proteins was not changed, except for pAkt, which was translocated from the cytoplasm to the nuclei of the SCC9 cells irradiated with red and near-infrared laser at 24 hours (Figure 4).
Figure 4.
Immunofluorescence of pAkt in SCC9 cells after 24 hours. Cytoplasmic and nuclear staining in control group (A), and nuclear staining of pAkt in SCC9 cells following red (D) and infrared (G) LLLT. B, E and H Figures show the pAkt staining represented by green FITC in control, red and infrared laser groups, respectively. C, F and I Figures illustrate the nuclear DAPI in control, red and infrared groups, respectively.
The expression of pS6ser240/244 was generally cytoplasmic or cytoplasmic and nuclear for all the studied groups and at all times. pS6ser235/236 and S6, on the other hand, were expressed mainly in the cytoplasm of all studied cells (Figures S1–S6).
Finally, Hsp90 was present in the cytoplasm or both the cytoplasm and nuclei of all cells, whereas the expression of Cyclin D1 was exclusively nuclear in all studied groups (Figures S1–S6). No morphological alterations were detected in the cells after LLLT.
3.4 Growth inhibition may be related to induction of apoptosis by LLLT
Significant reductions in viability were assessed through statistical analysis. The most significant reductions (Table S1) consisted of 2.05 J/cm2 for SCC9 (660 nm) and 6.15 J/cm2 for SCC9 (780 nm), both at 72 hours. SCC25 had three groups with significant reductions: 3.07 J/cm2 (660 nm) at 72 hours; 6.15 J/cm2 (780 nm) at 48 hours and 3.07 J/cm2 (780 nm) at 72 hours.
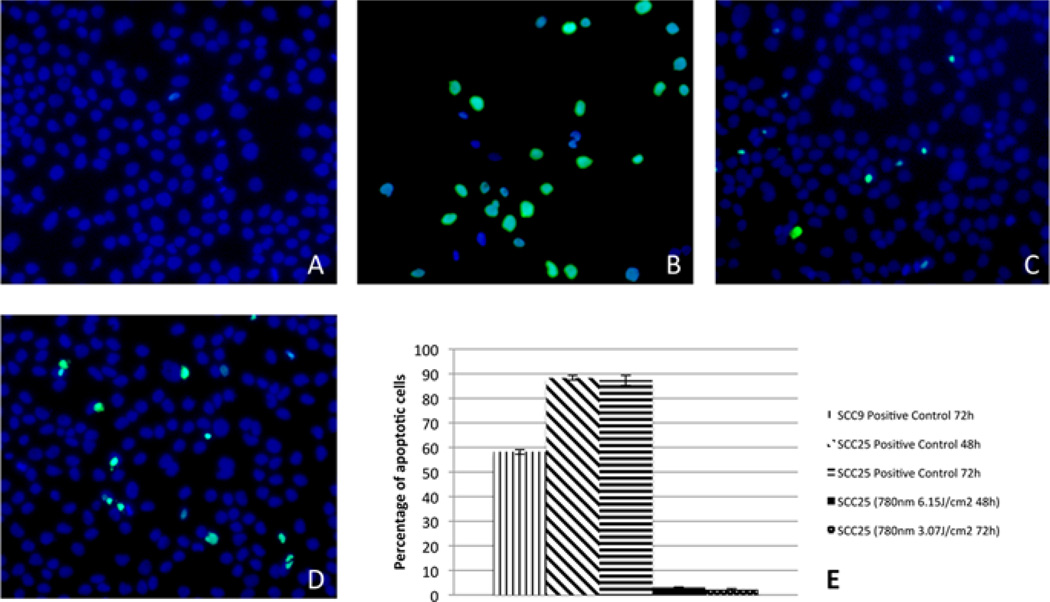
The only groups in which apoptosis was detected were from the SCC25 cell line: 6.15 J/cm2 (780 nm) at 48 hours and 3.07 J/cm2 (780 nm) at 72 hours (Figure 5). Cells that entered apoptosis are illustrated by green fluorescence; all cells may be visualized by the blue DAPI nuclear staining (Figure 5). Figure 5E illustrates the apoptotic cell index of the groups that showed any degree of apoptosis, including the respective positive control of the assay. Groups that did not show apoptosis are not shown in this Figure.
Figure 5.
Detection of apoptosis. A – SCC25 control cells showing no apoptosis at 48 hours; B – positive control of SCC25 at 48 hours; C and D – apoptosis detection in SCC25 cells after infrared LLLT with 6.15 J/cm2 (48 hours) and 3.07 J/cm2 (72 hours), respectively. E – Percentage of apoptotic cells in the positive controls and experimental groups (groups that did not present apoptosis are not plotted in the chart).
5. Discussion
LLLT is considered to be a non-ionizing irradiation that is not able to induce damage to cells’ DNA; however, it can modify cell behavior [23, 28, 29], and that is why LLLT is generally counter-indicated for proliferating or dysplastic lesions that can potentially turn into neoplasia [19, 30]. Besides, in vitro cultured cancer cells may not represent the complex biological environment found in a tumor growing in its host [31, 32]; however, cell culture is the safest and simplest way of searching for possible cell growth and increased invasion produced by the modulation of specific signaling pathways.
In that way, it should be realized that the present results could be modified if extrapolated to an in vivo research [21]; LLLT may enhance angiogenesis [33], growth factor synthesis [34], modulate inflammation metabolism and the inflammatory response [35]. Nonetheless, we aimed to investigate the particular role of the Akt/mTOR/CyclinD1 signaling pathway in cancer and dysplastic cell lines that did not receive any other kind of stimulus but the LLLT.
The laser fluences used herein were carefully chosen to be equivalent to those utilized in the clinical practice, especially in the treatment of oral mucositis by LLLT [13]. Although LLLT is a very promising treatment for oral mucositis [6, 7], cancer cells that remained after the surgical treatment, especially in a head and neck cancer, could be exposed to LLLT irradiation undesirably [20]. Despite the fact that cancer cells may be stimulated to grow after LLLT [21], to the best of our knowledge there is no such study that specifically addresses this question of oral cancer and LLLT for mucositis.
Dysplastic oral cells are considered to be pre-malignant and may undergo a series of transformations that culminate in a malignant phenotype [36]. Interestingly, the present study showed significantly higher dysplastic cell viability when irradiated with LLLT in practically all the experimental time points. Moreover, not only was the viability of these cells enhanced, but they also showed higher expression of specific proteins related to cancer invasion and progression, such as pAkt, Hsp90, pS6ser240/244 and Cyclin D1. Thus, it could be concluded that dysplastic oral cells could have their in vitro phenotype inclined towards cancer after LLLT, since HNSCCs often show high levels of pAkt, Hsp90, mTOR and Cyclin D1 [37–40].
Moreover, the augmented activity of the PI3K/Akt signaling pathway could reflect worse prognosis of HNSCCs [41, 42], and in fact, the pAkt, Hsp90, pS6ser235/236 pS6ser240/244 and Cyclin D1 levels, all related to the PI3K/Akt pathway, were increased at some time periods in SCC9 and SCC25 cells after they received LLLT; and punctual decreased cell viabilities did not necessarily correspond to decreased expression of these proteins, again showing aggressive behavior of the remaining cancer cells after LLLT. In addition, the decreased expression of pAkt in SCC9 (infrared group at 24 and 72 hours) and SCC25 (red and infrared groups at 48 hours and infrared group at 72 hours) cannot be interpreted as a better outcome of these cells‘ behavior, since it did not correspond to pS6 and/or Cyclin D1 reduction; S6 may be activated independently from Akt, as this can occur via PDK-1 [43].
Akt can be phosphorylated by LLLT indeed [44]; and by activating PI3K/Akt signaling pathway, LLLT inhibits GSK-3β [45], which is an important apoptosis activator [46]. Moving on to Hsp90, which is a chaperone that assists the maturation of Akt enabling it to carry out its downstream functions correctly [47], higher levels of this protein were encountered for each cell line studied when irradiated with red or near-infrared laser. In fact, increased quantities of Hsp90 protein are certainly not desired in human cancer [47].
And besides the higher Hsp90 levels encountered in laser groups, a distinct isoform of Hsp90 named Hsp90N could be distinguished in some of these experimental groups. Hsp90N has an oncogenic potential [48], being over-expressed in tumoral tissues [40] and present in microvesicles secreted by advanced stages of melanoma [49]. Interestingly, SCC9 cells expressed Hsp90N after near-infrared laser irradiation, which suggests a more aggressive phenotype than that of the control group. Hsp90N was also found in the control group of SCC25 at 12 hours; however, the expression of this isoform was maintained only in the near-infrared group after 48 hours; this again suggests the worse behavior of this cell line after LLLT.
One of the concerns of this study was the duration of the LLLT effects upon the cells. Generally, a transient effect would be less harmful since it would probably not be extended to the subsequent generation of cells. Nevertheless, we could detect persistent higher levels of pS6ser235/236, pS6ser240/244 and Cyclin D1 in SCC9 after LLLT; as well as higher levels of pAkt, pS6ser235/236 and pS6ser240/244 in SCC25 and enhanced levels of pAkt and Cyclin D1 in DOK cells. Such effects were prolonged until 72 hours after LLLT. In addition, these prolonged effects were obtained after only a single laser irradiation. Other studies may illustrate if repeated doses of LLLT may induce different results.
The decreased cell viabilities found in the later evaluation periods for SCC9 (780 nm) and SCC25 are probably a consequence of previous significantly increased cell proliferation, which illustrates the secondary contact inhibition phenomenon [50], and not a consequence of laser irradiation, what could happen with much higher laser energy densities [51]. In addition, we also detected apoptosis in SCC25 cell line after LLLT; a pro-apoptotic effect of low-level laser in SCC25 had already been reported in the literature [20]. The apoptotic rate detected herein after LLLT was actually minimal, although it may be relevant since the control group did not present any apoptosis. In addition, apoptosis detection could be correlated to a slight decrease in pAkt levels of SCC25, while sustained or increased levels of pAkt prevented the cells from entering apoptosis [52, 53].
Finally, excluding pAkt, none of the studied proteins had their cellular localization changed by LLLT. The change of pAkt localization was illustrated by a nuclear translocation of this protein in SCC9 cells after 24 hours of LLLT with both employed wavelengths. It is known that breast cancer patients that showed nuclear pAkt presented higher survival rates [54], while a higher percentage of nuclear pAkt was detected in patients with advanced prostate cancer [55]. The fact that pAkt had its cellular sublocalization changed by a single dose of LLLT is interesting, although there is no consensus in the literature that would allow us to conclude if this is an indicator of worst cellular behavior.
Supplementary Material
Acknowledgements
Contract grant sponsor: Fundação de Amparo à Pesquisa do Estado de São Paulo – Grant numbers: 2009/08452–2 and 2009/16183–1. MR Hamblin was supported by US NIH grant R01AI050875.
Footnotes
Supporting information for this article is available free of charge under http://dx.doi.org/10.1002/jbio.201300015
Author biographies Please see Supporting Information online.
References
- 1.Marocchio LS, Lima J, Sperandio FF, Correa L, de Sousa SO. J Oral Sci. 2010;52:267–273. doi: 10.2334/josnusd.52.267. [DOI] [PubMed] [Google Scholar]
- 2.Biolchini F, Pollastri G, Figurelli S, Chiarini L. Minerva Stomatol. 2005;54:405–414. [PubMed] [Google Scholar]
- 3.Kansy K, Thiele O, Freier K. Oral and maxillofacial surgery. 2012 doi: 10.1007/s10006-012-0383-0. [DOI] [PubMed] [Google Scholar]
- 4.Molinolo AA, Amornphimoltham P, Squarize CH, Castilho RM, Patel V, Gutkind JS. Oral Oncol. 2009;45:324–334. doi: 10.1016/j.oraloncology.2008.07.011. [DOI] [PMC free article] [PubMed] [Google Scholar]
- 5.Sonis ST, Elting LS, Keefe D, Peterson DE, Schubert M, Hauer-Jensen M, Bekele BN, Raber-Durlacher J, Donnelly JP, Rubenstein EB, Mucositis C. Study Section of the Multinational Association for Supportive Care. Vol. 100. O. International Society for Oral, Cancer; 2004. pp. 1995–2025. [Google Scholar]
- 6.Migliorati CA, Oberle-Edwards L, Schubert M. Support Care Cancer. 2006;14:533–540. doi: 10.1007/s00520-006-0049-2. [DOI] [PubMed] [Google Scholar]
- 7.Barasch A, Peterson DE, Tanzer JM, D’Ambrosio JA, Nuki K, Schubert MM, Franquin JC, Clive J, Tutschka P. Cancer. 1995;76:2550–2556. doi: 10.1002/1097-0142(19951215)76:12<2550::aid-cncr2820761222>3.0.co;2-x. [DOI] [PubMed] [Google Scholar]
- 8.Chung H, Dai T, Sharma SK, Huang YY, Carroll JD, Hamblin MR. Ann Biomed Eng. 2012;40:516–533. doi: 10.1007/s10439-011-0454-7. [DOI] [PMC free article] [PubMed] [Google Scholar]
- 9.Sperandio FF, Simoes A, Aranha AC, Correa L, Orsini Machado de Sousa SC. Photomed Laser Surg. 2010;28:581–587. doi: 10.1089/pho.2009.2601. [DOI] [PubMed] [Google Scholar]
- 10.Huang YY, Nagata K, Tedford CE, McCarthy T, Hamblin MR. J Biophotonics. 2012 doi: 10.1002/jbio.201200157. [DOI] [PMC free article] [PubMed] [Google Scholar]
- 11.Huang YY, Gupta A, Vecchio D, de Arce VJ, Huang SF, Xuan W, Hamblin MR. J Biophotonics. 2012;5:827–837. doi: 10.1002/jbio.201200077. [DOI] [PMC free article] [PubMed] [Google Scholar]
- 12.De Taboada L, Yu J, El-Amouri S, Gattoni-Celli S, Richieri S, McCarthy T, Streeter J, Kindy MS. J Alzheimers Dis. 2011;23:521–535. doi: 10.3233/JAD-2010-100894. [DOI] [PubMed] [Google Scholar]
- 13.Migliorati C, Hewson I, Lalla RV, Antunes HS, Estilo CL, Hodgson B, Lopes NN, Schubert MM, Bowen J, Elad S. Support Care Cancer. 2012 doi: 10.1007/s00520-012-1605-6. [DOI] [PubMed] [Google Scholar]
- 14.Qutob AF, Gue S, Revesz T, Logan RM, Keefe D. Oral Oncol. 2012 doi: 10.1016/j.oraloncology.2012.08.008. [DOI] [PubMed] [Google Scholar]
- 15.Cunha CB, Eduardo FP, Zezell DM, Bezinelli LM, Shitara PP, Correa L. Lasers Med Sci. 2012 doi: 10.1007/s10103-012-1089-0. [DOI] [PubMed] [Google Scholar]
- 16.Simoes A, Eduardo FP, Luiz AC, Campos L, Sa PH, Cristofaro M, Marques MM, Eduardo CP. Lasers Surg Med. 2009;41:264–270. doi: 10.1002/lsm.20758. [DOI] [PubMed] [Google Scholar]
- 17.Karu TI. Photochem Photobiol. 1990;52:1089–1098. doi: 10.1111/j.1751-1097.1990.tb08450.x. [DOI] [PubMed] [Google Scholar]
- 18.Moore P, Ridgway TD, Higbee RG, Howard EW, Lucroy MD. Lasers Surg Med. 2005;36:8–12. doi: 10.1002/lsm.20117. [DOI] [PubMed] [Google Scholar]
- 19.Pinheiro AL, Carneiro NS, Vieira AL, Brugnera A, Jr, Zanin FA, Barros RA, Silva PS. J Clin Laser Med Surg. 2002;20:23–26. doi: 10.1089/104454702753474977. [DOI] [PubMed] [Google Scholar]
- 20.Schartinger VH, Galvan O, Riechelmann H, Dudas J. Support Care Cancer. 2012;20:523–529. doi: 10.1007/s00520-011-1113-0. [DOI] [PubMed] [Google Scholar]
- 21.Frigo L, Luppi JS, Favero GM, Maria DA, Penna SC, Bjordal JM, Bensadoun RJ, Lopes-Martins RA. BMC Cancer. 2009;9:404. doi: 10.1186/1471-2407-9-404. [DOI] [PMC free article] [PubMed] [Google Scholar]
- 22.Pourzarandian A, Watanabe H, Ruwanpura SM, Aoki A, Ishikawa I. J Periodontol. 2005;76:187–193. doi: 10.1902/jop.2005.76.2.187. [DOI] [PubMed] [Google Scholar]
- 23.Prabhu V, Rao SB, Chandra S, Kumar P, Rao L, Guddattu V, Satyamoorthy K, Mahato KK. J Biophotonics. 2012;5:168–184. doi: 10.1002/jbio.201100089. [DOI] [PubMed] [Google Scholar]
- 24.Sroka R, Schaffer M, Fuchs C, Pongratz T, Schrader-Reichard U, Busch M, Schaffer PM, Duhmke E, Baumgartner R. Lasers Surg Med. 1999;25:263–271. doi: 10.1002/(sici)1096-9101(1999)25:3<263::aid-lsm11>3.0.co;2-t. [DOI] [PubMed] [Google Scholar]
- 25.Molinolo AA, Hewitt SM, Amornphimoltham P, Keelawat S, Rangdaeng S, Meneses Garcia A, Raimondi AR, Jufe R, Itoiz M, Gao Y, Saranath D, Kaleebi GS, Yoo GH, Leak L, Myers EM, Shintani S, Wong D, Massey HD, Yeudall WA, Lonardo F, Ensley J, Gutkind JS. Clin Cancer Res. 2007;13:4964–4973. doi: 10.1158/1078-0432.CCR-07-1041. [DOI] [PubMed] [Google Scholar]
- 26.Giudice FS, Dal Vechio AM, Abrahao AC, Sperandio FF, Pinto-Junior Ddos S. J Oral Pathol Med. 2011;40:405–411. doi: 10.1111/j.1600-0714.2010.00960.x. [DOI] [PubMed] [Google Scholar]
- 27.Gassmann M, Grenacher B, Rohde B, Vogel J. Electrophoresis. 2009;30:1845–1855. doi: 10.1002/elps.200800720. [DOI] [PubMed] [Google Scholar]
- 28.Gavish L, Asher Y, Becker Y, Kleinman Y. Lasers Surg Med. 2004;35:369–376. doi: 10.1002/lsm.20108. [DOI] [PubMed] [Google Scholar]
- 29.Karu T. J Photochem Photobiol B. 1999;49:1–17. doi: 10.1016/S1011-1344(98)00219-X. [DOI] [PubMed] [Google Scholar]
- 30.de Monteiro CJS, Pinheiro AN, de Oliveira SC, Aciole GT, Sousa JA, Canguss MC, Dos Santos JN. Photomed Laser Surg. 2011;29:741–745. doi: 10.1089/pho.2010.2896. [DOI] [PubMed] [Google Scholar]
- 31.Liu YH, Cheng CC, Ho CC, Pei RJ, Lee KY, Yeh KT, Chan Y, Lai YS. Res Commun Mol Pathol Pharmacol. 2004;115–116:185–201. [PubMed] [Google Scholar]
- 32.Renno AC, McDonnell PA, Parizotto NA, Laakso EL. Photomed Laser Surg. 2007;25:275–280. doi: 10.1089/pho.2007.2055. [DOI] [PubMed] [Google Scholar]
- 33.Salate AC, Barbosa G, Gaspar P, Koeke PU, Parizotto NA, Benze BG, Foschiani D. Photomed Laser Surg. 2005;23:470–475. doi: 10.1089/pho.2005.23.470. [DOI] [PubMed] [Google Scholar]
- 34.Yu W, Naim JO, Lanzafame RJ. Photochem Photobiol. 1994;59:167–170. doi: 10.1111/j.1751-1097.1994.tb05017.x. [DOI] [PubMed] [Google Scholar]
- 35.Yu HS, Chang KL, Yu CL, Chen JW, Chen GS. J Invest Dermatol. 1996;107:593–596. doi: 10.1111/1523-1747.ep12583090. [DOI] [PubMed] [Google Scholar]
- 36.Khan FA, Robinson PG, Warnakulasuriya KA, Newton JT, Gelbier S, Gibbons DE. J Oral Pathol Med. 2000;29:214–219. doi: 10.1034/j.1600-0714.2000.290504.x. [DOI] [PubMed] [Google Scholar]
- 37.Hildebrandt MA, Lippman SM, Etzel CJ, Kim E, Lee JJ, Khuri FR, Spitz MR, Lotan R, Hong WK, Wu X. Clin Cancer Res. 2012;18:3705–3713. doi: 10.1158/1078-0432.CCR-11-3271. [DOI] [PMC free article] [PubMed] [Google Scholar]
- 38.Leopoldino AM, Squarize CH, Garcia CB, Almeida LO, Pestana CR, Sobral LM, Uyemura SA, Tajara EH, Silvio Gutkind J, Curti C. Oral Oncol. Philadelphia: [29.06.2012]. SET protein accumulates in HNSCC and contributes to cell survival: Antioxidant defense, Akt phosphorylation and AVOs acidification. [DOI] [PubMed] [Google Scholar]
- 39.Motokura T, Arnold A. Curr Opin Genet Dev. 1993;3:5–10. doi: 10.1016/s0959-437x(05)80334-x. [DOI] [PubMed] [Google Scholar]
- 40.Schweinfest CW, Graber MW, Henderson KW, Papas TS, Baron PL, Watson DK. Biochim Biophys Acta. 1998;1398:18–24. doi: 10.1016/s0167-4781(98)00031-1. [DOI] [PubMed] [Google Scholar]
- 41.Cerniglia GJ, Karar J, Tyagi S, Christofidou-Solomidou M, Rengan R, Koumenis C, Maity A. Mol Pharmacol. 2012 doi: 10.1124/mol.112.080408. [DOI] [PMC free article] [PubMed] [Google Scholar]
- 42.Manning BD, Cantley LC. Cell. 2007;129:1261–1274. doi: 10.1016/j.cell.2007.06.009. [DOI] [PMC free article] [PubMed] [Google Scholar]
- 43.Aziz SA, Davies M, Pick E, Zito C, Jilaveanu L, Camp RL, Rimm DL, Kluger Y, Kluger HM. Clin Cancer Res. 2009;15:3029–3036. doi: 10.1158/1078-0432.CCR-08-2768. [DOI] [PMC free article] [PubMed] [Google Scholar]
- 44.Zhang L, Xing D, Gao X, Wu S. J Cell Physiol. 2009;219:553–562. doi: 10.1002/jcp.21697. [DOI] [PubMed] [Google Scholar]
- 45.Zhang L, Zhang Y, Xing D. J Cell Physiol. 2010;224:218–228. doi: 10.1002/jcp.22123. [DOI] [PubMed] [Google Scholar]
- 46.Cross DA, Alessi DR, Cohen P, Andjelkovich M, Hemmings BA. Nature. 1995;378:785–789. doi: 10.1038/378785a0. [DOI] [PubMed] [Google Scholar]
- 47.Horibe T, Torisawa A, Kohno M, Kawakami K. Molecular cancer. 2012;11:59. doi: 10.1186/1476-4598-11-59. [DOI] [PMC free article] [PubMed] [Google Scholar]
- 48.Grammatikakis N, Vultur A, Ramana CV, Siganou A, Schweinfest CW, Watson DK, Raptis L. J Biol Chem. 2002;277:8312–8320. doi: 10.1074/jbc.M109200200. [DOI] [PubMed] [Google Scholar]
- 49.Peinado H, Aleckovic M, Lavotshkin S, Matei I, Costa-Silva B, Moreno-Bueno G, Hergueta-Redondo M, Williams C, Garcia-Santos G, Ghajar C, Nitadori-Hoshino A, Hoffman C, Badal K, Garcia BA, Callahan MK, Yuan J, Martins VR, Skog J, Kaplan RN, Brady MS, Wolchok JD, Chapman PB, Kang Y, Bromberg J, Lyden D. Nat Med. 2012;18:883–891. doi: 10.1038/nm.2753. [DOI] [PMC free article] [PubMed] [Google Scholar]
- 50.Seluanov A, Hine C, Azpurua J, Feigenson M, Bozzella M, Mao Z, Catania KC, Gorbunova V. Proc Natl Acad Sci USA. 2009;106:19352–19357. doi: 10.1073/pnas.0905252106. [DOI] [PMC free article] [PubMed] [Google Scholar]
- 51.Zhang J, Xing D, Gao X. J Cell Physiol. 2008;217:518–528. doi: 10.1002/jcp.21529. [DOI] [PubMed] [Google Scholar]
- 52.Franke TF, Kaplan DR, Cantley LC. Cell. 1997;88:435–437. doi: 10.1016/s0092-8674(00)81883-8. [DOI] [PubMed] [Google Scholar]
- 53.Zhang X, Zhang H, Tighiouart M, Lee JE, Shin HJ, Khuri FR, Yang CS, Chen Z, Shin DM. Int J Cancer. 2008;123:1005–1014. doi: 10.1002/ijc.23585. [DOI] [PMC free article] [PubMed] [Google Scholar]
- 54.Badve S, Collins NR, Bhat-Nakshatri P, Turbin D, Leung S, Thorat M, Dunn SE, Geistlinger TR, Carroll JS, Brown M, Bose S, Teitell MA, Nakshatri H. Am J Pathol. 2010;176:2139–2149. doi: 10.2353/ajpath.2010.090477. [DOI] [PMC free article] [PubMed] [Google Scholar]
- 55.Van de Sande T, Roskams T, Lerut E, Joniau S, Van Poppel H, Verhoeven G, Swinnen JV. J Pathol. 2005;206:214–219. doi: 10.1002/path.1760. [DOI] [PubMed] [Google Scholar]
Associated Data
This section collects any data citations, data availability statements, or supplementary materials included in this article.


