

Abstract
Well-differentiated thyroid cancer most frequently occurs in premenopausal women. Greater exposure to estrogens may be a risk factor for thyroid cancer. To investigate the role of estrogens in thyroid cancer, a spot urine sample was obtained from 40 women with thyroid cancer and 40 age-matched controls. Thirty-eight estrogen metabolites, conjugates and DNA adducts were analyzed by using ultraperformance liquid chromatography/tandem mass spectrometry, and the ratio of adducts to metabolites and conjugates was calculated for each sample. The ratio of depurinating estrogen-DNA adducts to estrogen metabolites and conjugates significantly differed between cases and controls (p<0.0001), demonstrating high specificity and sensitivity. These findings indicate that estrogen metabolism is unbalanced in thyroid cancer and suggest that formation of estrogen-DNA adducts might play a role in the initiation of thyroid cancer.
Keywords: thyroid cancer, estrogen-DNA adducts, unbalanced estrogen metabolism
Introduction
Well-differentiated thyroid cancer (papillary and follicular) is the most common endocrine malignancy and most frequently occurs in premenopausal women. Rates of thyroid cancer in women are estimated to be three times that of men, and overall rates of thyroid cancer have been on the rise (1–4). The American Cancer Society estimates that 56,460 new cases of thyroid cancer were diagnosed in 2012, and 43,210 were in women. It is estimated that 1780 people will die of thyroid cancer this year, of whom 1000 will be women (5).
Links between estrogens and thyroid cancer have been reported. Both estrogen receptor alpha (ERα) and ERβ are present in thyroid tissue, and treatment with 17β-estradiol (E2) can result in increased proliferation of both benign and malignant thyroid cells (6). E2 has also been shown to activate the mitogen-activated protein kinase (MAPkinase) pathway and mitogenesis can be blocked by either a MAPkinase inhibitor or an estrogen antagonist. Additional studies have shown that E2 resulted in a growth response in thyroid cancer cells, acting through the G-coupled receptor 30 (GPR30) and the MAPkinase pathway (7). ERα was shown to be present in 87.5% of patients with thyroid cancer diagnosed during pregnancy and 31% of cancer diagnosed within the first post-partum year (8). ERβ was also found to be over-expressed in thyroid cancers with invasive behavior (9). All of these studies suggest that ER-mediated events may play a central role in the promotion and progression of thyroid cancer similarly to other estrogen-mediated cancers, such as breast cancer.
Several epidemiological studies suggest that women with thyroid cancer have an elevated risk of developing breast cancer (6–10). Investigators at MD Anderson used the Surveillance, Epidemiology and End Results (SEER) data collected by the National Cancer Institute from 1973–1994 and found a relative risk of 1.42 (p=0.001) for breast cancer in premenopausal Caucasian women with a previous diagnosis of thyroid cancer (11). This population-based study utilizing 1,333,115 person-years of follow-up did not find that women with breast cancer were at increased risk of developing thyroid cancer. A second large study replicated these findings in women with thyroid cancer, but in addition found an association between having breast cancer and later developing thyroid cancer (12). Ninety percent of patients developed the second primary cancer within five years. In this study, the preponderance of having both cancers was highest in Caucasian women 40 to 48 years of age. However, other studies have found that the increase in breast cancer incidence occurred in women prior to and after treatment for thyroid cancer, indicating that they may have a common etiologic or genetic predisposition to both cancers or other malignancies (13,14).
We have previously published data showing increased levels of estrogen-DNA adducts in patients with breast cancer, prostate cancer, and non-Hodgkin lymphoma (15–20). Because of the possible association between thyroid cancer and estrogens, we sought to evaluate whether the ratio of estrogen-DNA adducts to estrogen metabolites and conjugates is elevated in women with well differentiated thyroid cancer compared to women without thyroid cancer.
Methods
Materials
The estrogen metabolites 4-hydroxyestradiol (4-OHE2) and 4-hydroxyestrone (4-OHE1) were synthesized as previously described (21). Quinone conjugates were synthesized by using the procedure of Cao, et al. (22). Estrogen-DNA adducts were synthesized by following reported methods (23–25). All other analytical standards were purchased from Steraloids Inc. (Newport, RI). Phenyl solid phase extraction (SPE) cartridges were purchased from Varian (Palo Alto, CA), and 5000 m.w. cutoff filters were purchased from Millipore (Bedford, MA). All other chemicals and solvents were the highest analytical grade available and purchased from Sigma-Aldrich (St. Louis, MO).
Study Population
Cases
Cases were obtained from women who had enrolled in the University of Nebraska Thyroid Tumor and Cancer Collaborative Registry (TCCR). The registry collects extensive demographic information including family history, occupational, and exposure analysis, dietary and lifestyle habits, in addition to comprehensive medical history, coupled with a biospecimen bank for blood, urine, and tissue on each person. Urine is collected at the time the patient is enrolled in the registry. Biospecimens are not collected if the patient is pregnant or lactating or is within 3 months of a radioactive iodine treatment or radiation treatment. For this study, only women with differentiated thyroid cancer who were age matched to the controls were used. Urine was processed the same for all specimens as described in the methods.
Normal Controls
Urine samples from the control subjects were obtained from volunteer women recruited at the University of Nebraska Medical Center (UNMC) among patients and staff. They did not have a history of any form of cancer, except possible basal or squamous cell carcinoma of the skin. Inclusion criteria prohibited use of exogenous hormones within the three months prior to collecting a urine sample.
The study protocol was approved by the Institutional Review Board, the Scientific Review Committee, and the TCCR Steering Committee at UNMC.
Sample Collection
As part of the TCCR, a spot urine sample was collected from each participant with thyroid cancer. Approximately 50 ml of urine was obtained in a urine specimen cup containing 1mg/ml ascorbic acid (to prevent oxidation of catechol estrogen metabolites). Urine samples were aliquoted, frozen and transferred to the Cavalieri-Rogan laboratory, UNMC, on dry ice and stored at −80 °C until analysis. Thus, each analytical sample was thawed only once prior to analysis. Urine samples from control subjects were collected, handled and stored in the same way.
Laboratory Analysis
To minimize variation, storage (−80 °C) and transport (on dry ice) of all urine samples were standardized. The samples were randomly divided into sets of 20 each and processed identically. All of the study samples were analyzed in triplicate in a blinded fashion.
A 2-ml aliquot of each urine sample was partially purified by using the SPE phenyl cartridges. The SPE cartridges were pre-conditioned with methanol and the loading buffer, 10 mM ammonium formate, pH 7. Before loading onto the SPE cartridge, the pH of each urine sample was adjusted to 7 using HCl or NaOH, depending upon the initial condition. The cartridges were washed with 250 μl of loading buffer, and then the compounds of interest were eluted from the cartridge by using an elution buffer, methanol/10 mM ammonium formate, pH 7 (90:10) with 1% acetic acid. The collected eluates were concentrated with a SpeedVac and lyophilized. The lyophilized eluates were reconstituted in 50 μl of methanol-water solution (1:1) and passed through a 5000 m.w. cut-off filter. Then 10 μl of each sample was subjected to ultraperformance liquid chromatography/tandem mass spectrometry (UPLC-MS/MS) analysis.
UPLC-MS/MS analyses were carried out with a Waters Acquity UPLC system connected with a high performance Quattro Micro triple quadrupole mass spectrometer. Analytical separation was carried out by injecting 10 μl of each partially purified urine sample into an Acquity UPLC BEH C18 1.7 μm column (1 × 100 mm) at a flow rate of 0.15 ml/min. The gradient started with 80% A (0.1% formic acid in H2O) and 20% B (0.1% formic acid in CH3CN), changed to 79% A over 4 min, followed by a 6-min linear gradient to 45% A, resulting in a total separation time of 10 min. The elutions from the UPLC column were introduced to the Quattro Micro mass spectrometer.
The electrospray ionization (ESI) method was used in positive ion mode with a capillary voltage of 3.0 kV, an extractor cone voltage of 3 V, and a detector voltage of 650 V. Desolvation gas flow was maintained at 600 l/h. Cone gas flow was set at 60 l/h. Desolvation temperature and source temperature were set to 200 °C and 100 °C, respectively. Tandem mass spectrometry (MS/MS) was performed in a multiple reaction monitoring (MRM) mode to produce structural information about a compound by fragmenting specific parent ions inside the mass spectrometer and identifying the resulting fragment ions. Resulting data were processed by using QuanLynx software (Waters) to quantify the estrogen metabolites, conjugates and DNA adducts. The precision of these analyses is provided by the limit of detection and coefficient of variation for the UPLC-MS/MS method, which were presented earlier (15).
A batch of 20 samples was run in triplicate for UPLC-MS/MS analysis. For each batch of samples, pure standards were used to optimize the UPLC-MS/MS conditions prior to analysis. Also for each batch, the standard mixture was run before the first sample, after the 10th sample and after the last (20th) sample to prevent errors due to matrix effect and day-to-day instrument variations. In addition, immediately after the initial standard and before the first sample, one set of spiked samples was run to adjust for any drift in the retention time of all estrogen-related compounds due to the matrix effect. After UPLC analysis, the mean value was calculated for all the compounds detected in each sample.
The ratio of adducts to their respective metabolites and conjugates was calculated according to the following formula (15):
The estrogen metabolites include 2-OHE1(E2) and 4-OHE1(E2). The conjugates include 2-OCH3E1(E2), 4-OCH3E1(E2), 2-OHE1(E2)-1-glutathione (SG), 2-OHE1(E2)-4-SG, 2-OHE1(E2)-1-cysteine (Cys), 2-OHE1(E2)-4-Cys, 2-OHE1(E2)-1-N-acetylcysteine (NAcCys), 2-OHE1(E2)-4-NAcCys, 4-OHE1(E2)-2-SG, 4-OHE1(E2)-2-Cys, and 4-OHE1(E2)-2-NAcCys. The adducts include 4-OHE1(E2)-1-N3Ade, 4-OHE1(E2)-1-N7Gua, and 2-OHE1(E2)-6-N3Ade.
The concentration of each of the compounds and the ratio of depurinating N3Ade and N7Gua adducts to the sum of their respective estrogen metabolites and conjugates in each urine sample provides a ratio, which reflects the degree of imbalance in estrogen metabolism that may lead to cancer initiation. The results from one woman with thyroid cancer (sample 21) and one healthy control woman (sample 23) are presented in Table 1. The results from additional samples are presented in supplemental information.
Table 1.
Results from a representative case and a control
| No. | Compound | Thyroid Cancer Sample 21 Age 47 years (pg/μl) | Thyroid Control Sample 23 Age 47 years (pg/μl) |
|---|---|---|---|
| 1 | 2-OHE2 | 18.7 ± 4.9 | 58.7 ± 12.6 |
| 2 | 2-OHE1 | 48.7 ± 4.7 | 31.7 ± 18.5 |
| 3 | 4-OHE2 | 29.5 ± 4.8 | 30.6 ± 9.0 |
| 4 | 4OHE1 | 156.7 ± 41.8 | 146.6 ± 14.6 |
| 5 | 2-OCH3E2 | 51.9 ± 3.3 | 44.9 ± 5.6 |
| 6 | 2-OCH3E1 | 28.0 ± 14.7 | 233.1 ± 133.6 |
| 7 | 4-OCH3E2 | 11.9 ± 7.5 | 63.8 ± 30.4 |
| 8 | 4-OCH3E1 | 29.5 ± 18.4 | 297.6 ± 60.6 |
| 9 | 2-OHE2-1-SG | 12.4 ± 2.7 | 11.8 ± 3.3 |
| 10 | 2-OHE2-4-SG | 9.2 ± 2.6 | 14.9 ± 4.1 |
| 11 | 2-OHE1-1-SG | 8.0 ± 1.6 | 11.3 ± 3.6 |
| 12 | 2-OHE1-4-SG | 8.6 ± 0.8 | 11.3 ± 3.6 |
| 13 | 2-OHE2-1+4-Cys | 3.6 ± 2.7 | 18.5 ± 5.2 |
| 14 | 2-OHE1-1-Cys | 0.5 ± 0.2 | 10.1 ± 3.0 |
| 15 | 2-OHE1-4-Cys | 0.5 ± 0.2 | 10.1 ± 3.0 |
| 16 | 2-OHE2-1-NAcCys | 2.1 ± 2.4 | 9.1 ± 2.2 |
| 17 | 2-OHE2-4-NAcCys | 2.1 ± 2.3 | 9.1 ± 2.2 |
| 18 | 2-OHE1-1-NAcCys | 3.2 ± 2.0 | 8.2 ± 4.3 |
| 19 | 2-OHE1-4-NAcCys | 3.2 ± 2.0 | 8.2 ± 4.3 |
| 20 | 4-OHE2-2-SG | 26.4 ± 4.4 | 21.0 ± 5.0 |
| 21 | 4-OHE1-2-SG | 10.1 ± 3.8 | 31.3 ± 9.7 |
| 22 | 4-OHE2-2-Cys | 4.0 ± 2.7 | 17.4 ± 4.5 |
| 23 | 4-OHE1-2-Cys | 4.9 ± 3.0 | 12.8 ± 8.7 |
| 24 | 4-OHE2-2-NAcCys | 1.9 ± 0.5 | 15.5 ± 3.4 |
| 25 | 4-OHE1-2-NAcCys | 3.2 ± 1.2 | 5.9 ± 3.7 |
| 26 | 4-OHE2-1-N7Gua | 9.3 ± 0.9 | 2.2 ± 0.9 |
| 27 | 4-OHE1-1-N7Gua | 24.5 ± 2.2 | 2.0 ± 0.8 |
| 28 | 4-OHE2-1-N3Ade | 31.6 ± 8.1 | 2.1 ± 0.7 |
| 29 | 4-OHE1-1-N3Ade | 8.8 ± 2.7 | 2.0 ± 0.4 |
| 30 | 2-OHE2-6-N3Ade | 10.7 ± 2.6 | 1.0 ± 0.3 |
| 31 | 2-OHE1-6-N3Ade | 1.7 ± 0.6 | 2.0 ± 0.3 |
|
|
|||
| Ratio | Ratio | ||
| 330.7 ± 27.7 | 23.1 ± 6.1 | ||
Statistical Analyses
The adduct ratios in women with thyroid cancer were compared to those in age-matched control women (±7 years). Thyroid cases were described by type of thyroid cancer and stage at diagnosis. Normality was assessed using the Shapiro-Wilk test. Age was normally distributed, allowing the t-test to be used. A natural log transformation of the adduct ratio resulted in a normally-distributed variable, which could be used in t-tests to compare the ratio level in premenopausal and peri/postmenopausal women. Pearson’s correlation coefficient was used to assess the linear relationship between age and the adduct ratio. Four perimenopausal women were grouped with the menopausal women because androstenediol profiles are altered in perimenopausal women (26,27) making them more similar to menopausal women than to premenopausal women. Tests for significant differences in the adduct ratio by type of thyroid cancer diagnosis and stage at diagnosis were limited due to sample size.
Receiver operating characteristic (ROC) curves, generated using logistic regression, were used to determine the power of the adduct ratio to discriminate between cases of thyroid cancer and controls using various threshold values of the adduct ratio. The area under the ROC curve (AUC) represents the probability of correctly identifying a case of thyroid cancer. If the adduct ratio showed a probability of 50%, then it would perform no better than chance. An AUC of one means it is an infallible predictor of disease. Sensitivity and specificity were calculated using five unit cut-off values generated from 2 × 2 frequency tables in an iterative process. The 95% confidence interval around the “optimal” threshold was calculated using the exact binomial distribution. Results of classification at each cut-off point were plotted to visualize their relationship and determine the cutoff point with highest sensitivity at a given level of specificity.
Lastly, we stratified by the adduct ratio cut-off point identified in the sensitivity-specificity analysis and assessed whether premenopausal women were at an increased odds of thyroid cancer if they had a high adduct ratio compared to post-menopausal women. We used logistic regression in the group with a high adduct ratio to calculate the odds ratio (OR) for being premenopausal and having thyroid cancer. Results were considered significant at the p=0.05 confidence level. All analyses were conducted in SAS version 9.3.
Results
Patient characteristics
As expected, the mean age of cases did not differ from controls (p=0.95) (Table 2). Slightly over half of the sample was premenopausal. Menopausal status was not associated with having thyroid cancer (p=0.82) (Table 2). Of the 40 thyroid cancer cases, 31 (79.5%) were papillary thyroid cancer; three, follicular thyroid cancer; four, a follicular variant of thyroid cancer; one, hurthle cell thyroid cancer; and one, unknown type of thyroid cancer (the patient was originally treated outside of our facility and we could not obtain her pathology). The distribution of thyroid cancer subtypes is representative of thyroid cancer in the population (2). According to the American Joint Commission on Cancer (AJCC) TNM system of staging, 7th Edition, most of the thyroid cancers were stage 1 (n=28, 77.8%) and the remaining cancers stage 2 (n=4) and 3 (n=4).
Table 2.
Characteristics of thyroid cancer cases (n= 40) and controls (n=40).
| Characteristic | Thyroid cancer | Control | Entire Sample |
|---|---|---|---|
|
Continuous variables (Mean ± SD)
| |||
| Age | 46.7 ± 12.5 | 46.5 ± 9.77 | 46.6 ± 11.1 |
| DNA adduct ratio * | 102.7 ± 73.1 | 13.5 ± 8.91 | 58.1 ± 68.5 |
|
| |||
|
Categorical variables n (%)
| |||
| Peri/Post-Menopausal | |||
| Yes | 19 (47.5) | 18 (45.0) | 37 (46.3) |
| No | 21 (52.5) | 22 (55.0) | 43 (53.7) |
| Binary adduct ratio * | |||
| <= 20 | 0 | 30 (75.0) | 30 (37.5) |
| > 20 | 40 (100.0) | 10 (25.0) | 50 (62.5) |
P<0.0001
Estrogen metabolism in cases and controls
The ratio of depurinating estrogen-DNA adducts to estrogen metabolites and conjugates, as defined in the Materials and Methods section, was calculated for each subject (Fig. 1). The adduct ratio significantly differed between cases and controls [t=−11.90, df= 65, p<0.0001 (Table 2)]. Age was not significantly correlated with the adduct ratio (r=0.15, p=0.19). The higher ratio in the cases indicates that estrogen metabolism is unbalanced in these women, resulting in higher levels of the metabolites, catechol estrogen quinones, that react with DNA to form estrogen-DNA adducts. The degree of imbalance in estrogen metabolism in the women with thyroid cancer is great enough that the increased ratio of estrogen-DNA adducts to metabolites and conjugates can be detected systemically, in the urine.
Figure 1.

Ratio of urinary depurinating estrogen-DNA adducts to estrogen metabolites and conjugates for women diagnosed with thyroid cancer (cases) or not diagnosed with cancer (controls). The ratio is defined in the Materials and Methods Section. The dotted line representing a ratio of 30 is the cross-over point for sensitivity and specificity of the ratio (see Fig. 3). Insert: Ratios presented as median values and ranges (min to max). The diamonds represent the mean values.
No significant differences (p=0.35) in the adduct ratio were identified between the 31 cases with papillary (M=95.4, SD=65.8) compared to the 9 with follicular or other type of thyroid cancer diagnosis (M=127.5, SD=94.3). The adduct ratio was similar (p=0.78) in the 28 with stage 1 thyroid cancer (M=96.8, SD=78) as in the 8 with stage 2 or 3 cancer (M=102.9, SD=64). The numbers were too small to stratify further by cancer type or stage.
Sensitivity and specificity
The ROC analysis showed that the adduct ratio did significantly better than chance at identifying those with thyroid cancer (p<0.0001, Fig. 2). The AUC representing the average sensitivity of the adduct ratio over the range of specificities was 0.99 (95% confidence interval 0.98–1.00). The specificity curve intersects the sensitivity curve at an adduct ratio value of 30 (Fig. 3), demonstrating both high specificity and high sensitivity. At an adduct ratio value of 20 (95% CI 0.91–1.00), the ratio correctly identified a woman as having thyroid cancer 100% of the time. At this same cutoff value of 20, the specificity was 77.5, which means that 77.5% of the time a women without thyroid cancer will be correctly classified as not having cancer. Adjusting the analysis for menopausal status did not alter the ROC results, despite the significant association between the adduct ratio and both menopausal status and thyroid cancer (data not shown). We think the reason the adduct ratio classifies women accurately is that it represents a net effect of both the activating and protective enzyme activities in the pathway of estrogen metabolism.
Figure 2.

Receiver Operating Characteristic curve of sensitivity vs. 1-specificity calculated from logistic regression models.
Figure 3.
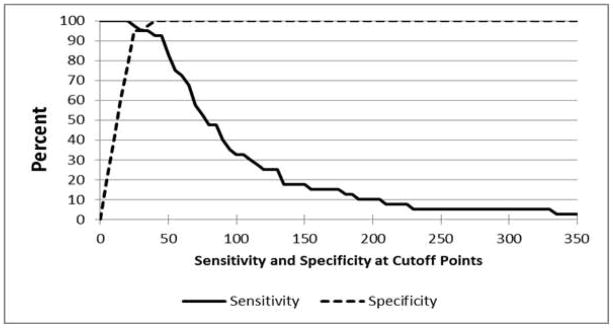
Sensitivity and specificity at cut-points from 0 to 350 of the DNA adduct ratio in 40 cases of thyroid cancer and 40 non-cancer controls; sensitivity equals specificity at an adduct ratio cut-off value of 30.
Effects of menopausal status
The adduct ratio was significantly higher in menopausal women (cases and controls combined) (n=37, M=62.1, SD=56.2, range 4.7–225) compared to premenopausal women (n=43, M=54.6, SD=78.0, range 0.4–351) (t=2.33, df=71, p=0.02). However, in the women with a ratio above 20, premenopausal women had elevated mean ratios compared to post-menopausal women (premenopausal: n=22 M=99.7 SD=88.3 vs. post-menopausal: n=28 M=77.5 SD=56.5). Due to the ratio providing nearly perfect discrimination between cases and controls, the logistic regression maximum likelihood models failed to converge. At a cut-off of 20 or less, there were no women with thyroid cancer, resulting in a zero cell. Given these constraints, we stratified the sample using the cut-off of 20 and analyzed the group whose ratio was > 20 where there was greater heterogeneity. We then assessed whether, in this subgroup, premenopausal women were at higher risk of thyroid cancer than post-menopausal women. Compared to post-menopausal women, the OR for thyroid cancer in premenopausal women was 9.95 (CI 1.15–86.0). The broad confidence interval reflects the small sample size and greater variability in the adduct ratio in premenopausal women, but the magnitude of the OR suggests the possibility that thyroid cancer risk may be higher in premenopausal women with high adduct levels than menopausal women with high adduct levels. This observation warrants further investigation in a larger sample.
Discussion and Conclusions
In this article, we report the novel finding that the ratio of depurinating estrogen-DNA adducts to estrogen metabolites and conjugates is significantly elevated in women with well differentiated thyroid cancer, compared to the ratio in age-matched control women (Fig. 1).
An imbalance in estrogen metabolism may, at least partially, explain the previous associations between the risk of thyroid cancer and breast cancer (11,12). Preliminary results suggest that a high adduct ratio in premenopausal women is more strongly associated with thyroid cancer than in post-menopausal women. The adduct ratio showed greater variability in the premenopausal women compared to post-menopausal women. This variability may reflect a subset of premenopausal women who are at an elevated risk of developing breast cancer.
The higher ratio of estrogen-DNA adducts to estrogen metabolites and conjugates in thyroid cancer cases vs controls is similar to the results of previous studies in breast cancer (15–17), prostate cancer (18,19) and non-Hodgkin lymphoma (20). The differentiation between cases and controls (M = 102.7 vs M = 13.2, respectively) in this study is much more pronounced than in the previous studies of other types of cancer (15–20). This study shows the ratio to be a measure of estrogen imbalance with very high sensitivity and high specificity (Fig. 3 As an overall measure of estrogen imbalance, the adduct ratio is nearly perfect at identifying women with thyroid cancer and reasonably unlikely to misclassify women without thyroid cancer.
We hypothesize that initiation of thyroid cancer, analogously to breast cancer (15–17), prostate cancer (18,19) and non-Hodgkin lymphoma (20), arises from the estrogens acting not as hormones, but as chemicals that are metabolically activated to the ultimate carcinogenic metabolites, estrogen-3,4-quinones (Fig. 4). Reaction of these metabolites with DNA forms estrogen-DNA adducts that can initiate the series of events leading to thyroid cancer. In this mechanism of cancer initiation, estrogen metabolism is unbalanced toward oxidative metabolism. The estrogens, E1 and E2, are oxidized by cytochrome P450 1B1 to the catechol estrogens, 4-OHE1(E2) and then to the estrogen 3,4-quinones [E1(E2)-3,4-Q], which react with DNA to form the 4-OHE1(E2)-1-N3Ade and 4-OHE1(E2)-1-N7Gua adducts (28). These adducts depurinate from DNA, leaving apurinic sites in the DNA that can generate oncogenic mutations. These mutations start the process that can result in cancer (Fig. 4).
Figure 4.
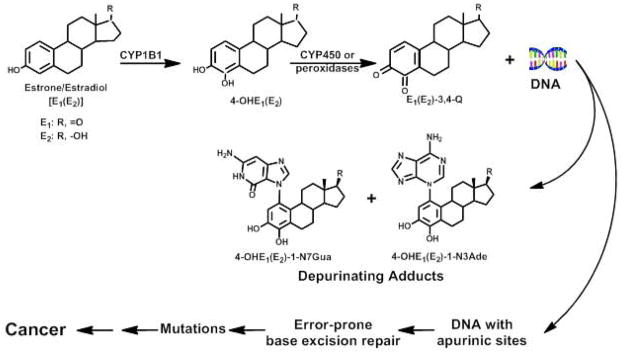
Preponderant metabolic pathway in cancer initiation by estrogens.
Stable estrogen-DNA adducts comprise a small portion of total adducts formed by catechol estrogen quinones. In vitro, reaction of catechol estrogen quinones or enzyme-activated catechol estrogens with DNA resulted in at least 99% depurinating adducts and less than 1% stable adducts [25]. In the animal models mouse skin and rat mammary gland treated with E2-3,4-quinone, depurinating adducts comprised more than 99% of the total adducts formed, with less than 1% stable adducts [29,30]. In addition, the marginally carcinogenic 2-OHE2 [31–33] forms 10–40 times more stable adducts when reacted with DNA in vitro than the carcinogenic 4-OHE2 [34]. These results strongly support a critical role of depurinating estrogen-DNA adducts and a minimal role of stable estrogen-DNA adducts in cancer initiation.
The estrogen-DNA adducts travel through the circulatory system and can be measured in the urine or serum (Fig. 1) (15–20). This finding is consistent with the hypothesis that formation of depurinating estrogen-DNA adducts, which generate apurinic sites in the DNA, leads to mutations that can initiate the series of events resulting in thyroid cancer (28).
Limitations of this study include the relatively small sample size and the need for confirmation in larger studies. The results of this initial study of the elevated formation of estrogen-DNA adducts in women with well differentiated thyroid cancer suggest other studies that should be pursued.
Since the ratio appears to have an extremely high sensitivity and specificity for thyroid cancer, it could potentially act as a biomarker in patients with thyroid nodules. In this study, we compared women with and without thyroid cancer, but did not include women with thyroid nodules. An important next step will be to evaluate whether the ratio of estrogen-DNA adducts to estrogen metabolites and conjugates is significantly different in women with thyroid nodules leading to thyroid cancer, compared to women with thyroid nodules that do not progress to thyroid cancer. If this proves to be true, this result would provide additional support for the ratio as a potential biomarker for thyroid cancer risk in patients with indeterminate biopsies or thyroid nodules that are too small to evaluate with biopsy.
In conclusion, estrogen metabolism was unbalanced and the ratio of depurinating estrogen-DNA adducts to estrogen metabolites and conjugates was significantly higher in women with well differentiated thyroid cancer compared to control women not diagnosed with cancer (p<0.0001). These results suggest that formation of estrogen-DNA adducts could be the initiating event for women developing thyroid cancer.
Furthermore, future studies of the formation of depurinating estrogen-DNA adducts in relation to thyroid cancer may suggest approaches for prevention.
Supplementary Material
Novelty and Impact Statements.
The novelty of this article is the demonstration of unbalanced estrogen metabolism resulting in formation of estrogen-DNA adducts in women with thyroid cancer compared to women without thyroid cancer. This suggests that formation of estrogen-DNA adducts plays a major role in the etiology of thyroid cancer in women.
Acknowledgments
We thank Jacques E. Dumont, M.D., Ph.D., University, Brussels School of Medicine, Belgium, for partial support of this study. Core support at the Eppley Institute was supported by grant P30 36727 from the National Cancer Institute.
This study used data from the Thyroid Tumor and Cancer Collaborative Registry (TCCR) at the University of Nebraska, Omaha, NE. The TCCR was jointly funded by the Department of Internal Medicine, the Department of Head and Neck Surgical Oncology, and the Eppley Cancer Center, University of Nebraska Medical Center, Omaha, NE.
Abbreviations
- AJCC
American Joint Commission on Cancer
- AUC
area under the ROC curve
- Cys
cysteine
- E2
estradiol
- ERα
estrogen receptor alpha
- ESI
electrospray ionization
- GPR30
G-coupled receptor 30
- MAPkinase
mitogen-activated protein kinase
- MRM
multiple reaction monitoring
- MS/MS
tandem mass spectrometry
- NAcCys
N-acetylcysteine
- 4-OHE1
4-hydroxyestrone
- 4-OHE2
4-hydroxyestradiol
- ROC
receiver operating characteristic
- SEER
Surveillance, Epidemiology and End Results
- SG
glutathione
- SPE
solid phase extraction
- TCCR
Thyroid Tumor and Cancer Collaborative Registry
- UNMC
University of Nebraska Medical Center
- UPLC-MS/MS
ultraperformance liquid chromatography/tandem mass spectrometry
Literature Cited
- 1.Albores-Saavedra J, Henson DE, Glazer A, Schwartz AM. Changing patterns in the incidence and survival of thyroid cancer with follicular phenotype-papillary, follicular, and anaplastic: a morphological and epidemiological study. Endocr Pathol. 2007;18:1–7. doi: 10.1007/s12022-007-0002-z. [DOI] [PubMed] [Google Scholar]
- 2.Chen AY, Jemal A, Ward EM. Increasing incidence of differentiated thyroid cancer in the United States, 1988–2005. Cancer. 2009;115:3801–7. doi: 10.1002/cncr.24416. [DOI] [PubMed] [Google Scholar]
- 3.Enewold L, Zhu K, Ron E, Marrogi AJ, Stojadinovic A, Peoples GE, Devesa SS. Rising thyroid cancer incidence in the united states by demographic and tumor characteristics, 1980–2005. Cancer Epidemiol Biomarkers Prev. 2009;18:784–91. doi: 10.1158/1055-9965.EPI-08-0960. [DOI] [PMC free article] [PubMed] [Google Scholar]
- 4.Yu GP, Li JC, Branovan D, McCormick S, Schwartz SP. Thyroid cancer incidence and survival in the national cancer institute surveillance, epidemiology, and end results race/ethnicity groups. Thyroid. 2010;20:465–73. doi: 10.1089/thy.2008.0281. [DOI] [PubMed] [Google Scholar]
- 5.American Cancer Society, Inc. [Accessed 8 July 2012];Learn About Cancer-Thyroid Cancer. Available at: www.cancer.org/Cancer/ThyroidCancer/DetailedGuide/thyroid-cancer-key-statistics.
- 6.Manole D, Schildknecht B, Gosnell B, Adams E, Derwahl M. Estrogen promotes growth of human thyroid tumor cells by different molecule mechanisms. J Clin Endocrinol Metab. 2001;86:1072–77. doi: 10.1210/jcem.86.3.7283. [DOI] [PubMed] [Google Scholar]
- 7.Vivacqua A, Bonofiglio D, Albanito L, Madeo A, Rago V, Carpino A, Musti AM, Picard D, Andò S, Maggiolini M. 17β-estradiol, genistein, and 4-hydroxytamoxifen induce the proliferation of thyroid cancer cells through the g protein-coupled receptor GPR30. Mol Pharmacol. 2006;70:1414–23. doi: 10.1124/mol.106.026344. [DOI] [PubMed] [Google Scholar]
- 8.Vannucchi G, Perrino M, Rossi S, Colombo C, Vicentini L, Dazzi D, Beck-Peccoz P, Fugazzola L. Clinical and molecular features of differentiated thyroid cancer diagnosed during pregnancy. Eur J Endocrin. 2010;162:145–51. doi: 10.1530/EJE-09-0761. [DOI] [PubMed] [Google Scholar]
- 9.Cheng S, Serra S, Mercado M, Ezzat S, Asa SL. A high throughput-proteomic approach provides distinct signatures for thyroid cancer behavior. Clin Cancer Res. 2011;17:2385–94. doi: 10.1158/1078-0432.CCR-10-2837. [DOI] [PubMed] [Google Scholar]
- 10.Vassilopoulou-Sellin R, Palmer L, Taylor S, Cooksley CS. Incidence of breast carcinoma in women with thyroid carcinoma. Cancer. 1999;85:696–705. doi: 10.1002/(sici)1097-0142(19990201)85:3<696::aid-cncr20>3.0.co;2-4. [DOI] [PubMed] [Google Scholar]
- 11.Chen AY, Levy L, Goepfert H, Brown BW, Spitz MR, Vassilopoulou-Sellin R. The development of breast carcinoma in women with thyroid carcinoma. Cancer. 2001;92:225–31. doi: 10.1002/1097-0142(20010715)92:2<225::aid-cncr1313>3.0.co;2-b. [DOI] [PubMed] [Google Scholar]
- 12.Garner CN, Ganetzky R, Brainard J, Hammel JP, Berber E, Siperstein AE, Milas M. Increased prevalence of breast cancer among patients with thyroid and parathyroid disease. Surgery. 2007;142:806–13. doi: 10.1016/j.surg.2007.07.024. [DOI] [PubMed] [Google Scholar]
- 13.Verkooijen RB, Smit JW, Romijn JA, Stokkel MP. The incidence of second primary tumors in thyroid cancer patients is increased, but not related to treatment of thyroid cancer. Eur J Endocrinol. 2006;155:801–6. doi: 10.1530/eje.1.02300. [DOI] [PubMed] [Google Scholar]
- 14.Van Fossen VL, Wilhelm SM, Eaton JL, McHenry CR. Association of thyroid, breast and renal cell cancer: A population-based study of the prevalence of second malignancies. Ann Surg Oncol. 2012 doi: 10.1245/s10434-012-2718-3. Epub ahead of print. [DOI] [PubMed] [Google Scholar]
- 15.Gaikwad NW, Yang L, Muti P, Meza JL, Pruthi S, Ingle JN, Rogan EG, Cavalieri EL. The molecular etiology of breast cancer: Evidence from biomarkers of risk. Int J Cancer. 2008;122:1949–57. doi: 10.1002/ijc.23329. [DOI] [PMC free article] [PubMed] [Google Scholar]
- 16.Gaikwad NW, Yang L, Pruthi S, Ingle JN, Sandhu N, Rogan E, Cavalieri E. Urine biomarkers of risk in the molecular etiology of breast cancer. Breast Cancer: Basic & Clin Res. 2009;3:1–8. doi: 10.4137/bcbcr.s2112. [DOI] [PMC free article] [PubMed] [Google Scholar]
- 17.Pruthi S, Yang L, Sandhu NP, Ingle JN, Beseler CL, Suman VJ, Cavalieri EL, Rogan EG. Evaluation of serum estrogen-DNA adducts as potential biomarkers of breast cancer risk. J Steroid Biochem Mol Biol. 2012;132:73–9. doi: 10.1016/j.jsbmb.2012.02.002. [DOI] [PMC free article] [PubMed] [Google Scholar]
- 18.Markushin Y, Gaikwad N, Zhang H, Rogan E, Cavalieri E, Trock B, Pavlovich C, Jankowiak R. Potential biomarker for early risk assessment of prostate cancer. Prostate. 2006;66:1565–71. doi: 10.1002/pros.20484. [DOI] [PubMed] [Google Scholar]
- 19.Yang L, Gaikwad N, Meza J, Cavalieri E, Muti P, Trock B, Rogan E. Novel biomarkers for risk of prostate cancer. Results from a case-control study. Prostate. 2009;69:41–8. doi: 10.1002/pros.20850. [DOI] [PMC free article] [PubMed] [Google Scholar]
- 20.Gaikwad NW, Yang L, Weisenburger DD, Vose J, Beseler C, Rogan EG, Cavalieri EL. Urinary biomarkers suggest that estrogen-DNA adducts may play a role in the aetiology of non-Hodgkin lymphoma. Biomarkers. 2009;14:502–12. doi: 10.3109/13547500903121715. [DOI] [PMC free article] [PubMed] [Google Scholar]
- 21.Saeed M, Rogan E, Cavalieri E. Synthesis of the catechols of natural and synthetic estrogens by using 2-iodoxybenzoic acid (IBX) as the oxidizing agent. Steroids. 2005;70:173–8. doi: 10.1016/j.steroids.2004.11.005. [DOI] [PubMed] [Google Scholar]
- 22.Cao K, Stack DE, Ramanathan R, Gross ML, Rogan EG, Cavalieri EL. Synthesis and structure elucidation of estrogen quinones conjugated with cysteine, N-acetylcysteine and glutathione. Chem Res Toxicol. 1998;11:909–16. doi: 10.1021/tx9702291. [DOI] [PubMed] [Google Scholar]
- 23.Stack D, Byun J, Gross ML, Rogan EG, Cavalieri E. Molecular characteristics of catechol estrogen quinones in reactions with deoxyribonucleosides. Chem Res Toxicol. 1996;9:851–9. doi: 10.1021/tx960002q. [DOI] [PubMed] [Google Scholar]
- 24.Li K-M, Todorovic R, Devanesan P, Higginbotham S, Köfeler H, Ramanathan R, Gross ML, Rogan EG, Cavalieri EL. Metabolism and DNA binding studies of 4-hydroxyestradiol and estradiol-3,4-quinone in vitro and in female ACI rat mammary gland in vivo. Carcinogenesis. 2004;25:289–97. doi: 10.1093/carcin/bgg191. [DOI] [PubMed] [Google Scholar]
- 25.Zahid M, Kohli E, Saeed M, Rogan E, Cavalieri E. The greater reactivity of estradiol-3,4-quinone versus estradiol-2,3-quinone with DNA in the formation of depurinating adducts. Implications for tumor-initiating activity. Chem Res Toxicol. 2006;19:164–72. doi: 10.1021/tx050229y. [DOI] [PubMed] [Google Scholar]
- 26.Lasley BL, Chen J, Stanczyk FZ, Khoudary ELSR, Gee NA, Crawford S, McConnell SD. Androstenediol complements estrogenic bioactivity during the menopausal transition. Menopause. 2012;19:650–7. doi: 10.1097/gme.0b013e31823df577. [DOI] [PMC free article] [PubMed] [Google Scholar]
- 27.McConnell SD, Stanczyk FZ, Sowers MR, Randolph JF, Lasley BL. Menopausal transition stage-specific changes in circulating adrenal androgens. Menopause. 2012;19:658–63. doi: 10.1097/gme.0b013e31823fe274. [DOI] [PMC free article] [PubMed] [Google Scholar]
- 28.Cavalieri E, Rogan E. Unbalanced metabolism of endogenous estrogens in the etiology and prevention of human cancer. J Steroid Biochem Mol Biol. 2011;125:169–80. doi: 10.1016/j.jsbmb.2011.03.008. [DOI] [PMC free article] [PubMed] [Google Scholar]
- 29.Chakravarti D, Mailander P, Li K-M, Higginbotham S, Zhang H, Gross ML, Cavalieri E, Rogan E. Evidence that a burst of DNA depurination in SENCAR mouse skin induces error-prone repair and form mutations in the H-ras gene. Oncogene. 2001;20:7945–53. doi: 10.1038/sj.onc.1204969. [DOI] [PubMed] [Google Scholar]
- 30.Mailander PC, Meza JL, Higginbotham S, Chakravarti D. Induction of A.T to G. C mutations by erroneous repair of depurinated DNA following estrogen treatment of the mammary gland of ACI rats. J Steroid Biochem Mol Biol. 2006;101:204–15. doi: 10.1016/j.jsbmb.2006.06.019. [DOI] [PubMed] [Google Scholar]
- 31.Liehr JG, Fang WF, Sirbasku DA, Ari-Ulubelen A. Carcinogenicity of catechol estrogens in Syrian hamsters. J Steroid Biochem. 1986;24:353–6. doi: 10.1016/0022-4731(86)90080-4. [DOI] [PubMed] [Google Scholar]
- 32.Li JJ, Li SA. Estrogen carcinogenesis in Syrian hamster tissues: Role of metabolism. Fed Proc. 1987;46:1858–63. [PubMed] [Google Scholar]
- 33.Newbold RR, Liehr JG. Induction of uterine adenocarcinoma in CD-1 mice by catechol estrogens. Cancer Res. 2000;60:235–7. [PubMed] [Google Scholar]
- 34.Dwivedy I, Devanesan P, Cremonesi P, Rogan E, Cavalieri E. Synthesis and characterization of estrogen 2,3- and 3,4-quinones. Comparison of DNA adducts formed by the quinones versus horseradish peroxidase-activated catechol estrogens. Chem Res Toxicol. 1992;5:828–33. doi: 10.1021/tx00030a016. [DOI] [PubMed] [Google Scholar]
Associated Data
This section collects any data citations, data availability statements, or supplementary materials included in this article.