Abstract
Pharmacokinetic modeling and simulation is a powerful tool for the prediction of drug concentrations in the absence of analytical techniques that allow for direct quantification. The present study applied this modeling approach to determine active drug release from a nanoparticle prodrug formulation. A comparative pharmacokinetic study of a nanoscale micellar docetaxel (DTX) prodrug, Procet 8, and commercial DTX formulation, Taxotere, was conducted in bile duct cannulated rats. The nanoscale (~40 nm) size of the Procet 8 formulation resulted in confinement within the plasma space and high prodrug plasma concentrations. Ex vivo prodrug hydrolysis during plasma sample preparation resulted in unacceptable error that precluded direct measurement of DTX concentrations. Pharmacokinetic modeling of Taxotere and Procet 8 plasma concentrations, and their associated biliary metabolites, allowed for prediction of the DTX concentration profile and DTX bioavailability, and thereby evaluation of Procet 8 metabolism.
Procet 8 plasma decay and in vitro plasma hydrolytic rates were identical, suggesting systemic clearance of the prodrug was primarily metabolic. The Procet 8 and Taxotere plasma profiles, and associated docetaxel hydroxy-tert-butyl carbamate (HDTX) metabolite biliary excretion, were best fit by a two compartment model, with both linear and non-linear DTX clearance, and first order Procet 8 hydrolysis. The model estimated HDTX clearance rate agreed with in vitro literature values, supporting the predictability of the proposed model. Model simulation at the 10 mg DTX equivalent/kg dose level predicted DTX formation rate-limited kinetics and a peak plasma DTX concentration of 39 ng/mL at 4h for Procet 8, in comparison to 2826 ng/mL for Taxotere. As a result of nonlinear DTX clearance, the DTX AUCinf for the Procet 8 formulation was predicted to be 2.6 times lower than Taxotere (775 vs. 2017 h x ng/mL, respectively), resulting in an absolute bioavailability estimate of 38%. As DTX clearance in man is considered linear, this low bioavailability is likely species-dependent. These data support the use of pharmacokinetic modeling and simulation in cases of complex formulations, where analytical methods for direct measurement of free (released) drug concentrations are unavailable. Uses of such models may include interpretation of preclinical toxicology studies, selection of first in man dosing regimens, and PK/PD model development.
Keywords: biliary clearance, pharmacokinetic modeling and simulation, nanomicellar prodrug
1. Introduction
Liposomes have been utilized for over 30 years to enhance the plasma circulation lifetimes and increase target accumulaton of many hydrophilic agents but have provided only modest improvements for hydrophobic drugs such as the taxanes and non-amphipathic camptothecins. Attempts to increase the circulation lifetime of these hydrophobic drugs have included the use of water-soluble polymers such as polyethylene glycol (PEG) [1–3], polypeptides [4–6] and polylactides [7]. Recently, docetaxel was formulated in a targeted nanoparticle formulation composed of PLA-PEG[8]. Although this formulation dramatically increased plasma docetaxel Cmax and AUC values relative to the equivalent dose of free drug, approximately 99% of the injected dose was cleared from the plasma 24 hours after injection to rats.
As an alternative to enhancing plasma levels of docetaxel through formulation of the parent drug, we report here on a prodrug delivery platform that is focused on decreasing non-specific systemic drug exposure and enhancing tumor accumulation leading to decreased toxicity and improved efficacy [9]. This approach enhances the hydrophobicity of docetaxel through conjugation to highly non-polar fatty alcohols or cholesterol, producing prodrugs composed of the parent drug coupled to the non-polar anchor via a hydrolysable linker. Rapid mixing of the hydrophobic prodrugs with appropriate amounts of hydrophobic-hydrophilic block copolymers and a stabilizing phospholipid leads to the spontaneous formation of nano-scale (20–100 nm) solid core nanoparticles [10, 11]. Particles generated using this technique have been previously shown to accumulate and remain in tumor tissue for extended periods of time due to the enhanced permeability and retention effect (EPR) associated with the use of small particulate delivery vehicles [12]. Thus, the plasma circulation lifetime and tumor bioavailability of docetaxel is dictated by three factors: 1) the distribution properties of the polymer nanoparticle; 2) the hydrolysis kinetics of the ester bond between docetaxel and the linker and 3) the hydrophobicity of the anchor.
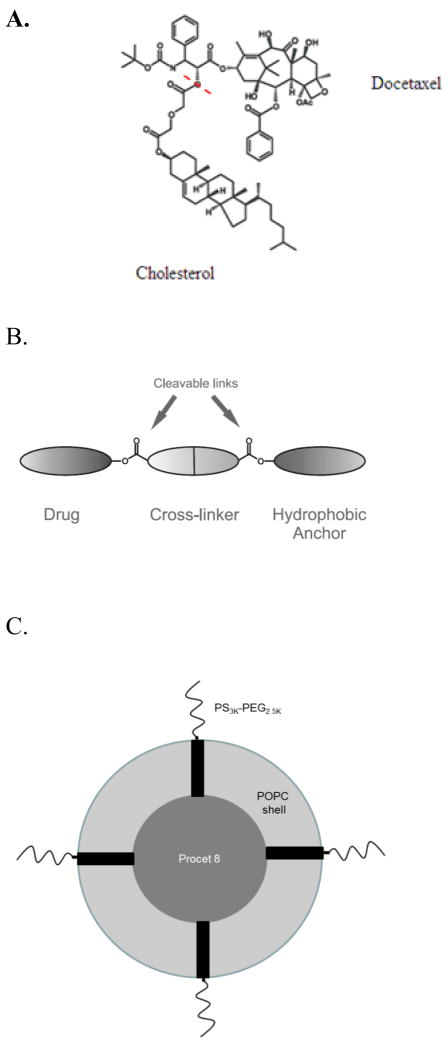
As we have previously shown with paclitaxel, the choice of lipid anchor and linker chemistry are the critical factors that determine the plasma elimination rate, rather than the physicochemical properties of the parent drugs themselves [12]. Here we provide analysis of the hydrolysis rate of docetaxel linked to cholesterol through a diglycolate linkage (Procet 8, figure 1) and formulated into phospholipid/copolymer nanoparticles. Although it is desirable to directly measure prodrug hydrolysis rates in vivo, it is difficult to quantify this conversion rate as the prodrug undergoes substantial ex vivo hydrolysis, and docetaxel has a very high volume of distribution and clearance. Consequently we utilized pharmacokinetic modeling as a tool for defining the in vivo hydrolysis rates of procet 8 in order to better understand the mechanism(s) whereby this formulation provides markedly enhanced efficacy compared to the parent drug.
Figure 1. 3′-docetaxel diglycolate cholesterol (Procet 8).
A.) The Procet 8 molecule is displayed, with the cholesterol and DTX portions of the prodrug labeled. The red dotted line shows the site of hydrolytic cleavage to regenerate active docetaxel. B.) A schematic of the Procet 8 molecule, with the hydrophobic anchor, diglycolate linker, and drug portion. C.) A schematic representing the conceptualized micellar Procet 8 nanoparticle is displayed. The inner hydrophobic Procet 8 drug core is surrounded by an outer layer of POPC and PS3KPEG2.5K.
Pharmacokinetic modeling and simulation is a powerful tool that has been used previously for prediction of drug concentrations in the absence of analytical techniques that allow for direct quantification[13, 14]. A modeling approach was undertaken to predict the DTX plasma profile by fitting plasma profiles of the prodrug and a commercial DTX formulation, Taxotere, to their respective cumulative biliary metabolite data, and thereby describe prodrug metabolism and DTX bioavailability. The modeling of excretion data to predict underlying plasma profiles has been performed successfully before [14]. However, this is the first example that we are aware of in which biliary excretion data has been used for the prediction of drug concentrations for a nanoscale prodrug formulation.
DTX in man and rodents is cleared by CYP3A mediated oxidation followed by biliary excretion, with renal clearance having a minor contribution (<10%) [15–17]. The metabolite docetaxel hydroxy-tert-butyl carbamate (hydroxydocetaxel, HDTX) was chosen for the purpose of modeling plasma concentrations, since analytical standards are available and it is the primary hepatic metabolite in rats and humans [16, 17]. Bile duct cannulated Sprague Dawley rats treated with molar equivalent doses of the taxane in the form of Taxotere or Procet 8, had plasma, bile and urine samples analyzed for HDTX, DTX and Procet 8 concentrations by validated LC-MS and –UV methods. The resulting concentration profiles were fit to a two compartment DTX model, with both linear and non-linear DTX clearance, and linear hydrolysis of the Procet 8 prodrug. This model was then used to simulate the DTX plasma profile, in order to gain insight into the prodrugs pharmacokinetic behavior.
2. Materials and Methods
2.1 Material
Docetaxel (DTX) was purchased from LC Laboratories. Taxotere (Sanofi-Aventis) was obtained from the NIH pharmacy. DTX hydroxy-tert-butyl carbamate (HDTX) was purchased from Santa Cruz Biotechnology (Dallas, TX). Docetaxel-d9 (DTX-d9) was purchased from Medical Isotopes, Inc.. (Pelham, NH). BD Vacutainer PST gel Li-heparin tubes were purchased from Moore Medical (New Britain, CT). Acetonitrile was purchased from VWR (Radnor, PA). Formic acid was purchased from Thermo Scientific (Barington, IL). Alpha-tocopherol was purchased from Sigma-Aldrich (St. Louis, MO). ZORBAX-SB-C18, 5μ particle, 2.1 × 100mm and 4.6 × 150mm column was purchased from Agilent Technologies, Inc. (Santa Rosa, CA), Sunfire C18 5 μM particle, 2.1 × 10mm and 4.6 × 10mm guard column was purchased from Waters, Inc. (Milford, MA). Cholesteryl diglycolate was synthesized as previously described (Ansell 2008). 1-Palmitoyl-2-oleoyl-sn-glycero-3-phosphocholine (POPC) was purchased from Lipoid (Newark, New Jersey). Polystyrene (3000 mwt)-b-polyethylene oxide(2500 mwt) (PS-PEG) was purchased from Polymer Source (Montreal, Quebec). All other reagents were of purchased from Sigma-Aldrich Canada Ltd. (Oakville, Ontario) and used as received. All other solvents were purchased from VWR International (Mississauga, Ontario).
2.2 Synthesis of 3 ′-docetaxel diglycolate cholesterol (Procet 8, Fig. 1)
A solution of docetaxel (6.12 g), N-(3-dimethylaminopropyl)-N-ethylcarbodiimide hydrochloride (1.53 g), 4-N, N-dimethylaminopyridine (1.50 g) and cholesteryl diglycolate (4.46 g) in dichloromethane (80 mL) was stirred at room temperature for 90 minutes. The reaction was monitored by TLC. The reaction mixture was washed with dilute hydrochloric acid, dried over anhydrous magnesium sulfate, filtered and the solvent removed. The residue was passed down a silica gel column (200 g) using a 0–4% methanol/dichloromethane gradient to remove most impurities. Fractions containing the product were combined and passed down a second silica gel column (80 g) using a 1–2% methanol/dichloromethane gradient. The final product was dried under vacuum yielding the product as a colorless glass (5.53 g). 1H NMR (400 MHz, CDCl3). NMR spectra were obtained in CDCl3 using a Bruker Avance 400. 2′-O-(5″-O-cholesteryldiglycoloyl)-docetaxel. 1H NMR (400MHz, CDCl3) δ3.96 (1H, d, J = 7.3 Hz); 4.10 (1H, d, J=16 Hz); 4.15 (1H, d, J = 16 Hz, J’ = 6.8 Hz); 4.19 – 4.39 (6H, m); 4.73 (1H, m); 4.99 (1H, dd, J = 9.5 Hz, J’ =1.7 Hz); 5.24 (1H, d, J = 1.7 Hz); 5.41 (1H, d, J =4.6 Hz); 5.43–5.57 (3H, m); 5.72 (1H, d, J = 7.0 Hz); 6.21 (1H, t, J = 8.7 Hz); 7.28 – 7.37 (3H, m); 7.42 (2H, m); 7.52 (2H, m); 7.63 (1H; m); 8.14 (2H; m).
2.2 Nanoscale micelle formulation and characterization
Procet 8, POPC and PS-PEG were mixed together at a weight ratio of 1:2:4 respectively and dissolved in ethanol/THF (4:1) at a concentration of 40 mg/ml. The solvent was rapidly mixed with a 12.5-fold excess of water using a two port impinging jet mixer with the water flow rate set 120 ml/min. Flow rates were controlled using Harvard Apparatus PHD2000 syringe pumps. The resultant solution was then dialyzed overnight against water to remove residual solvent. The following day the water was exchanged for 300 mM sucrose using cross flow filtration and concentrated to a Procet 8 final concentration of 1–5 mg. Particle size was determined by DLS using a Malvern Zetasizer Nano-ZS particle sizer and reported as intensity weighted (z-average) size. The prodrug concentration was determined to be 4.0 mg prodrug/mL. The DLS size and zeta potential determined in 10 mM NaCl, were 39.9 ± 0.3 nm and −2.7 ± 0.3z, respectively.
2.3 Husbandry
Animal rooms were kept at 50% relative humidity, 68–72°F with 12 h light/dark cycles. Rats were housed with two animals/cage (Rat polycarbonate cage type), with ¼″ corncob bedding. Animals were allowed ad libitum access to Purina 18% NIH Block and chlorinated tap water. NCI-Frederick is accredited by AAALAC International and follows the Public Health Service Policy for the Care and Use of Laboratory Animals. Animal care was provided in accordance with the procedures outlined in the Guide for Care and Use of Laboratory Animals (National Research Council, 1996; National Academy Press, Washington, D.C.).
2.3 Pharmacokinetics studies
2.31 Bile duct cannulation studies
Bile duct cannulated, single jugular catheterized 10-week-old female Sprague Dawley rats (approx. weight of 220 grams) were purchased from Charles River Laboratories (Raleigh, N.C.). Rats, 5 animals per group, were treated intravenously by tail vein with 10 mg DTX equivalents/5 mL/kg of either the Procet 8 or Taxotere formulations, and held in metabolism cages. Two animals were also included as controls, and left untreated. Blood samples (200uL) were collected in lithium-heparin coated tubes by jugular catheter at 15, 30, 60, 120, 240, 360, 480 and 1440 min. The blood samples were centrifuged (VWR Galaxy Mini microcentrifuge, 2000 g, 5 min, 4°C), and plasma was collected and stored at −80°C. Bile samples (1 h interval) were collected over the 8 h post injection period, and 24 h urine samples were also collected. Bile volumes were replaced with s.c. saline injection. At study termination, 24 h after dosing, liver was collected and frozen. Plasma, bile, urine and liver samples were analyzed for Procet 8, DTX and HDTX concentration by validated LC-MS and LC-UV methods. The LC-MS method was used for analysis of HDTX and DTX in plasma, while the LC-UV method was used for analysis Procet 8 in plasma and liver, and HDTX and DTX in bile and urine.
2.32 Procet 8 Liver distribution study
A separate study was also conducted to assess Procet 8 uptake in the liver at 1 h post dose by LC-UV analysis. The animal model for this liver uptake study was 10-week-old female Sprague Dawley rats (approx. weight of 220 grams) purchased from Charles River Laboratories (Raleigh, N.C.). Rats, 2 animals per group, were treated with 10 mg DTX equivalents/kg of Procet 8, at dose volume of 5 mL/kg. Two animals were also included as controls, and left untreated. At one hour post treatment, liver was removed and frozen for determination of Procet 8 concentration by LC-UV.
2.4 Analytical Methods
2.41 LC-MS Analysis of DTX and HDTX in Plasma
For plasma analysis of DTX and HDTX by LC-MS, the unknown samples or analyte standards were spiked with DTX-d9 internal standard at a concentration of 125 ng/mL, and diluted 1:5 using ice cold acetonitrile (ACN) with 0.1% formic acid. The thawed sample was then centrifuged (VWR Galaxy Mini microcentrifuge, 2000 g, 20 min, 4 C). The supernatant was transferred to a glass tube and dried under nitrogen gas at 48°C. The dried residue was resuspended in 150uL 30%ACN in water with 0.1% formic acid. The extracted sample was again centrifuged and the supernatant transferred to amber glass HPLC vials for analysis. The calibration standards, 50, 75, 125, 250, 500, 750 and 1000 ng/mL of DTX and HDTX, were prepared fresh for each analysis. Quality control standards, 75, 150 and 750 ng/mL of DTX and HDTX, were prepared in advance, and run in triplicate with each analysis, dispersed randomly among the unknown samples. A plasma blank and I.S. spiked plasma blank were also run with the calibration curve.
The LC system consisted of a LC/MS 2020 single quad, LC-20AT pump, and SPD-20AC auto injector (Shimadzu Scientific Instruments, Inc.). The column was a ZORBAX-SB-C18, 5μ particle, 2.1×100mm with a Sunfire C18 5 μ particle, 2.1 × 10mm guard column. The HPLC conditions were, 5μl injection volume, water-acetonitrile gradient: (30% ACN/0.1% formic acid from 0–1.5min, linear increase to 80% ACN/0.1% formic acid from 1.5–4.5min, hold at 80% ACN/0.1% formic acid from 4.5–8.5 min, and linear decrease to 30% ACN/0.1% formic acid from 8.5–10.5 min, column regeneration time between injections was 6.5 min), flow rate of 0.35mL/min, column temperature of 32°C. The MS instrument used an electrospray ionization source in positive ion mode, detector voltage was 0.2kv and a desolvation line and heat block temperature of 200°C. High pressure liquid nitrogen was used as the drying gas at a rate of 1.5L/min.
HDTX, DTX, and DTX-d9 m/z ions monitored by SIM were 824, 808, and 817, respectively, and retention times were 7.9, 8.9, and 8.9 min, respectively (Supplementary Fig. 1). Matrix interference was not observed for the analytes or internal standard. Non-weighted linear regression of the calibration curve resulted in R2 values >0.99, and accuracy deviations (relative error) of the regression-calculated value from the true value were <15% for all calibration levels. At all QC levels, the accuracy deviation (relative error) did not exceed 15% from the true value, and precision (%CV) did not exceed 15%, at all levels. The calculated absolute recovery for plasma extraction was >70% for all analytes, at all QC levels. The lower limit of quantification (LLOQ) was established at 50 ng/mL for both analytes.
2.42 LC-UV Analysis of DTX and HDTX in Bile and Urine
Bile and urine samples were spiked with paclitaxel internal standard at a concentration of 30 μg/mL, and diluted 1:5 in water. The diluted bile and urine samples were further diluted 1:5 with ice-cold acetonitrile, frozen at −80°C for 10 min, thawed and centrifuged (VWR Galaxy Mini microcentrifuge, 2000 g, 20 min, 4 C). The supernatant was transferred to glass tubes, dried down under nitrogen gas at 48°C, reconstituted in 250 μL of 50% acetonitrile/water, centrifuged and the supernatant transferred to an amber HPLC vials for analysis. The standard curve and quality controls were spiked into the appropriate bile or urine matrix, and prepared as described for the unknown samples. The urine calibration standards, 1.5, 3, 6, 12.5, 25, 50 and 100 μg/mL for DTX, and 6, 12.5, 25, 50 and 100 μg/mL for HDTX, were prepared fresh for each analysis. The bile calibration standards, 1.5, 3, 6, 12.5, 25, and 50 μg/mL for DTX and HDTX, were prepared fresh for each analysis. The quality controls for urine anlysis, 6, 25, and 100μg/mL of DTX and HDTX, and bile analysis, 1.5, 12.5, and 50 μg/mL of DTX and HDTX,were prepared in advance and run in triplicate, dispersed randomly among the unknown samples. A matrix blank and I.S. spiked matrix blank were also run with the calibration curve.
The LC system consisted of a LC-20AT pump, SPD-20AC auto injector, and SPD-20A UV/Vis detector (Shimadzu Scientific Instruments, Inc.). The analysis conditions were a flow rate of 1mL/min, 50 μL injection volume, Zorbax SB-C18 5μ 4.6×150mm column with a Sunfire C18 5 μ particle, 4.6 × 10mm guard column, UV detection at λ 227nm. The acetonitrile/water gradient utilized was: 25% acetonitrile 0–5 min, 80% acetonitrile 5–15 min, 25% acetonitrile 15–17, and 8 min column regeneration time. The analyte retention times were: HDTX – 12.8min, DTX – 14.8min, and PTX IS 15.1min. Non-weighted linear regression of the calibration curve resulted in R2 values >0.99, and accuracy deviations (relative error) of the regression-calculated value from the true value were <15% for all calibration levels. At all QC levels, the accuracy deviation (relative error) of quality control samples did not exceed 15% from the true value, and precision (%CV) did not exceed 15%,. The calculated absolute recovery for bile and urine extraction was >70% for all analytes, at all QC levels. The lower limit of quantification (LLOQ) was established at 1.5 μg/mL for both analytes.
2.43 LC-UV analysis of Procet 8 in plasma
Plasma samples were spiked with alpha-tocopherol internal standard at a concentration of 12.5 μg/mL, and diluted 1:5 with ice-cold acetonitrile. Sample preparations were protected from light, since light degrades alpha-tocopherol. The samples were frozen at −80°C for 10 min, thawed and centrifuged (VWR Galaxy Mini microcentrifuge, 2000 g, 20 min, 4 C), and the resulting supernatant placed in amber HPLC vials for analysis. The standard curve and quality controls were also made up in plasma matrix, and prepared as described for the unknown samples. The calibration standards, 8, 16, 31, 63, 125, 250 and 500 μg Procet 8/mL, were prepared fresh for each analysis. The quality controls, 8, 31, and 250 μg Procet 8/mL, were prepared in advance and run in triplicate, dispersed randomly among the unknown samples. A matrix blank and I.S. spiked matrix blank were also run with the calibration curve.
The LC system consisted of a LC-20AT pump, SPD-20AC auto injector and SPD-20A UV/Vis detector (Shimadzu Scientific Instruments, Inc.). The analysis conditions were flow rate of 1mL/min, isocratic 100% acetonitrile mobile phase, 50uL injection volume, with 4.6 × 150mm 5μ Zorbax SB-C18 column with a Sunfire C18 5 μ particle, 4.6 × 10mm guard column, and UV detection at λ 227nm. The analyte retention times were: alpha-tocopherol IS- 16.7 min and Procet 8 −20.6 min. Non-weighted linear regression of the calibration curve resulted in R2 values >0.99, and accuracy deviations (relative error) of the regression-calculated value from the true value <15% for all calibration levels. At all QC levels, the accuracy deviation (relative error) of quality control samples did not exceed 15% from the true value, and precision (%CV) did not exceed 15%,. The calculated absolute Procet 8 and internal standard recovery for plasma extraction was >70%, at all QC levels. The lower limit of quantification (LLOQ) was established at 8 μg/mL.
2.44 LC-UV analysis of Procet 8 in liver
Frozen livers from Procet 8 treated animals, 1h and 24h post dose samples, and control untreated animals, were thawed on ice. The control rat liver samples were used for preparation of a standard curve and for analysis blank. Thawed tissues were weighed and the weight was recorded. A piece of liver tissue (~1 gram) was removed from each sample, minced with scissors, and diluted in 9 volumes of acetonitrile. The tissue sample was then homogenized over ice for 5 min on high (Kinematica Polytron). The resulting homogenate was placed on ice, and an aliquot spiked with alpha-tocopherol internal standard at a concentration of 60 μg/mL, and diluted 1:5 with ice-cold acetonitrile. Sample preparations should be protected from light, since light degrades alpha-tocopherol. The samples were then shaken in a refrigerated cold room (4 C) for 10 min on an orbital shaker, centrifuged (VWR Galaxy Mini microcentrifuge, 2000 g, 20 min, 4°C), and the supernatant collected. The pellet was then re-extracted with an additional 1.5 mL volume of ice cold ACN vortexed, shaken and centrifuged. The two supernatants were pooled, evaporated at 48°C with nitrogen, reconstituted in 200 μL of acetonitrile and analyzed according to the Procet 8 plasma method above.
The standard curve and quality controls were prepared by spiking 0.5 mL of blank liver homogenate matrix, and processed as described for the unknown samples. The calibration standards, 1.5, 3, 6, 12.5, 25, 50 μg/mL of Procet 8, were prepared fresh for each analysis. The quality controls, 1.5, 6, and 25 μg of Procet 8, were prepared in advance and run in triplicate, dispersed randomly among the unknown samples. A matrix blank and I.S. spiked matrix blank were also run with the calibration curve. The resulting standards and controls were analyzed according the Procet 8 LC-UV plasma method above. Non-weighted linear regression of the calibration curve resulted in R2 values >0.99, and accuracy deviations (relative error) of the regression-calculated value from the true value <15% for all calibration levels. The accuracy deviation (relative error) of quality control samples did not exceed 15% from the true value, and precision (%CV) did not exceed 15%, at all levels. The calculated absolute Procet 8 and internal standard recovery for tissue extraction was >70%, at all QC levels. The lower limit of quantification (LLOQ) was established at 1.5 μg/mL for both analytes.
2.5 Procet 8 hydrolysis in rat plasma
Procet 8 samples were incubated in plasma, with or without polymethylsulfonylflouride (PMSF) esterase inhibitor to determine sensitivity of hydrolysis to this inhibitor. Incubates prepared in 3% BSA were also included, in order to estimate non-enzymatic hydrolysis. Two sets of plasma incubates were prepared, with or without PMSF esterase inhibitor, in duplicate, of 1 mL each. A duplicate incubation was also prepared in 3% (w/v) BSA:water, prepared in water instead of plasma. Incubates were set in a shaker incubator @ 37 C, and equilibrated for 15 min. To the PMSF incubates, 33 μL of 30 mM PMSF inhibitor (freshly prepared in ethanol) was added, the samples were then vortexed and return to the incubator. To all incubates, 66 μL of 4 mg Procet 8/mL stock was added, the samples were then vortexed and returned to incubator. Time points for incubate collection were 0, 0.5, 1, 2, 4, 6, 12, 24, 48h. Time zero was collected immediately after Procet 8 addition. For each time point, the incubate was vortexed, and a 50 μL aliquot collected and mixed with 200 μL ice cold ACN. The sample was then vortexed and placed on ice, and analyzed by the plasma Procet 8 LC-UV method. Resulting hydrolysis curves were fit to a first order rate equation, % Remaining = 100%*e (−K*t), by uniform weighted regression analysis using Phoenix Winnonlin Version 6.3 software (Pharsight Corp., Mountain View, CA). The zero time concentration point was set at 100% for calculaton of percentage remaining.
2.6 Noncompartmental Pharmacokinetic Analysis
Noncompartmental pharmacokinetic parameters were determined by the following methods, using Phoenix Winnonlin Version 6.3 software (Pharsight Corp., Mountain View, CA): the area under the time concentration curve (AUCinf) was calculated using the linear trapezoidal rule with extrapolation to time infinity; clearance (CL) was calculated from dose/AUC; apparent volume of distribution (V) was calculated from dose/C0 (concentration at time zero calculated from extrapolation of the plasma time curve); terminal half-life (t1/2) was calculated from 0.693/slope of the terminal elimination phase. The tmax term is the time of maximum concentration.
2.6 Compartmental Pharmacokinetic Modeling
Compartmental modeling was performed using Phoenix Winnonlin Version 6.3 software (Pharsight Corp., Mountain View, CA). For details of the compartmental models and methods employed refer to the text.
3. Results
3.1 Procet 8 and Taxotere Plasma Pharmacokinetics
Procet 8 and DTX were determined in rat plasma by LC-UV and LC-MS methods, respectively, as described in the experimental methods. Procet 8 and DTX were found to be linear over a range of 8–500 μg/mL (Supplementary Fig. 2) and 50–1000 ng/mL (Supplementary Fig. 3), respectively. The HDTX plasma concentrations for both treatment groups were below the limits of quantification (LLOQ=50 ng/mL) and are not presented.
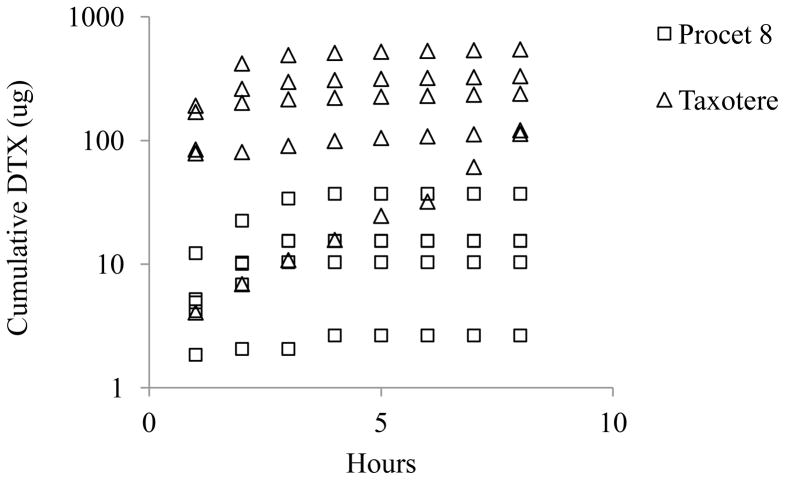
Ex vivo prodrug hydrolysis during plasma sample preparation resulted in unacceptable error that precluded direct measurement of DTX concentrations, as detailed in the discussion (data not presented). The Taxotere plasma concentration vs. time profile exhibited a biphasic decay, with a rapid tissue distribution phase half-life (t1/2) of ~30 min, whereas the Procet 8 plasma profile displayed a slow monophasic decay (Fig. 2). Several of the Taxotere 8h plasma samples and all of the 24h samples were below the LLOQ for the DTX assay. The noncompartmental parameter estimates of the mean plasma concentrations are displayed in Table 1. The estimated Taxotere terminal elimination half-life was 3h and the extrapolated concentration at time zero (C0) was 3 μg/mL. The Taxotere apparent volume of distribution (V) of several liters per kg body weight is consistent with wide tissue distribution. Procet 8 had an estimated terminal elimination half life (t1/2) of 9h, and a low V of 50 mL/kg. This low 50 mL/kg V is consistent with confinement within the plasma volume (~40 mL/kg), which is typical of nano-formulations that are stable and lack mononuclear phagocytic system (MPS) uptake[18].
Figure 2. Procet 8 and DTX plasma profiles.
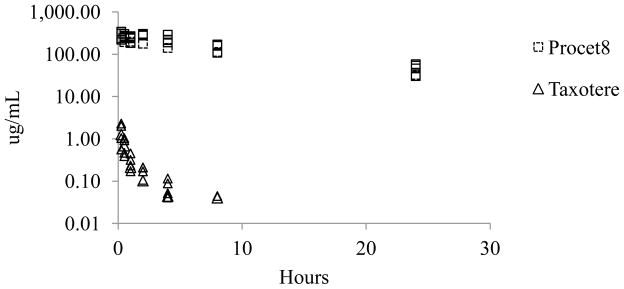
The pooled plasma concentration data are presented for the Procet 8 (squares) and Taxotere (triangles) treatment groups.
Table 1. NCA Pharmacokinetic Parameters.
Pharmacokinetic parameters were estimated by noncomparmental analysis of the mean plasma concentrations for the Procet 8 and Taxotere profiles. See methods for abbreviations and calculations.
| NCA Parameters | |||||||
|---|---|---|---|---|---|---|---|
| lambda 1/h | t1/2 h | C0 μg/mL | Cmax μg/mL | AUCinf μg × h/mL | V mL/kg | CL L/h/kg | |
| Procet 8 | 0.076 | 9 | 318 | 283 | 3765 | 50 | 0.004 |
| Taxotere | 0.210 | 3 | 2.9 | 1.4 | 1.9 | 3401 | 5.2 |
3.2 Biliary and Urinary Excretion of Procet 8, DTX and HDTX
DTX and HDTX concentrations were measured in rat bile by a LC-UV method. DTX and HDTX analytes were found to be linear over concentration ranges of 1.5–50 μg/mL (Supplementary Fig. 4 and 5). Procet 8 concentrations in the bile were below the limit of quantification (LLOQ = 1.5 μg/mL by a LC-UV method) and are not presented. Bile samples from Taxotere and Procet 8 treated animals had similar metabolite profiles (Fig. 3). HDTX was the primary biliary metabolite identified, and the parent DTX and putative cyclic hydroxyoxazolidinone diastereomer metabolites (M1/M3) were excreted in lesser amounts (Fig. 3). The average bile flow and bile flow variability for all animals were similar over the 8h collection period (overall mean ± SD, 12 ± 4 μL/min).
Figure 3. Representative bile chromatograms.
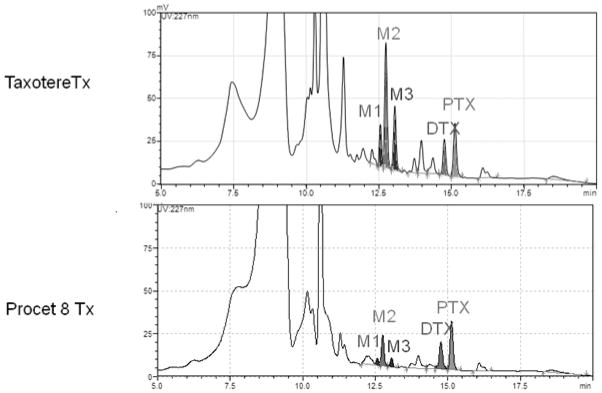
Representative bile chromatograms for the Taxotere and Procet 8 treatment groups are displayed. The docetaxel hydroxy-tert-butyl carbamate (HDTX, M2), docetaxel (DTX), putative cyclic hydroxyoxazolidinone diastereomer metabolites (M1/M3), and paclitaxel (PTX) IS peaks are labeled on the chromatograms. For metabolite structures refer to [16].
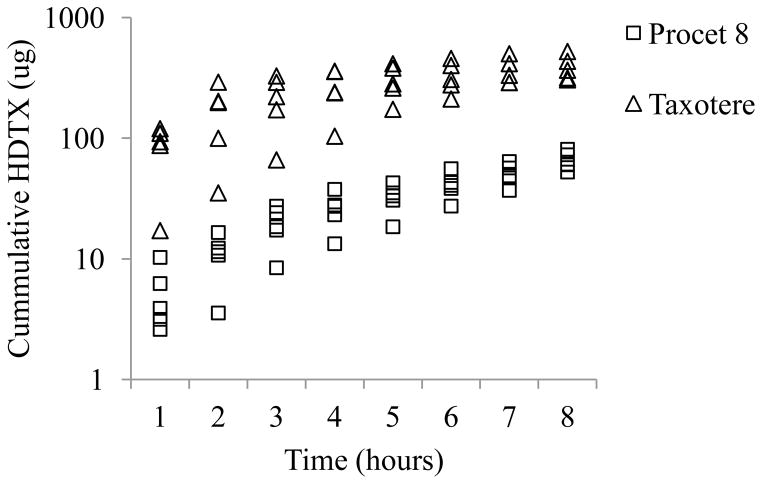
Cumulative biliary DTX and HDTX excretion were approximately 17 and 6 fold greater for the Taxotere treated animals in comparison to Procet 8 treated animals (12.02 ± 8.15 vs. 0.72±0.54 % injected dose for DTX, and 17.15 ± 3.71 vs. 2.93+0.72 % injected dose for HDTX, mean ± SD), respectively (Fig. 4 and 5). However, the percentage of the total 8h biliary metabolites excreted as HDTX, %HDTX=total HDTX/(total HDTX+ total DTX)*100, did not vary significantly between the Taxotere and Procet 8 treatment groups, 82±12% vs. 62±16%, respectively. The similarity of the biliary metabolic profile for both treatment groups, supports scomparable metabolism of the active DTX following prodrug hydrolysis.
DTX and HDTX concentrations were measured in rat urine by a LC-UV method. DTX and HDTX analytes were found to be linear over concentration ranges of 1.5–100 μg/mL (Supplementary Fig. 6) and 6–100 μg/mL (Supplementary Fig. 7), respectively. Procet 8 concentrations in the urine were below the limit of quantification (LLOQ = 1.5 μg/mL by a LC-UV method) and are not presented. The cumulative 24h urinary DTX excretion was approximately 3 times greater for the Taxotere treated animals in comparison to Procet 8 treated animals (2.36 ± 0.98 vs. 0.79 ± 0.19 % injected dose, mean± SD). Detectable urinary HDTX excretion was only found in two out of five treated rats in the Taxotere treatment group, and none of the five rats in the Procet 8 treatment group (data not shown). The detection of HDTX in the urine of one of these rats may have been the result of diminished biliary clearance, as biliary DTX (Fig. 4) and HDTX (Fig. 5) excretion was delayed in this specific animal despite an average bile flow.
Figure 4. Cumulative biliaryDTX excretion.
The pooled cumulative DTX biliary excretion data are presented for the Procet 8 (squares) and Taxotere (triangles) treatment groups.
Figure 5. Cumulative biliary HDTX excretion.
The pooled cumulative HDTX biliary excretion data are presented for the Procet 8 (squares) and Taxotere (triangles) treatment groups.
3.3 Liver Procet 8 concentrations
Procet 8 was determined in liver tissue by a LC-UV method. Procet 8 concentrations in rat liver homogenates were found to be linear over the range of 1.5–50 μg/mL (Supplementary Fig. 8). Liver concentrations of Procet 8 were similar at the 1 h and 24 h post treatment time points (14 ± 2 and 13 ± 2 μg/g tissue, respectively), corresponding to approximately 1% of the injected dose. The liver/plasma Procet 8 concentration ratio at 1h was ~0.06, and at 24h ~0.33, indicating a lack of tissue uptake relative to plasma concentrations.
3.4 Procet 8 hydrolysis in vitro
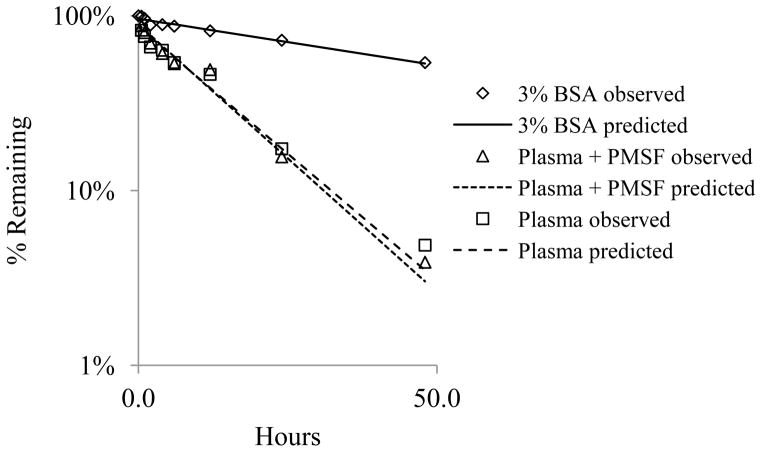
Procet 8 samples were incubated in plasma, with or without polymethylsulfonylflouride (PMSF) esterase inhibitor to determine sensitivity of hydrolysis to this inhibitor. Incubates prepared in 3% BSA were also included, in order to estimate non-enzymatic hydrolysis. The rates of Procet 8 hydrolysis in plasma, with or without PMSF, were identical (Fig. 6). By contrast, Procet 8 incubation in 3% BSA resulted in a much lower hydrolysis rate, with only ~50% hydrolyzed in the 48h period. The hydrolysis rate of Procet 8 was best fit to a first order rate, with formula (1), using uniform weighting (Fig. 6).
Figure 6. Hydrolysis of Procet 8 in rat plasma.
Procet 8 was incubated in rat plasma, with or without PMSF, or 3% BSA, as described in experimental methods. Displayed are % remaining of the initial Procet 8 concentration for the plasma (square), plasma + PMSF (triangle), and 3% BSA (diamond) at each incubation time point (Mean + SD). A first order rate, % Remaining = 100%*e (−K*Time), was fit to the Procet 8 hydrolysis data using uniform weighted regression analysis. The predicted lines from the model fit of each incubation condition, plasma (dashed line), plasma + PMSF (dotted line) and 3% BSA (solid line), are also displayed. Refer to text for half-life estimates.
| (1) |
The first order hydrolysis rate constants, K, were estimated to be 0.012 h−1 (9%), 0.070 h−1 (16%), and 0.068 h−1 (17%) (estimate (%CV) for the 3% BSA, plasma + PMSF, and plasma incubations, respectively. These data suggest that PMSF does not inhibit Procet 8 hydrolysis under these assay conditions, and a substantial amount of non-enzymatic hydrolysis occurs. The lack of PMSF inhibition of Procet 8 hydrolysis seen in this study supports the inability of PMSF to prevent Procet 8 hydrolysis during plasma sample preparation in the pharmacokinetic study (data not shown). An important note is that the appearance of DTX in the incubation mixture did not equal the corresponding loss of Procet 8. This lack of mass balance is believed to be due to cleavage of internal esters within the DTX molecule with prolonged incubation.
3.4 Compartmental pharmacokinetic modeling of biliary clearance
As summarized in the discussion, due to rapid hydrolysis of Procet 8 during plasma processing, it was not possible to accurately determine free (released) DTX plasma concentrations for the pharmacokinetic study. Methods to prevent Procet 8 hydrolysis during plasma preparation, including the use of esterase inhibitors and rapid cooling, were unsuccessful (data not shown). Therefore, a compartmental modeling approach was used to simulate DTX plasma concentrations.
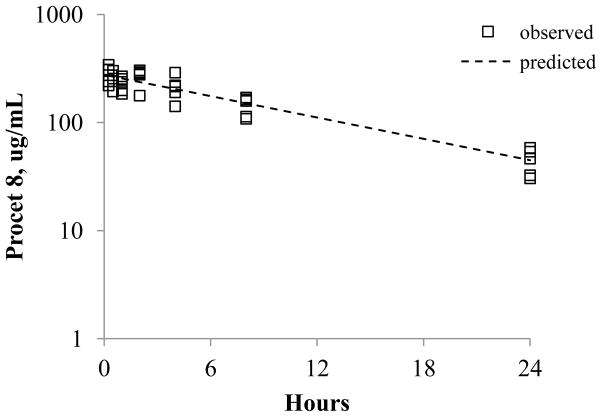
The rate of Procet 8 plasma decay was similar to the estimated Procet 8 hydrolytic rate determined in rat plasma in vitro. As discussed above, in vitro rat plasma hydrolysis was best fitted by a first order rate. The pooled Procet 8 plasma decay data were also fitted best by a first order rate, assuming a single compartment model (2), (Fig. 7).
Figure 7. Single compartment model of Procet 8 plasma decay.
The single compartment model, C(t)= (Dose/V)*e (−Kel*t), was fit to the pooled Procet 8 plasma decay data (squares) by uniform weighted regression analysis. The predicted line from the model fit is displayed. Refer to text for V and Kel model parameter estimates.
| (2) |
The dose per kg, 15 mg/kg Procet 8, was inserted as a constant in this equation. The uniform weighted regression estimates of volume of distribution, V, and terminal elimination rate, Kel, are 54 mL/kg (4%) and 0.076 h−1 (16%) (estimate (% CV). The estimated elimination rate and calculated elimination half-life of 0.693/0.076 h−1 = 9.1 h is similar to the in vitro Procet 8 hydrolysis rate and half life estimates (0.693/0.068h−1= 10.2 h), and in agreement with the non-compartmental analysis half-life estimates (Table 1). Thus, it was assumed that Procet 8 clearance is primarily metabolic, resulting from prodrug hydrolysis in plasma. For the following reasons, Procet 8 was also assumed to remain within the plasma space and not undergo appreciable tissue accumulation: 1) significant liver accumulation was not observed, 2) Procet 8 was not detectable in bile or urine, 3) Procet 8 plasma decay was monophasic without a tissue distribution phase, and 4) the estimated Procet 8 V is equivalent to plasma volume (~40 mL/kg).
Several pharmacokinetic models were attempted to best fit the Procet 8 and Taxotere plasma concentration and associated cumulative HDTX biliary excretion data, including both single and two compartmental models, with first order prodrug hydrolysis, and combinations of nonlinear and linear DTX clearance. The biliary DTX excretion data was excluded from model development due to the high degree of inter-individual variability in the data, though the data followed the same general trend as the biliary HDTX data with regard to treatment groups. The fractional hydrolysis of the prodrug to DTX was assumed to be 1, meaning competing metabolic pathways were not considered and all prodrug would eventually be hydrolyzed to active DTX. Additionally, the prodrug itself was assumed not to be eliminated intact. The naïve pooled data method, in which all individual animal data is pooled by treatment group to represent a single unique animal, was used to estimate the model parameters. One rat each in the Taxotere and Procet 8 treatment groups, were considered as outliers for biliary HDTX excretion, and these animals were excluded from the pooled analysis. Procet 8 plasma concentrations were modeled as DTX equivalents.
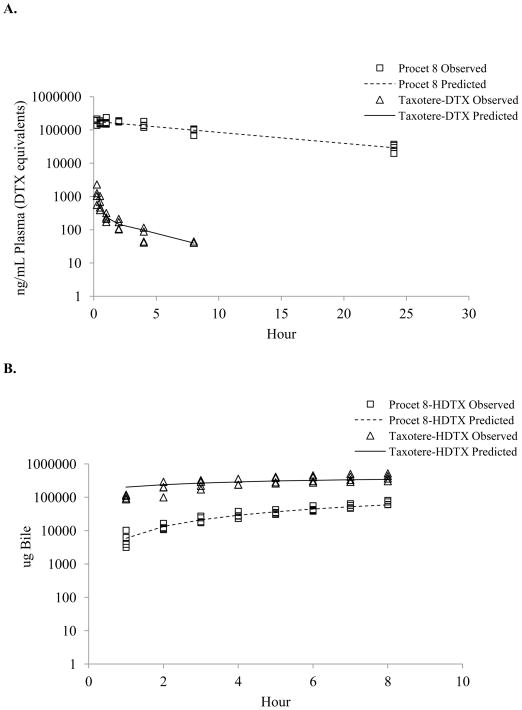
Initial parameter estimates were based on simple one and two compartment fits of the pooled Taxotere plasma concentrations, and the in vitro first order Procet 8 hydrolysis rate. Phoenix Winnonlin Version 6.3 software (Pharsight Corp., Mountain View, CA) was used to fit and simulate data. The model to best fit both the Taxotere and Procet 8 data sets was determined based on visual inspection of the predicted vs. observed data, objective function values and %CV of the parameter estimates. Based on these criteria, a two compartment model with linear biliary clearance of HDTX and nonlinear clearance representing all remaining clearance routes (e.g., urine, other biliary metabolites) was finally chosen. As mentioned previously, Procet 8 hydrolysis was described by a first order rate. A graphical representation of the model is displayed in Figure 8, and a series of ordinary differential equations representing the model are displayed below.
Figure 8. Compartmental biliary clearance model.
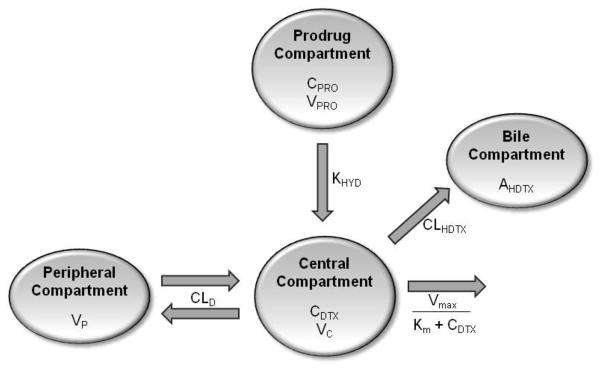
This is a two compartment model with linear distribution clearance (CLD), linear clearance for DTX oxidation to HDTX (CLHDTX) and nonlinear clearance (Vmax/(Km+CDTX) representing all remaining clearance routes (e.g., urine, other biliary metabolites). The parameters CPRO and VPRO represent the Procet 8 plasma concentration and volume of the Procet 8 compartment, respectively. Procet 8 hydrolysis to DTX is described by a first order rate (KHYD).The parameters CDTX and VC represent the DTX plasma concentration and volume of the central compartment, respectively. The parameters VP and AHDTX represent the volume of the peripheral compartment and the cumulative amount of HDTX excreted in the bile.
| (3) |
| (4) |
| (5) |
| (6) |
| (7) |
| (8) |
| (9) |
| (10) |
The terms of the above equations: APRO and CPRO, correspond to the amounts and concentrations of Procet 8 in the Procet 8 compartment, respectively; ADTX, and CDTX correspond to the amounts and concentrations of DTX central compartment, respectively; AP and CP are the amounts and concentrations of DTX in the peripheral compartment; AHDTX is the amount of HDTX in the bile compartments; AOTHER is the amount of all excreted metabolites other than HDTX; VPRO, VC, and VP are the volumes of the Procet 8, central, and peripheral compartments, respectively; Vmax and Km are the maximum velocity and Michaelis constant for all clearance routes excluding DTX oxidation to HDTX; KHYD, CLD and CL are the first order Procet 8 hydrolysis rate, distribution clearance, and DTX oxidation to HDTX clearance, respectively. During the simultaneous fitting of the Procet 8 and Taxotere data sets, the (APRO*KHYD) term was excluded from the dADTX/dt definition for the Taxotere data set, as the prodrug does not contribute to this data set.
The proportional residual error model was used for the Procet 8 and DTX plasma concentration, and cumulative HDTX biliary excretion data, as these values are measured by HPLC. The residual error equations are displayed below.
| (11) |
| (12) |
| (13) |
The terms Yobs, CPRO, Yobs, CDTX, and Yobs, AHDTX, and corresponding Ypred, CPRO, Ypred, CDTX, and Ypred, AHDTX are the measured (observed) and predicted plasma Procet 8 concentration, plasma DTX concentration and cumulative biliary HDTX amounts, respectively. ε1, ε2, and ε3 are the normally distributed error terms with means of zero and variances of,σ21, σ22, and σ23, respectively. The estimated parameters for the model fit to the Procet 8 and Taxotere data are displayed in Table 2. The observed data points with model predicted lines overlaid are displayed in Figure 9.
Table 2. Pharmacokinetic Parameter Estimates.
The parameter estimates determined by nonlinear regression fit of the compartmental model to the Taxotere and Procet 8 data. Refer to Figure 8 for a description of the parameters.
| Parameter | Value | CV% |
|---|---|---|
| VC (mL) | 760 | 21 |
| VP (mL) | 5811 | 19 |
| CLD (mL/hour) | 2202 | 11 |
| CLHDTX (mL/hour) | 212 | 9 |
| Vmax (ng/hour) | 391464 | 38 |
| Km (ng/mL) | 124 | 59 |
| VPRO (mL) | 12 | 6 |
| KHYD (hour−1) | 0.076 | 7 |
Figure 9. Biliary clearance model fit of observed data.
Prediction lines from the model fit overlay the plasma Taxotere (triangle) and Procet (square) (A), and pooled observed cumulative biliary HDTX (B) data points. Note: Procet 8 concentrations are displayed as DTX equivalent.
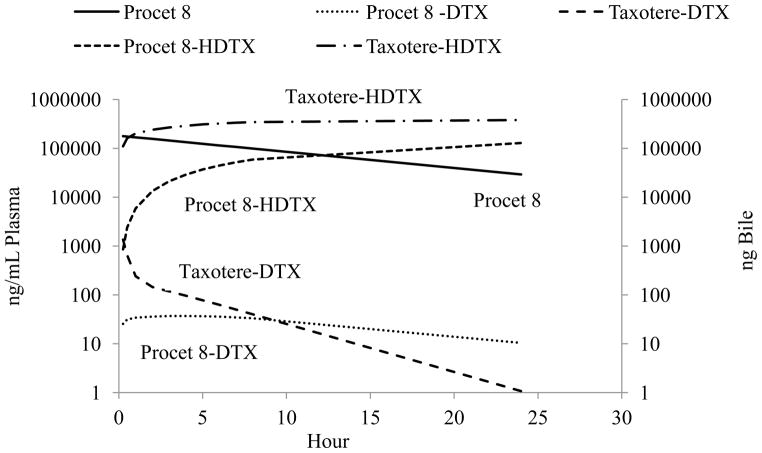
The biliary clearance model simulated data for a 10 mg DTX equivalent/kg dose of Taxotere and Procet 8 are displayed in Figure 10. Pharmacokinetic parameters determined by noncompartmental analysis of the Taxotere and Procet 8 simulated plasma DTX data are displayed in Table 3. Of note, the compartmental models nonlinear clearance resulted in a substantial difference in the estimated AUCinf between the Taxotere and Procet 8 groups (2017 vs. 775 ng × h/mL, respectively). The low predicted Km value for the non-HDTX clearance, 124 ng/mL, results in saturated clearance for the early Taxotere time points, and pseudo-first order clearance for all Procet 8 time points. Another interesting finding was DTX formation rate-limited kinetics for the Procet 8 treatment group, the implications of which are discussed in the following section.
Figure 10. Biliary clearance model simulation.
The simulated plasma DTX, plasma Procet 8, and cumulative biliary DTX profiles are displayed. Note: Procet 8 concentrations are displayed as DTX equivalent.
Table 3. Model simulation NCA pharmacokinetic parameters.
The pharmacokinetic parameters for the simulated data were estimated by noncompartmental analysis of the simulated Taxotere and Procet 8 DTX plasma profiles. See methods for abbreviations and calculations.
| lambda 1/h | t1/2 h | Cmax μg/mL | tmax h | AUCinf μg × h/mL | V L/kg | CL L/h/kg | |
|---|---|---|---|---|---|---|---|
|
|
|||||||
| Procet 8- DTX | 0.069 | 10 | 0.037 | 4 | 0.8 | - | 13 |
| Taxotere-DTX | 0.226 | 3 | 2.9 | 0 | 2 | 3.5 | 5 |
Discussion
Determination of both encapsulated (carrier bound) and unencapsulated (free) drug concentrations in plasma is often performed in an attempt to establish PK/PD relationships for nano-scale drug delivery vehicle-based pharmaceuticals. However, formulations that exhibit slow drug release kinetics from the carrier in plasma typically yield free drug concentrations that are less than 10% of total drug concentrations. This can lead to significant error in free drug estimates if any drug release occurs during the processing of plasma samples to isolate free and encapsulated fractions. For example, using ion exchange preparatory columns to separate free and liposome encapsulated doxorubicin from plasma samples yielded free drug estimates as high as 8% of total which reflected processing-induced error given that the same samples processed using ultrafiltration methods had non-detectable free drug concentrations [19]. The implications of such error in establishing toxicity or efficacy PD relationships with free drug exposure are profound. Similar complications apply to prodrug nanoparticle formulations such as the Procet 8 nanoparticle described here.
An independent study of Procet 8 stability during plasma preparation demonstrated that neither addition of esterase inhibitors or rapid cooling of Procet 8 spiked blood samples were able to prevent hydrolysis of Procet 8 to DTX during plasma preparation (data not shown). This is consistent with the Procet 8 in vitro hydrolysis study, in which PMSF also failed to suppress hydrolysis. These data strongly suggest that Procet 8 hydrolysis in plasma is either not enzyme dependent, or is a process whose rate limiting step is not hydrolysis itself (e.g., release of prodrug from micelle may be rate limiting). However, incubation of Procet 8 in 3% BSA resulted in much less hydrolysis than observed in plasma, suggestive of enzyme dependency. Hydrolysis of the prodrug during the sample preparation was significant, with approximately 10% of the initial Procet 8 hydrolyzed regardless of sample pretreatment. This 10% Procet 8 hydrolysis would result in a contribution of 10–40 μg/mL DTX to the plasma sample over the first 8 hours post dose, obscuring actual DTX concentration likely in the ng/mL range. For this reason, a modeling approach was undertaken to predict DTX plasma concentrations using biliary excretion data.
Procet 8 plasma concentrations were very high, in the μg/mL range, and followed a slow, monophasic decay with an apparent volume of distribution equivalent to plasma volume, which is typical for stable nanoscale formulations that are not appreciably sequestered by the MPS [18, 20]. Indeed, only 1% of the injected Procet8 dose was found in the liver at 1 and 24 h post treatment, corresponding to liver/plasma Procet 8 concentration ratios of ~0.06 and ~0.33, respectively. By contrast, the DTX plasma profile in Taxotere treated animals peaked in the high ng/mL range, and followed a rapid biphasic decline, with a high apparent volume of distribution suggestive of extensive tissue uptake. While urinary excretion represented a minor clearance route for both treatment groups, much greater amounts of DTX and HDTX metabolite were excreted in the bile of the Taxotere treated animals. Regardless, both treatment groups appeared to undergo comparable metabolism, as the qualitative biliary metabolite profile, and the ratio of cumulative biliary HDTX metabolite to biliary DTX, were similar for both treatment groups.
A two compartment model, with linear clearance for DTX oxidation to HDTX and nonlinear clearance representing all remaining clearance routes (e.g., urine, other biliary metabolites), was chosen based on fit criteria. Procet 8 hydrolysis to DTX was described by a first order rate. Docetaxel pharmacokinetics in Sprague Dawley rats has been described previously by a two compartment model with linear clearance [21], and although few multidose rat studies exist in which dose linearity has been evaluated, nonlinear pharmacokinetics of docetaxel in the Sprague Dawley rat has also been described previously [22]. We are not aware of a preclinical docetaxel model incorporating biliary clearance. Clinically, docetaxel is considered to have linear kinetics, therefore the nonlinearity seen in this model appears to be species-dependent [23]. However, the primary purpose of this model was not to describe DTX clearance, which is well understood clinically. The primary purpose was to describe prodrug metabolism and predict DTX bioavailability. It is the prodrug pharmacokinetic behavior in this model that is most informative for further clinical development, particularly since we have seen equivalent in vitro hydrolysis rates for human and rat plasma (data not shown).
The noncompartmental parameters calculated from the model-simulated Taxotere profile are in line with previous reports for DTX pharmacokinetics in Sprague Dawley rats at the 10 mg/kg dose, with time zero concentrations in the low μg/mL range (V of ~ 3.5 L/kg), AUCinf of ~2000 h*ng/mL and total clearance of ~5 L/H/kg [22]. With regard to predictability of the model, scaling of literature values for the in vitro intrinsic clearance of DTX oxidation to HDTX in rat, accounting for microsomal and plasma protein binding, predicted a rat hepatic clearance of 207 mL/h (see Supplemental Data for calculations) [17, 24]. This scaled value agrees well with our model estimated HDTX formation clearance of 212 mL/h.
As a result of nonlinear clearance, the model predicted unequal DTX exposure for an equivalent 10 mg DTX/kg dose, 775 vs. 2017 ng * h/mL for Procet 8 vs. Taxotere, respectively. As explained in the modeling details, it was assumed that the fractional prodrug hydrolysis to DTX was 1, meaning all prodrug was eventually converted to DTX. Low fractional hydrolysis to DTX could occur if there were competing prodrug clearance processes. We excluded alternative prodrug clearance as a possibility based on several lines of evidence: 1) the similarity of the prodrug plasma decay to the in vitro hydrolysis rate, suggesting hydrolytic clearance, 2) the lack of significant liver accumulation, with hepatic Kupffer cells being the principal organ for accumulation of polymeric nanoscale formulations [20], 3) the lack of detectable biliary or urinary prodrug excretion, 4) monophasic prodrug plasma decay, without an identifiable tissue distribution phase, and 5) an estimated volume of distribution equivalent to plasma volume (~40 mL/kg), suggesting retention within the plasma space. Nevertheless, Procet 8 hydrolysis in vitro did not result in a mass balanced increase in DTX. This was thought to be due to hydrolysis of internal DTX esters over time in the incubation, but also could theoretically be the result of hydrolysis of internal DTX esters within the Procet 8 molecule. This would result in a fractional hydrolysis of Procet 8 to DTX of less than one. Setting the fractional hydrolysis as a model estimated parameter resulted in an optimal model with two linear clearance parameters, and an estimated fractional hydrolysis of 0.54 (see Supplemental Data for modeling details). Studies are currently underway using stable isotope labeling techniques to explore the possibility that alternative pathways of prodrug metabolism exist. It is still important to note that the model predicted DTX profile was identical for both the models that included and excluding fractional hydrolysis as an estimated parameter.
The biliary clearance model for Procet 8 predicts DTX formation rate-limited kinetics. This is a special case of classic “flip-flop” kinetics, in which the absorption rate of an extravascular drug is delayed in relation to the drug elimination rate, resulting in the terminal slope actually corresponding to the absorption rate not the elimination rate[25]. This type of kinetic profile is common for controlled release formulations. In our case, the plasma DTX terminal slope is dependent upon the hydrolytic formation rate of DTX and not the actual DTX elimination rate, since the model predicted hydrolysis rate, KHYD, is much slower than the DTX terminal elimination rate (calculated from the simulated Taxotere profile), 0.076 h−1 vs. 0.23 h−1, respectively. This has interesting implications for Procet 8 pharmacokinetics. For example, this implies that DTX plasma concentrations will never accumulate to concentrations greater than that of the prodrug. Also, the time to reach steady state DTX levels following Procet 8 infusion will be dependent on Procet 8 half -life not DTX half-life. Thus, the time to reach steady state for Procet 8 infusion compared to Taxotere infusion in this model would be 10/3=3 times longer, or approximately 40 hrs vs. 13 hrs, assuming steady state is reached in ~4 half -lives.
As an example of the utility of this modeling approach, a set of companion articles published by W. J. Jusko’s laboratory detailed how pharmacokinetic modeling of drug release from a nanodroplet formulation under clinical development could be used to explain enhanced bone marrow suppression relative to Taxol [13, 26]. Similar to our study, the pharmacokinetic model was used to overcome the inaccuracies in direct drug measurement resulting from drug release during sample preparation, as well as predict compartmental drug concentrations. Intriguingly, the model predicted increased drug release from the nanodroplet into a “deep” compartment conceptually thought to include the bone marrow. A follow on pharmacokinetic/pharmacodynamic modeling study linked this deep compartment drug release with a mechanism-based pharmacodynamic model of neutropenia[26].
These data support the use of pharmacokinetic modeling and simulation in cases of complex formulations where analytical methods for direct measurement of drug concentration are unavailable or potentially inaccurate due to sample processing alterations in free drug fractions. Other uses for these pharmacokinetic models may include interpretation of preclinical toxicology studies, selection of first-in-man dosing regimens, and PK/PD model development for better disease management. With the advance of nanomedicine, the pharmaceutical community will encounter more of these complex formulations and their associated analytical challenges[18]. Modeling will undoubtedly be at the forefront of addressing these challenges.
Supplementary Material
Acknowledgments
This project has been funded in whole or in part with federal funds from the National Cancer Institute, National Institutes of Health, under contract HHSN261200800001E. The content of this publication does not necessarily reflect the views or policies of the Department of Health and Human Services, nor does mention of trade names, commercial products, or organizations imply endorsement by the U.S. Government. The authors thank Drs. Rachael M. Crist and Jennifer Hall Grossman for assistance with the preparation of the manuscript.
Footnotes
Publisher's Disclaimer: This is a PDF file of an unedited manuscript that has been accepted for publication. As a service to our customers we are providing this early version of the manuscript. The manuscript will undergo copyediting, typesetting, and review of the resulting proof before it is published in its final citable form. Please note that during the production process errors may be discovered which could affect the content, and all legal disclaimers that apply to the journal pertain.
References
- 1.Fleming AB, Haverstick K, Saltzman WM. In vitro cytotoxicity and in vivo distribution after direct delivery of PEG-camptothecin conjugates to the rat brain. Bioconjug Chem. 2004;15:1364–1375. doi: 10.1021/bc034180o. [DOI] [PubMed] [Google Scholar]
- 2.Gopin A, Ebner S, Attali B, Shabat D. Enzymatic activation of second-generation dendritic prodrugs: conjugation of self-immolative dendrimers with poly(ethylene glycol) via click chemistry. Bioconjug Chem. 2006;17:1432–1440. doi: 10.1021/bc060180n. [DOI] [PubMed] [Google Scholar]
- 3.Yu D, Peng P, Dharap SS, Wang Y, Mehlig M, Chandna P, Zhao H, Filpula D, Yang K, Borowski V, Borchard G, Zhang Z, Minko T. Antitumor activity of poly(ethylene glycol)-camptothecin conjugate: the inhibition of tumor growth in vivo. J Control Release. 2005;110:90–102. doi: 10.1016/j.jconrel.2005.09.050. [DOI] [PubMed] [Google Scholar]
- 4.Cavallaro G, Licciardi M, Caliceti P, Salmaso S, Giammona G. Synthesis, physico-chemical and biological characterization of a paclitaxel macromolecular prodrug. Eur J Pharm Biopharm. 2004;58:151–159. doi: 10.1016/j.ejpb.2004.02.012. [DOI] [PubMed] [Google Scholar]
- 5.Singer JW, Bhatt R, Tulinsky J, Buhler KR, Heasley E, Klein P, de Vries P. Water-soluble poly-(L-glutamic acid)-Gly-camptothecin conjugates enhance camptothecin stability and efficacy in vivo. J Control Release. 2001;74:243–247. doi: 10.1016/s0168-3659(01)00323-6. [DOI] [PubMed] [Google Scholar]
- 6.Veronese ML, Flaherty K, Kramer A, Konkle BA, Morgan M, Stevenson JP, O’Dwyer PJ. Phase I study of the novel taxane CT-2103 in patients with advanced solid tumors. Cancer Chemother Pharmacol. 2005;55:497–501. doi: 10.1007/s00280-004-0938-3. [DOI] [PubMed] [Google Scholar]
- 7.Tong R, Yala L, Fan TM, Cheng J. The formulation of aptamer-coated paclitaxel-polylactide nanoconjugates and their targeting to cancer cells. Biomaterials. 2010;31:3043–3053. doi: 10.1016/j.biomaterials.2010.01.009. [DOI] [PMC free article] [PubMed] [Google Scholar]
- 8.Hrkach J, Von Hoff D, Mukkaram Ali M, Andrianova E, Auer J, Campbell T, De Witt D, Figa M, Figueiredo M, Horhota A, Low S, McDonnell K, Peeke E, Retnarajan B, Sabnis A, Schnipper E, Song JJ, Song YH, Summa J, Tompsett D, Troiano G, Van Geen Hoven T, Wright J, LoRusso P, Kantoff PW, Bander NH, Sweeney C, Farokhzad OC, Langer R, Zale S. Preclinical development and clinical translation of a PSMA-targeted docetaxel nanoparticle with a differentiated pharmacological profile. Sci Transl Med. 2012;4:128ra139. doi: 10.1126/scitranslmed.3003651. [DOI] [PubMed] [Google Scholar]
- 9.Johnstone SA, Ansell SM, et al. Development of hydrophobic taxane prodrug nanoparticles with enhanced plasma circulation lifetime and improved efficacy. AACR Meeting Abstracts. 2010:3698. [Google Scholar]
- 10.Johnson BK, Prud’homme RK. Flash nanoprecipitation of organic actives and block copolymers using a confined impinging jets mixer. Aust J Chem. 2003;56:1021–1024. [Google Scholar]
- 11.Johnson BK, Prud’homme RK. Mechanism for rapid self-assembly of block copolymer nanoparticles. Phys Rev Lett. 2003;91:118302. doi: 10.1103/PhysRevLett.91.118302. [DOI] [PubMed] [Google Scholar]
- 12.Ansell SM, Johnstone SA, et al. Development of highly efficacious hydrophobic paclitaxel prodrugs delivered in nanoparticles for fixed-ratio drug combination applications. AACR Meeting Abstracts. 2008:5734. [Google Scholar]
- 13.Bulitta JB, Zhao P, Arnold RD, Kessler DR, Daifuku R, Pratt J, Luciano G, Hanauske AR, Gelderblom H, Awada A, Jusko WJ. Mechanistic population pharmacokinetics of total and unbound paclitaxel for a new nanodroplet formulation versus Taxol in cancer patients. Cancer Chemother Pharmacol. 2009;63:1049–1063. doi: 10.1007/s00280-008-0827-2. [DOI] [PubMed] [Google Scholar]
- 14.Nagashima T, Aoyama T, Yokoe T, Fukasawa A, Fukuda N, Ueno T, Sugiyama H, Nagase H, Matsumoto Y. Pharmacokinetic modeling and prediction of plasma pyrrole-imidazole polyamide concentration in rats using simultaneous urinary and biliary excretion data. Biol Pharm Bull. 2009;32:921–927. doi: 10.1248/bpb.32.921. [DOI] [PubMed] [Google Scholar]
- 15.Extra JM, Rousseau F, Bruno R, Clavel M, Le Bail N, Marty M. Phase I and pharmacokinetic study of Taxotere (RP 56976; NSC 628503) given as a short intravenous infusion. Cancer Res. 1993;53:1037–1042. [PubMed] [Google Scholar]
- 16.Bardelmeijer HA, Roelofs AB, Hillebrand MJ, Beijnen JH, Schellens JH, van Tellingen O. Metabolism of docetaxel in mice. Cancer Chemother Pharmacol. 2005;56:299–306. doi: 10.1007/s00280-004-0945-4. [DOI] [PubMed] [Google Scholar]
- 17.Vaclavikova R, Soucek P, Svobodova L, Anzenbacher P, Simek P, Guengerich FP, Gut I. Different in vitro metabolism of paclitaxel and docetaxel in humans, rats, pigs, and minipigs. Drug Metab Dispos. 2004;32:666–674. doi: 10.1124/dmd.32.6.666. [DOI] [PubMed] [Google Scholar]
- 18.Stern ST, Hall JB, Yu LL, Wood LJ, Paciotti GF, Tamarkin L, Long SE, McNeil SE. Translational considerations for cancer nanomedicine. J Control Release. 2010;146:164–174. doi: 10.1016/j.jconrel.2010.04.008. [DOI] [PMC free article] [PubMed] [Google Scholar]
- 19.Mayer LD, St-Onge G. Determination of free and liposome-associated doxorubicin and vincristine levels in plasma under equilibrium conditions employing ultrafiltration techniques. Anal Biochem. 1995;232:149–157. doi: 10.1006/abio.1995.0001. [DOI] [PubMed] [Google Scholar]
- 20.Igarashi E. Factors affecting toxicity and efficacy of polymeric nanomedicines. Toxicol Appl Pharmacol. 2008;229:121–134. doi: 10.1016/j.taap.2008.02.007. [DOI] [PubMed] [Google Scholar]
- 21.Sandstrom M, Simonsen LE, Freijs A, Karlsson MO. The pharmacokinetics of epirubicin and docetaxel in combination in rats. Cancer Chemother Pharmacol. 1999;44:469–474. doi: 10.1007/s002800051120. [DOI] [PubMed] [Google Scholar]
- 22.Nassar T, Attili-Qadri S, Harush-Frenkel O, Farber S, Lecht S, Lazarovici P, Benita S. High plasma levels and effective lymphatic uptake of docetaxel in an orally available nanotransporter formulation. Cancer Res. 2011;71:3018–3028. doi: 10.1158/0008-5472.CAN-10-3118. [DOI] [PubMed] [Google Scholar]
- 23.Clarke SJ, Rivory LP. Clinical pharmacokinetics of docetaxel. Clin Pharmacokinet. 1999;36:99–114. doi: 10.2165/00003088-199936020-00002. [DOI] [PubMed] [Google Scholar]
- 24.Chiba M, Ishii Y, Sugiyama Y. Prediction of hepatic clearance in human from in vitro data for successful drug development. AAPS J. 2009;11:262–276. doi: 10.1208/s12248-009-9103-6. [DOI] [PMC free article] [PubMed] [Google Scholar]
- 25.Yanez JA, Remsberg CM, Sayre CL, Forrest ML, Davies NM. Flip-flop pharmacokinetics--delivering a reversal of disposition: challenges and opportunities during drug development. Ther Deliv. 2011;2:643–672. doi: 10.4155/tde.11.19. [DOI] [PMC free article] [PubMed] [Google Scholar]
- 26.Bulitta JB, Zhao P, Arnold RD, Kessler DR, Daifuku R, Pratt J, Luciano G, Hanauske AR, Gelderblom H, Awada A, Jusko WJ. Multiplfol cell lifespan models for neutropenia to assess the population pharmacodynamics of unbound paclitaxel from two formulations in cancer patients. Cancer Chemother Pharmacol. 2009;63:1035–1048. doi: 10.1007/s00280-008-0828-1. [DOI] [PubMed] [Google Scholar]
Associated Data
This section collects any data citations, data availability statements, or supplementary materials included in this article.


