

Abstract
Prostate cancer is still the second cause of cancer-related death among men. Although patients with metastatic presentation have an ominous outcome, the vast majority of PCs are diagnosed at an early stage. Nonetheless, even among patients with clinically localized disease the outcome may vary considerably. Other than androgen sensitivity, little is known about which other signaling pathways are deranged in aggressive, localized cancers. The elucidation of such pathways may help to develop innovative therapies aimed at specific molecular targets.
We report that in a hormone-sensitive prostate cancer cell line, LNCaP, Notch3 was activated by hypoxia and sustained cell proliferation and colony formation in soft agar. Hypoxia also modulated cellular cholesterol content and the number and size of lipid rafts, causing a coalescence of small rafts into bigger clusters; under this experimental condition Notch3 migrated from the non-raft into the raft compartment where it co-localized with the γ-secretase complex.
We also looked at human prostate cancer biopsies and found that expression of Notch3 positively correlated with Gleason score and with expression of carbonic anhydrase IX, a marker of hypoxia. In conclusion, hypoxia triggers the activation of Notch3 which, in turn, sustains proliferation of prostate cancer cells. Notch3 pathway represents a promising target for adjuvant therapy in patients with prostate cancer.
Keywords: Prostate Cancer, Notch3, Hypoxia, Lipid Raft, Cholesterol
INTRODUCTION
Prostate cancer (PC) represents nearly a quarter of all newly diagnosed cases of male cancers (1). The majority of PCs are slow growing; however, there are cases with aggressive growth and high risk of metastasis. As suggested for many solid tumors, hypoxia plays an important role in the progression of PC where low oxygen tension correlates with poor clinical outcome (2, 3). Although conditions of extreme hypoxia may hamper the ability of tumor cells to survive, milder hypoxic conditions set off the “hypoxia response” program, which is orchestrated by the hypoxia-inducible factor (HIF)-1α, and convey to tumor cells the ability to adapt to the environment with a survival advantage (4, 5).
We previously demonstrated that exposure of PC cells to chronic hypoxia (2% oxygen) resulted in a profound change of the Notch signaling system with a strong down regulation of Notch1 and Notch2 mRNA and protein; interestingly, no significant changes were detected in Notch3 expression (6).
Notch signaling controls cell differentiation across a wide range of cell types (7), during development and in adult tissues, and mutations of Notch genes are responsible for several diseases, including cancer (8). Such a wide range of effects are dependent upon an apparently simple mechanism of receptor activation, where ligand binding results in a proteolytic cleavage of the transmembrane receptor protein, first by an ADAM metalloprotease (9) and next by a γ-secretase, that releases an intracellular domain (NICD). NICD translocates to the nucleus where it interacts with the CBF1/Suppressor of Hairless/LAG-1 (CSL) family of DNA binding proteins, leading to the activation of target genes (8).
Although apparently straightforward, the Notch signaling output is exposed to a meticulous series of check points at different steps of activation (8). One of such checkpoint involves the γ-secretase activity which is highly sensitive to membrane composition. Indeed, several lines of evidence have indicated that the enzyme ability to activate its substrates depends upon its distribution between raft and non-raft microdomains of the plasma membrane, with lipid rafts supporting the highest enzyme activity (10, 11). Hence, in order to activate the Notch signaling pathway, γ-secretase and Notch receptor need to partition to the same compartment of plasma membrane. It is likely that a change of local lipid composition, as it may occur during hypoxia (12, 13), may contribute to control the level of Notch activation through the modulation of γ-secretase function.
We now report that hypoxia modifies cell cholesterol content and membrane microdomain composition, in vitro, promoting the interaction between Notch3 receptor and γ-secretase. Activation of Notch3 sustains cell proliferation of PC cells and correlates with malignancy in vitro and tumor grading in human tissues.
MATERIAL AND METHODS
Antibodies and chemicals
Anti-Notch1 (sc-6014-R), Notch3 (M-134) (sc-5593) and Nicastrin (H-300) (sc-25648) antibodies were obtained from Santa Cruz Biotechnology Inc. (DBA, Italy); anti-Notch2 (D67C8) and GAPDH antibodies were obtained from Cell Signaling Technology (EuroClone, Milan, Italy); anti-Presenilin1 (S182) antibody was obtained from Sigma (Sigma-Aldrich S.r.l., St. Louis, USA); anti-HIF-1α antibody was obtained from Novus Biologicals (DBA, Italy) and anti-carbonic anhydrase (CA) IX (M75) antibodies from Bioscience (Slovakia S.R.O.). Horseradish peroxidase (HRP)-conjugated secondary anti-rabbit and anti-mouse antibodies were purchased from Pierce Biotechnology Inc. (EuroClone, Milan, Italy). All other reagents were obtained from Sigma unless otherwise stated. The γ-secretase inhibitor DAPT was dissolved in DMSO (20 mM stock solution). Puromycin dihydrochloride was obtained from Santa Cruz Biotechnology Inc. (DBA, Italy).
Cell cultures
The androgen-dependent human prostate cancer cell line, LNCaP, and the androgen-independent cell lines, PC-3 and Du145, were obtained from ATCC (LGC Standards S.r.l., Italy), maintained in liquid nitrogen and used within few weeks after thawing and plating. Cells were grown in RPMI-1640 (EuroClone) (LNCaP) and DMEM (PC3 and Du145), supplemented with 10% (vol/vol) fetal bovine serum (FBS) (EuroClone), L-glutamine (EuroClone) and 1% (vol/vol) antibiotic/antimycotic solution (Gibco, Invitrogen S.r.l.). Hypoxia was achieved by maintaining the cells at 2% oxygen, in a CO2 incubator (Forma Series II, Thermo Scientific) with oxygen sensor control, and CO2 and N2 gas regulators.
shRNA lentiviral particles transduction
Notch3 shRNA (h) lentiviral particles (sc-37135-V, Santa Cruz Biotechnology Inc.) containing three target-specific constructs that encode 19- to 25- nucleotide (plus hairpin) shRNA, were used for the inhibition of Notch3 expression in LNCaP cells. Control shRNA lentiviral particles (sc-108080, Santa Cruz Biotechnology Inc.), encoding a scrambled shRNA sequence, were used as negative control. Cells with stable expression of Notch3 shRNA (siN3) and control shRNA (scrambled) were isolated by puromycin selection and the extent of gene knock-down analyzed by Western blotting.
Analysis of cell growth
Cells were grown for selected times, detached by trypsin and counted using a haemocytometer. Four wells were counted for each point. The experiment was repeated three times. For growth in soft agar, cells were plated on a 0.5% agar cushion in an overlay containing RPMI, 10% FBS and 0.33% agar. After 3 weeks, colonies were stained with p-iodonitrotetrazolium violet and counted by naked eye. Four plates were counted for each condition. The experiment was repeated three times. Student’s t test was used for statistical analysis.
Western blotting
For FL-Notch3 detection cells were lysed in cold buffer (10 mM TrisHCl pH 7.4, 25 mM MgCl2, 1% Triton X-100, 1 mM dithiothreitol, 0.1 mM phenylmethylsulfonyl fluoride, 10 μg/ml leupeptin, 2 μg/ml aprotinin, 1 mM Na3VO4) and resolved by 10% SDS-PAGE. For detection of Notch3 ICD and HIF-1α cells were lysed in cold buffer (20 mM HEPES, 0.2 mM EDTA, 25% glycerol, 25 mM MgCl2, 420 mM NaCl, 0.5% NP40, 1 mM dithiothreitol, 1 mM phenylmethylsulfonyl fluoride, 10 μg/ml leupeptin, 2 μg/ml aprotinin, 1 mM Na3VO4) and resolved by 10% SDS-PAGE. Notch3 immunoreactive bands were visualized by chemioluminescence (ECL) (GE Healthcare Italia, Euroclone, Milan, Italy). Densitometric analysis was performed using GAPDH for normalization.
Cholesterol measurement
The amount of cholesterol was determined by gas chromatography/mass spectrometry (GC/MS) as previously described (14). Briefly, cells were lysed in NaOH 1N and 10 μg of proteins were used for cholesterol determination. Sterols were extracted with n-hexane and derivatized in bis-N,O-(trimethylsilyl)-trifluoroacetamide (BSTFA) with 10% trimethyl-chlorosilane at 70°C, for 30 min. BSTFA solutions (2 μl) were analyzed in a Hewlett-Packard GC-MS system composed of a 6890 series II gas chromatograph equipped with a 5973 mass spectrometry detector, a 6890 automatic injector and a GC column (J&W DB-1, Agilent) (15m×0.25mm×0.25 μm). Results (mean ± SE) are expressed as fold cholesterol variations compared with control. All measurements were carried out in triplicate and the experiment was performed three times. Inter-assay CV% was less than 10% in all the concentration range of the calibration curve. Student’s t test was used for statistical analysis.
Immunofluorescence confocal microscopy
To identify lipid rafts, cells were marked with cholera toxin (CT) β-subunit conjugated with AlexaFluor® 594 (V-34405 Vybrant® AlexaFluor® 594 Lipid Raft Labeling Kit, Molecular Probes) which binds to the monosialo-tetra-hexosylganglioside (GM1) - a sphingolipid associated with lipid rafts - following manufacturer’s instructions. Coverslips were fixed with paraformaldehyde, mounted with ProLong Gold antifade reagent (InVitrogen) and imaged on a TCS SP5 Leica R confocal microscope, equipped for fluorescence measurements. Maximum fluorescence intensity of each acquired image was analyzed by using ImageJ 1.44 software (www.rsb.info.nih.gov/ij; National Institutes of Health), which was also used for statistical evaluation of cluster areas, fluorescence intensities, and background signals. Analysis of number and size of lipid raft clusters was conducted as previously described (15).
Isolation of lipid rafts
Isolation of lipid rafts was performed using a Caveolae/Rafts isolation kit (Sigma) which is based on a density gradient (OptiPrep) and CT β-subunit conjugated with peroxidase (CTB-HRP) as raft marker (16). After centrifugation (22 hrs at 35,000 rpm, at 4°C) 9 fractions were collected and analyzed by dot-blot using 5 μl of each fraction on a PVDF membrane (Amersham Pharmacia Biothec), using CTB-HRP and anti-CD 71 (Santa Cruz Biotechnology) antibodies to identify raft (R) and non-raft (NR) fractions, respectively. Fractions 3–4 (R) and fractions 7–8 (NR) were then resolved by 8% (w/v) SDS-PAGE, transferred to a PVDF membrane and immunoblotted using primary antibodies against human Nicastrin (1:750), Presenilin 1 (1:5000), Notch1 (1:1000), Notch2 (1:1000), and Notch3 (1:1000). Immunoreactive bands were visualized by chemioluminescence using a ChemiDoc XRS.
Immunocytochemistry
Cells were grown on poly-L-lysine treated slides and fixed with acetone. Immunocytochemistry was performed using the HRP multimer system (Ultra Vision Quanto Detector System, Thermo Scientific, Bio-Optica) and anti-Notch3 antibodies. DAB (Quanto, Thermo Scientific) was used as chromogen for the development of peroxidase activity (Hydrogen Peroxide Block Kit, Thermo Scientific).
Immunohistochemistry
170 core needle biopsies and 20 non-neoplastic specimens were collected at the Urological Division of Siena University Hospital. The mean age of patients was 70.4 (range 54 to 86 years); none had received treatment for PC at the time of biopsy. Informed written consent was obtained. Paraffin embedded specimens were cut in sections of 4μm thickness and stained with hematoxylin/eosin. Tumor grade and score were established according to the Gleason grading system (17) in each core needle biopsy by an expert pathologist (MTDV). Tumor sections were classified as low grade when Gleason score was <7 and as high grade when Gleason score was >8. Foci of high-grade intra-prostatic neoplasia (PIN) were identified in peritumoral areas. Negative core needle biopsies were diagnosed as basal cell hyperplasia and atrophy. Staining was performed on 4+ 0.5μm-thick sections of each block using the Ultravision Detection System Anti-Polyvalent HRP (Ultra V Block) (LabVision, Fremont, CA, USA, Bio-Optica). Slides were incubated with anti-Notch1, Notch2 and Notch3 antibodies (1:50; pH 6) using 3, 3′-diaminobenzidine (DAB) (DAKO, Milan, Italy) as chromogen. Sections were weakly counterstained with Harris’ hematoxylin and examined under a light microscope. Non-immune serum immunoglobulins were used as negative controls. A semi-quantitative measure of immunostaining was obtained using the HSCORE (18) as follows: 1 (weak, but detectable), 2 (moderate) and 3 (intense). Three different fields (100 cells/field) were evaluated at x20 objective magnification. The analysis was performed by two blinded investigators (MRA and BJR) and the average score was used. Statistical analysis was performed using SYSTAT-7. The difference in Notch3 expression was analyzed by Chi-square test. To analyze the degree of hypoxia, 18 low-grade and 16 high-grade adenocarcinomas were stained with anti-carbonic anhydrase (CA) IX antibodies (19). HSCORE was used as a semi-quantitative measure of immunostaining. Chi-square test and k statistics were used to determine the existence of a correlate between Notch3 and CA IX expression. In any case, a p<0.05 was considered statistically significant.
RESULTS
Notch3 is activated in PC cells under hypoxia
LNCaP cells were exposed to normoxia or hypoxia for 7 days. The expression of HIF-1α protein was enhanced under reduced oxygen tension (Figure 1B). Expression of transmembrane full length (FL) Notch3 was strong under normoxia (N) (Figure 1A) but almost undetectable under hypoxia (H). However, the drop of FL Notch3 at low oxygen was lessened by treatment with the γ-secretase inhibitor DAPT (H+D), suggesting that Notch3 was strongly activated under hypoxic conditions. Treatment with DAPT also resulted in an increase, although less striking, of FL Notch3 under normoxia (N+D), indicating some degree of receptor activity. To verify that activation of Notch3 was potentiated under hypoxia, we looked at Notch3 intracellular domain (N3 ICD). As shown in Figure 1B, the amount of N3 ICD detected at low oxygen was increased, compared to normoxia. In order to confirm these observations, the expression of Notch3 was assessed by immunocytochemistry (Figure 1C): under normoxia a mild cytoplasmic staining was present; under hypoxia Notch3 stain became stronger and mostly nuclear. These data indicate that receptor activity is high at low oxygen.
Figure 1. Expression of Notch3 in PC cells exposed to normoxia and hypoxia.

A. Total cell lysates from cells exposed to normoxia (N), normoxia + 20 μM DAPT (N+D), hypoxia (H) or hypoxia + 20 μM DAPT (H+D) for 7 days, were analyzed by Western blotting using anti-Notch3 specific antibody. FL N3: full length Notch3; GAPDH indicates normalization of protein loading. B. Total cell lysates from cells exposed to normoxia (N) or hypoxia (H) for 7 days, were analyzed by Western blotting using anti-Notch3 and anti-HIF1α specific antibodies. TM N3: transmembrane Notch3; N3 ICD: Notch3 intracellular domain. GAPDH indicates normalization of protein loading. C. Notch3 immunostaining of PC cells exposed to normoxia or hypoxia for 7 days.
Notch3 sustains proliferation of PC cells
In order to establish the biological role of Notch3 in PC cells, the Notch3 gene was silenced by stable infection using a retroviral plasmid. As shown in Figure 2 (2A and 2B), the amount of Notch3 protein was significantly reduced in silenced LNCaP cells (siN3), compared to scrambled shRNA control cells. When we analyzed LNCaP proliferative capacity under anchorage-dependent and independent conditions we found that hypoxia increased the ability of scrambled shRNA (control) cells to grow and to form colonies in soft agar, compared to normoxia (2C and 2D). However, siN3 cells exhibited a significantly hampered capacity to grow, both under normoxia and hypoxia (2C and 2D). These data suggest that activation of Notch3 may sustain LNCaP cells proliferation.
Figure 2. Analysis of anchorage-dependent and independent growth of Notch3 silenced (siN3) PC cells exposed to normoxia and hypoxia.

A. Expression of full length (FL) and cleaved (transmembrane, TM) Notch3 in cells transduced with scrambled siRNA and Notch3 siRNA (siN3). GAPDH indicates normalization of protein loading. B. Densitometric analysis of FL Notch3 immunoreactive bands detected in three different N3 siRNA clones (siN3) and scrambled siRNA cells, normalized to GAPDH. The amount of Notch3 protein in control cells is equal 1. C. Growth curve of scrambled siRNA and siN3 cells exposed to normoxia (N) and hypoxia (H). Hypoxia significantly increases, while silencing of Notch3 decreases, the proliferation rate of PC cells. Statistical analysis: **p<0.05 H vs. N in scrambled siRNA cells; *p<0.0001 siN3 vs. scrambled siRNA cells, under H; § p<0.01 siN3 vs. scrambled siRNA cells, under N. D. Colony formation in soft agar of scrambled siRNA (white columns) and siN3 (black columns) cells exposed to normoxia (N) and hypoxia (H) for three weeks. Hypoxia significantly increases, while silencing of Notch3 decreases, the ability of PC cells to form colonies. Statistical analysis: **p<0.03, H vs. N in scrambled siRNA cells; *p<0.004, siN3 vs. scrambled siRNA cells, under N; §p<0.01, siN3 vs. scrambled siRNA cells, under H.
Hypoxia induces a change of membrane microdomain composition
Because the ability of γ-secretase to activate its substrates depends upon its distribution between raft and non-raft microdomains (10, 11), a change of membrane microdomain composition may contribute to control the level of Notch activity under hypoxia. Because cholesterol is the main component of lipid rafts, we studied the effect of hypoxia on cellular cholesterol content by gas chromatography-mass spectrometry (GC/MS). Cholesterol increased very rapidly (within 12 hours) when the cells were exposed to 2% oxygen, then quickly decreased to normal or below normal levels; the amount of cholesterol was still below control cells after 7 days of hypoxia (Figure 3A). We next analyzed whether the hypoxia-induced cholesterol change resulted in a change in lipid raft composition by confocal microscopy. For this purpose we analyzed and counted decorated particles that appeared larger than 1μm2 on the plasma membrane and considered them as “raft clusters”. The cut-off of 1μm2 was chosen to focus on the phenomenon of lipid raft “coalescence” which is responsible for the formation of large liquid-ordered domains that are able to compartmentalize an elevated number of proteins and, in most cases, to favor their activation (15). The maximum area of clusters and the mean and maximum fluorescence intensity were also recorded. As shown in Figure 3B, the number of lipid raft clusters increased within the first 48 hours of exposure to hypoxia. However, after 7 days the number of clusters had fallen below the level of normoxic cells. Nevertheless, their area remained significantly increased, likely due to the coalescence of small raft microdomains into bigger clusters.
Figure 3. Analysis of cholesterol level and lipid raft composition of PC cells exposed to normoxia and hypoxia.
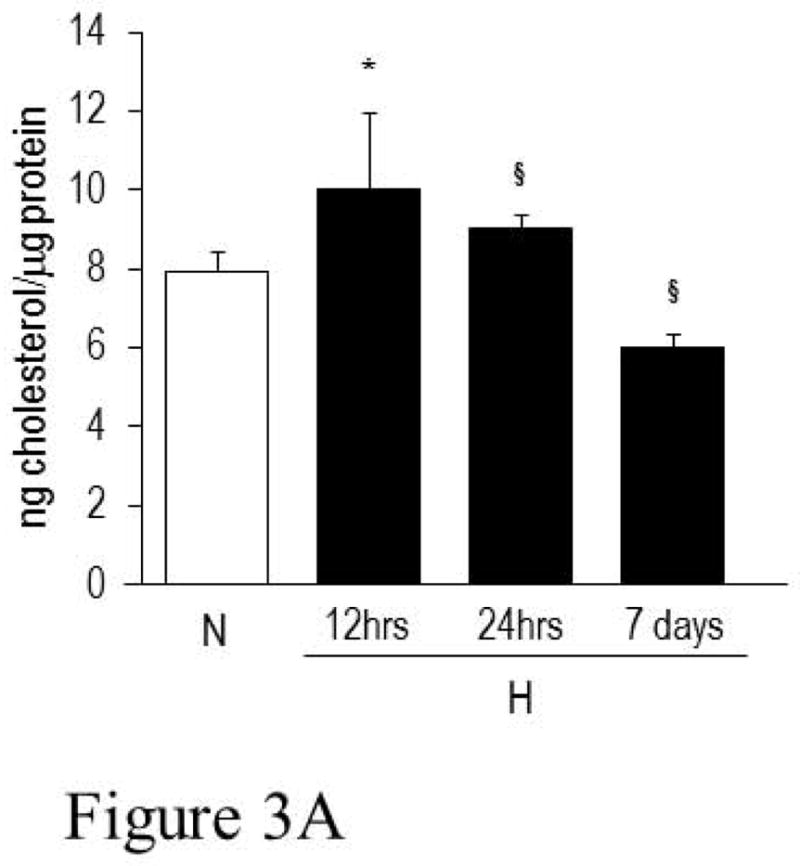

A. Amount of total cell cholesterol detected in cells maintained under normoxia (N) or exposed to hypoxia (H) for 12 hrs, 24 hrs and 7 days. Statistical analysis: *p<0.003, H 12 hrs vs. N; §p<0.001, H 24 hrs and 7 days vs. N. B. Fluorescence analysis for the assessment the number/size of raft clusters. Data are based on the analysis of rearrangement of membrane rafts and are obtained by pooling data from each single cell. Control data are presented as raw data obtained by ImageJ analysis of a wide pool of control cells. Other data are presented as percentage changes compared with control. The second column reports the percentage change in the area of labeled contiguous structures that is taken as a measure of raft clusterization. Rafts for each cell were obtained by isolating high fluorescent spots, restricting the fluorescent spot by size, and processing data with the “Analyze Particle” command contained in ImageJ 1.44 software.
Hypoxia triggers the co-localization of Notch3 and γ-secretase into lipid rafts
Finally, we sought to determine whether the hypoxia-induced change of membrane microdomain composition resulted in a change of Notch3 localization (Figure 4). Non-raft (NR) and raft (R) fractions of plasma membranes were isolated from LNCaP cells grown under normoxia and hypoxia. NR fractions were identified by positivity to CD 71, whereas R fractions were detected through the presence of GM1, using the cholera toxin (CT) β subunit (Figure 4A). Two components of the γ-secretase complex, Nicastrin and Presenilin 1, were also detected by Western blotting (Figure 4B). While Nicastrin was always identified in lipid rafts, Presenilin 1 was present in R and NR microdomains, under both experimental conditions. However, while R fractions under normoxia contained the inactive (degraded) form (18 kDa) of Presenilin 1, R fractions isolated from hypoxic cells enclosed the full length (48 kDa), active form of Presenilin 1. As expected, under normoxia Notch1–3 were detected exclusively in the NR compartment. However, while Notch1 and Notch2 became almost undetectable under hypoxia, Notch3 partially migrated into lipid rafts, likely becoming a substrate for γ-secretase activity (Figure 4B).
Figure 4. Distribution of γ-secretase components and Notch 1–3 receptors in raft and non-raft compartments of plasma membrane in PC cells exposed to normoxia and hypoxia.
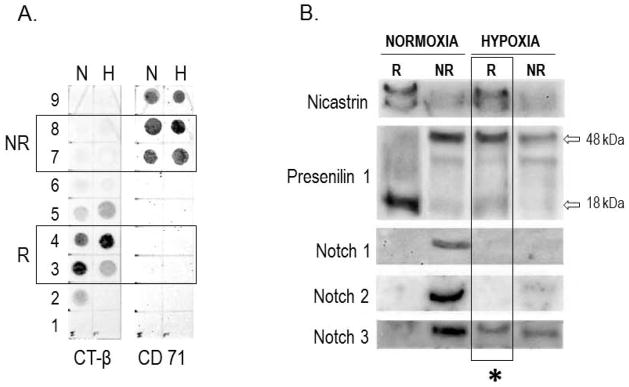
A. Dot-blot for the characterization of raft (R) and non-raft (NR) compartments of plasma membrane obtained from PC cells grown under normoxia (N) and hypoxia (H) for 7 days. R fractions are identified for their positivity to CT-β subunit; NR fractions are identified for their positivity to CD 71. Fractions 3–4 and fractions 7–8 were chosen for further characterization. B. Western blotting of fractions 3–4 (R) and 7–8 (NR) for detection of Nicastrin, Presenilin1, Notch1, Notch2 and Notch3. The inactive (18 kDa) and active (48 kDa) forms of Presenilin1 are indicated. The asterisk underlines the co-localization of Nicastrin, active Presenilin1, and Notch3 into the R compartment under hypoxia.
Expression of Notch3 in human PC cell lines and human biopsies correlates with aggressiveness and tumor grading
Because Notch3 is activated during hypoxia and hypoxia correlates with tumor aggressiveness, we sought to determine whether Notch3 expression was related to malignancy in PC cell lines and human biopsies. Three cell lines of different malignancy were compared by qPCR for Notch3 expression. As demonstrated in Figure 5, transcription of Notch3 was significantly higher in the more malignant cell lines, PC-3 and DU145, compared to the less aggressive, hormone-dependent, LNCaP cells.
Figure 5.
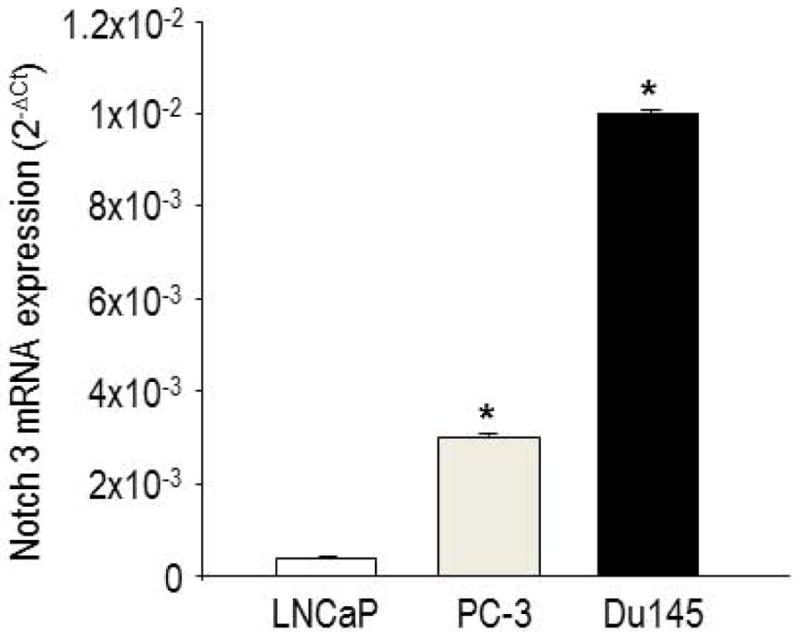
Notch3 mRNA expression in LNCaP, PC-3 and Du145 cells, assessed by quantitative real time PCR. Data are expressed as Δct. *p<0.05, PC-3 and Du145 vs. LNCaP.
The expression of Notch3 was studied also in 94 low-grade and 56 high-grade adenocarcinomas and 20 controls (12 atrophy and 8 basal cell hyperplasia) (Figure 6). A Notch3 cytoplasmic stain was present in 5 of 12 biopsies with atrophy (HSCORE 1) and absent in all cases of basal cell hyperplasia (data not shown). Notch3 staining was also detected in 6 of 11 high-grade PIN, adjacent to neoplastic glands (HSCORE 1) (Figure 6, c–d). Higher Notch3 expression (HSCORE 3) was observed more frequently in high Gleason grade (> 4; 95%) compared with low Gleason grade (< 3; 22%) (χ2= 124.330; p<0.001) (Figure 6, e–j). A higher Notch3 immunostaining (HSCORE 3) occurred more frequently in tumors with higher Gleason score (> 8; 95%) compared to lower Gleason score (< 7; 40%) (χ2= 43.281; p<0.001) (Table). Remarkably, high-grade tumors showed Notch3 nuclear staining more often (90%) than low-grade tumors (7%) (p<0.001) (Figure 6, e–j).
Figure 6. Expression of Notch3 in non-malignant and malignant prostate biopsies assessed by immunohistochemistry.

a, b: mild cytoplasmic staining in normal prostatic gland; c, d: mild cytoplasmic staining in high grade PIN, more intense at the apical pole of glandular cells; e, f: moderate cytoplasmic staining in Gleason grade 3 PC; g–j: strong cytoplasmic and nuclear staining in Gleason grade 4 (g, h) and Gleason grade 5 (i, j) PC. Original magnification: a–d, 400x; e–j, 200 x.
These data suggest progression of Notch3 receptor expression and activation with tumor malignancy. Expression of Notch1 and Notch2 was studied in a subset of 33 needle biopsies where primary and secondary Gleason grade were analyzed separately (10 Gleason grade 3, 22 Gleason grade 4, 11 Gleason grade 5). Notch1 was expressed in 80% of Gleason grade 3, with 60% showing a HSCORE 1. Only 2 cases Gleason grade 4 (9%) showed Notch1 positivity, with a HSCORE 1. None of the Gleason grade 5 was Notch1 positive (data not shown). Notch2 staining was observed in 20% of Gleason grade 3 and in 4.5% of Gleason grade 4, with a HSCORE 1. None of the Gleason grade 5 was Notch2 positive (data not shown). In any case, Notch1 and Notch2 staining was confined to the cytoplasm.
Carbonic anhydrase IX was detected as a marker of hypoxia (20) (Figure 7). In low-grade adenocarcinomas, CA IX stain was mainly observed in the cytoplasm of the neoplastic cells and in scattered nuclei, with an HSCORE 1 (27%) or 2 (72%). In high-grade carcinomas, CA IX was expressed in the cytoplasm and in the nucleus of the neoplastic cell with strong intensity, with 87.5% of samples showing a HSCORE 3. Statistical analysis demonstrated a significant, direct correlation between CA IX and Notch3 expression (p<0.0001).
Figure 7. Expression of CA IX in prostate adenocarcinoma biopsies assessed by immunohistochemistry.

a: normal prostatic gland; b, d: mild cytoplasmic and nuclear staining in Gleason grade 3 PC; c, e: strong cytoplasmic and nuclear staining in Gleason grade 5 PC. Original magnification: a–c, 200x; d–e, 400 x.
DISCUSSION
Prostate cancer is mostly diagnosed at an early stage (21). However, even among patients with clinically localized disease, the outcome may vary depending on several biochemical and clinical parameters, with Gleason grade being the most potent predictor of mortality (22). However, there is still insufficient information as to which signaling pathways are deranged in aggressive, clinically localized PC. Identification of those pathways may result in the design of innovative therapies aimed at specific molecular targets.
It is well established that solid tumors are exposed to both acute and chronic hypoxia (23), and that hypoxia is an independent prognostic predictor of poor clinical outcome (24). In patients with localized disease, a study of intra-prostatic oxygen tension demonstrated the presence of pronounced hypoxia with a significant heterogeneity in oxygenation inside different areas of the tumors (25). In LNCaP cells, chronic hypoxia induces androgen-independent growth and establishes a more aggressive phenotype (26). We demonstrated previously that when LNCaP cells are exposed to chronic hypoxia, Notch1 and Notch2 mRNA and protein are markedly reduced, as well as the transcription of the canonical Notch target genes, HES1 and HEY1 (6). We now report that, under the same experimental conditions, Notch3 expression is preserved and the receptor appears to be more active compared to normoxia. We also showed that Notch3 was able to sustain the growth of cancer cells, as demonstrated by the inhibitory effect of Notch3 silencing on cell proliferation. Taken together these data suggest that Notch3 may remain the only active receptor at low oxygen and, therefore, its function may become critical for the proliferative capacity of PC cells under hypoxia.
Notch signaling is linked to cancer and hypoxia at several levels. Hypoxia maintains stem/precursors cells in an undifferentiated state in a Notch-dependent manner (27). Hypoxia also induces epithelial-mesenchymal transition (EMT) in a Notch-dependent manner and Notch inhibition abrogates EMT and cell invasion, in different tumor types (28). In a mouse model of pulmonary arterial hypertension, low oxygen up-regulates the expression of Notch3 (29). The hypoxia-induced activation of Notch3 in LNCaP cells is likely to be driven by the change of membrane microdomain conformation that we observed by confocal microscopy. The method we used to analyze lipid raft distribution was developed by our group and previously employed for the study of caveolar rafts (15). Here the same method was applied to the analysis of planar rafts and it allowed us to quantify the macro-phenomenon of raft clusterization that may be linked to Notch3 activation. We propose that, under hypoxia, Notch3 receptor translocates from the non-raft to the raft portion of the plasma membrane where the γ-secretase complex resides in its active state. Therefore, Notch3 may become the natural substrate of the enzyme which cleaves the receptor leading to the nuclear translocation of NICD.
Recently, gene expression profile of Gleason low grade and high grade tumors was obtained (30) and 670 genes were found to be differentially expressed. Among them, Notch and EGFR signal transduction pathways appeared to be up-regulated in high grade, localized PC. A potential crosstalk between Notch and EGFR is of particular interest in light of the recent report that a synergism between Notch3 and EGFR/MAPK pathway supports the pathogenesis of lung cancer (31). In a study by Long et al. (32), the RNA from 70 radical prostatectomy specimens of known outcome was isolated for gene expression profiling: Notch3 gene was among the 10 protein-coding genes that were able to identify patients with recurrence. In this study, we went beyond gene expression and found that the level of Notch3 receptor protein significantly correlated with Gleason grade in human PC biopsies. We also found that Notch3 staining was mainly nuclear in high grade tumors, suggesting receptor activation. Moreover, staining for CA IX, a downstream target of HIF-1α (33) and a marker of hypoxia (20), showed that there was a significant, direct correlation of Notch3 expression with reduced oxygen tension.
Finally, the level of expression of Notch3 mRNA well correlated with the degree of malignancy of different PC cell lines, supporting a role of the receptor in disease progression.
It has been demonstrated previously that Notch1 knockdown causes growth inhibition and S phase arrest of PC cells (34). Moreover, activation of Notch1 signaling appears to sustain motility and migration of cancer cells (35). We propose that when oxygen tension decreases inside the tumor mass, Notch3 becomes the main Notch receptor to be transcribed and to sustain the growth of malignant cells.
In conclusion, Notch signaling pathway may represent a good molecular target for adjuvant therapy in patients with PC. However, we need to learn more about the differential roles of Notch receptors and their modulation during the development and progression of PC in order to obtain the maximal benefit from a Notch-targeted therapy. Finally, Notch3 immunostaining of localized PC biopsies may increase our ability to identify tumors with severe prognosis that may require a more aggressive therapy.
Table 1.
Table Correlation between Notch3 and Gleason classification of human PC biopsies.
| Gleason grade | |||
|---|---|---|---|
| HSCORE | ≤ 3 (n) | ≥ 4 (n) | Total (n) |
| 1 | 45 | 0 | 45 |
| 2 | 23 | 6 | 29 |
| 3 | 20 | 121 | 141 |
| Total (n) | 88 | 127 | 215 |
| Gleason score | |||
|---|---|---|---|
| HSCORE | ≤ 7 (n) | ≥ 8 (n) | Total (n) |
| 1 | 40 | 0 | 40 |
| 2 | 15 | 3 | 18 |
| 3 | 39 | 53 | 92 |
| Total (n) | 94 | 56 | 150 |
Acknowledgments
This work was supported by a grant from Maine Cancer Foundation and by NIH RO1 HL35627 to IP.
Footnotes
Conflict of interest: The authors declare no conflict of interest.
References
- 1.ONS. Cancer statistics registrations: Registrations of cancer diagnosed in 2008, England. London: National Statistics; 2011. MB1 no 38. [Google Scholar]
- 2.Janssen HL, Haustermans KM, Balm AJ, Begg AC. Hypoxia in head and neck cancer: how much, how important? Head Neck. 2005;27:622–38. doi: 10.1002/hed.20223. [DOI] [PubMed] [Google Scholar]
- 3.Stewart GD, Ross JA, McLaren DB, Parker CC, Habib FK, Riddick ACP. The relevance of a hypoxic tumour microenvironment in prostate cancer. BJU International. 2009;105:8–13. doi: 10.1111/j.1464-410X.2009.08921.x. [DOI] [PubMed] [Google Scholar]
- 4.Stewart GD, Nanda J, Brown DJ, Riddick AC, Ross JA, Habib FK. NO-sulindac inhibits the hypoxia response of PC-3 prostate cancer cells via the Akt signalling pathway. Int J Cancer. 2009;124:223–32. doi: 10.1002/ijc.23934. [DOI] [PubMed] [Google Scholar]
- 5.Ghafar MA, Anastasiadis AG, Chen MW, Burchardt M, Olsson LE, Xie H, Xie H, Benson MC, Buttyan R. Acute hypoxia increases the aggressive characteristics and survival properties of prostate cancer cells. Prostate. 2003;54:58–67. doi: 10.1002/pros.10162. [DOI] [PubMed] [Google Scholar]
- 6.Danza G, Di Serio C, Rosati F, Lonetto G, Sturli N, Kacer D, Pennella A, Ventimiglia G, Barucci R, Piscazzi A, Prudovsky I, Landriscina M, Marchionni N, Tarantini F. Notch signaling modulates hypoxia-induced neuroendocrine differentiation of human prostate cancer cells. Mol Cancer Res. 2012;10:230–8. doi: 10.1158/1541-7786.MCR-11-0296. [DOI] [PMC free article] [PubMed] [Google Scholar]
- 7.Liu J, Sato C, Cerletti M, Wagers A. Notch signaling in the regulation of stem cell self-renewal and differentiation. Curr Top Dev Biol. 2010;92:367–409. doi: 10.1016/S0070-2153(10)92012-7. [DOI] [PubMed] [Google Scholar]
- 8.Andersson ER, Sandberg R, Lendahl U. Notch signaling: simplicity in design, versatility in function. Development. 2011;138:3593–3612. doi: 10.1242/dev.063610. [DOI] [PubMed] [Google Scholar]
- 9.Bozkulak, Weinmaster Selective use of ADAM10 and ADAM17 in activation of Notch1 signaling. Mol Cell Biol. 2009;29:5679–95. doi: 10.1128/MCB.00406-09. [DOI] [PMC free article] [PubMed] [Google Scholar]
- 10.Vetrivel KS, Cheng H, Lin W, Sakurai T, Li T, Nukina N, Wong PC, Xu H, Thinakaran G. Association of gamma-secretase with lipid rafts in post-Golgi and endosome membranes. J Biol Chem. 2004;279:44945–54. doi: 10.1074/jbc.M407986200. [DOI] [PMC free article] [PubMed] [Google Scholar]
- 11.Lee SJ, Liyanage U, Bickel PE, Xia W, Lansbury PT, Kosik KS. A detergent-insoluble membrane compartment contains A beta in vivo. Nat Med. 1998;4:730–4. doi: 10.1038/nm0698-730. [DOI] [PubMed] [Google Scholar]
- 12.Arai Y, Sasaki M, Sakuragawa N. Hypoxic Effects on Cholesterol Metabolism of Cultured Rat Aortic and Brain Microvascular Endothelial Cells, and Aortic Vascular Smooth Muscle Cells. Tohoku J Exp Med. 1996;180:17–25. doi: 10.1620/tjem.180.17. [DOI] [PubMed] [Google Scholar]
- 13.Duan CL, Yan FS, Lu GW, Liu HM, Yin N. Changes in phospholipids and free fatty acids in the brains of mice preconditioned by hypoxia. Biol Signals Recept. 1999;8:261–6. doi: 10.1159/000014596. [DOI] [PubMed] [Google Scholar]
- 14.Cecchi C, Rosati F, Pensalfini A, Formigli L, Nosi D, Liguri G, Dichiara F, Morello M, Danza G, Pieraccini G, Peri A, Serio M, Stefani M. Seladin-1/DHCR24 protects neuroblastoma cells against amyloid toxicity by increasing membrane cholesterol content. J Cell Mol Med. 2008;12:1990–2002. doi: 10.1111/j.1582-4934.2008.00216.x. [DOI] [PMC free article] [PubMed] [Google Scholar]
- 15.Margheri F, Chillà A, Laurenzana A, Serratì S, Mazzanti B, Saccardi R, Santosuosso M, Danza G, Sturli N, Rosati F, Magnelli L, Papucci L, Calorini L, Bianchini F, Del Rosso M, Fibbi G. Endothelial progenitor cell-dependent angiogenesis requires localization of the full-length form of uPAR in caveolae. Blood. 2011;118:3743–55. doi: 10.1182/blood-2011-02-338681. [DOI] [PubMed] [Google Scholar]
- 16.Fujinaga Y, Wolf AA, Rodighiero C, Wheeler H, Tsai B, Allen L, Jobling MG, Rapoport T, Holmes RK, Lencer WI. Gangliosides that associate with lipid rafts mediate transport of cholera and related toxins from the plasma membrane to endoplasmic reticulm. Mol Biol Cell. 2003;14:4783–93. doi: 10.1091/mbc.E03-06-0354. [DOI] [PMC free article] [PubMed] [Google Scholar]
- 17.Epstein JI, Netto GJ. In: Grading of prostatic adenocarcinoma. Biopsy Interpretation of the Prostate. McGough Pine J., editor. Philadelphia: Lippincott Williams and Wilkins; 2007. pp. 175–202. [Google Scholar]
- 18.Lockwood CJ, Murk WK, Kayisli UA, Buchwalder LF, Huang SJ, Arcuri F, Li M, Gopinath A, Schatz F. Regulation of interleukin-6 expression in human decidual cells and its potential role in chorioamnionitis. Am J Pathol. 2010;177:1755–64. doi: 10.2353/ajpath.2010.090781. [DOI] [PMC free article] [PubMed] [Google Scholar]
- 19.Li Y, Wang H, Oosterwijk E, Selman Y, Mira JC, Medrano T, Shiverick KT, Frost SC. Antibody-specific detection of CAIX in breast and prostate cancers. Biochem Biophys Res Commun. 2009;386:488–92. doi: 10.1016/j.bbrc.2009.06.064. [DOI] [PMC free article] [PubMed] [Google Scholar]
- 20.Brahimi-Horn MC, Bellot G, Pouysségur J. Hypoxia and energetic tumour metabolism. Curr Opin Genet Dev. 2011;21:67–72. doi: 10.1016/j.gde.2010.10.006. [DOI] [PubMed] [Google Scholar]
- 21.Schroder FH, Hugosson J, Roobol MJ, Tammela TL, Ciatto S, Nelen V, Kwiatkowski M, Lujan M, Lilja H, Zappa M, Denis LJ, Recker F, Berenguer A, Määttänen L, Bangma CH, Aus G, Villers A, Rebillard X, van der Kwast T, Blijenberg BG, Moss SM, de Koning HJ, Auvinen A ERSPC Investigators. Screening and prostate-cancer mortality in a randomized European study. N Engl J Med. 2009;360:1320–8. doi: 10.1056/NEJMoa0810084. [DOI] [PubMed] [Google Scholar]
- 22.Pierorazio PM, Guzzo TJ, Han M, Bivalacqua TJ, Epstein JI, Schaeffer EM, Schoenberg M, Walsh PC, Partin AW. Longterm survival after radical prostatectomy for men with high Gleason sum in pathologic specimen. Urology. 2010;76:715–21. doi: 10.1016/j.urology.2009.11.085. [DOI] [PMC free article] [PubMed] [Google Scholar]
- 23.Movsas B, Chapman JD, Hanlon AL, Horwitz EM, Pinover WH, Greenberg RE, Stobbe C, Hanks GE. Hypoxia in human prostate carcinoma: an Eppendorf PO2 study. Am J Clin Oncol. 2001;24:458–61. doi: 10.1097/00000421-200110000-00009. [DOI] [PubMed] [Google Scholar]
- 24.Vaupel P, Kelleher DK, Hockel M. Oxygen status of malignant tumors: pathogenesis of hypoxia and significance for tumor therapy. Semin Oncol. 2001;28:29–35. doi: 10.1016/s0093-7754(01)90210-6. [DOI] [PubMed] [Google Scholar]
- 25.Parker C, Milosevic M, Toi A, Sweet J, Panzarella T, Bristow R, Catton C, Catton P, Crook J, Gospodarowicz M, McLean M, Warde P, Hill RP. Polarographic electrode study of tumor oxygenation in clinically localized prostate cancer. Int J Radiat Oncol Biol Phys. 2004;58:750–7. doi: 10.1016/S0360-3016(03)01621-3. [DOI] [PubMed] [Google Scholar]
- 26.Butterworth KT, McCarthy HO, Devlin A, Ming L, Robson T, McKeown SR, Worthington J. Hypoxia selects for androgen independent LNCaP cells with a more malignant geno- and phenotype. Int J Cancer. 2008;123:760–8. doi: 10.1002/ijc.23418. [DOI] [PubMed] [Google Scholar]
- 27.Gustafsson MV, Zheng X, Pereira T, Gradin K, Jin S, Lundkvist J, Ruas JL, Poellinger L, Lendahl U, Bondesson M. Hypoxia Requires Notch Signaling to Maintain the Undifferentiated Cell State. Dev Cell. 2005;9:617–28. doi: 10.1016/j.devcel.2005.09.010. [DOI] [PubMed] [Google Scholar]
- 28.Sahlgren C, Gustafsson MV, Jin S, Poellinger L, Lendahl U. Notch signaling mediates hypoxia-induced tumor cell migration and invasion. Proc Natl Acad Sci USA. 2008;105:6392–7. doi: 10.1073/pnas.0802047105. [DOI] [PMC free article] [PubMed] [Google Scholar]
- 29.Li X, Zhang X, Leathers R, Makino A, Huang C, Parsa P, Macias J, Yuan JX, Jamieson SW, Thistlethwaite PA. Notch3 signaling promotes the development of pulmonary arterial hypertension. Nat Med. 2009;15:1289–97. doi: 10.1038/nm.2021. [DOI] [PMC free article] [PubMed] [Google Scholar]
- 30.Ashley E, Ross AE, Marchionni L, Vuica-Ross M, Cheadle C, Fan J, Berman DM, Schaeffer EM. Gene Expression Pathways of High Grade localized Prostate Cancer. Prostate. 2011;71:1568–78. doi: 10.1002/pros.21373. [DOI] [PubMed] [Google Scholar]
- 31.Konishi J, Yi F, Chen X, Vo H, Carbone DP, Dang TP. Notch3 cooperates with the EGFR pathway to modulate apoptosis through the induction of bim. Oncogene. 2010;29:589–96. doi: 10.1038/onc.2009.366. [DOI] [PMC free article] [PubMed] [Google Scholar]
- 32.Long Q, Johnson BA, Osunkoya AO, Lai YH, Zhou W, Abramovitz M, Xia M, Bouzyk MB, Nam RK, Sugar L, Stanimirovic A, Williams DJ, Leyland-Jones BR, Seth AK, Petros JA, Moreno CS. Protein-Coding and MicroRNA Biomarkers of Recurrence of Prostate Cancer Following Radical Prostatectomy. Am J Pathol. 2011;179:46–54. doi: 10.1016/j.ajpath.2011.03.008. [DOI] [PMC free article] [PubMed] [Google Scholar]
- 33.Potter C, Harris AL. Hypoxia inducible carbonic anhydrase IX, marker of tumour hypoxia, survival pathway and therapy target. Cell Cycle. 2004;3:164–7. [PubMed] [Google Scholar]
- 34.Zhang Y, Wang Z, Ahmed F, Banerjee S, Li Y, Sarkar FH. Down-regulation of Jagged-1 induces cell growth inhibition and S phase arrest in prostate cancer cells. Int J Cancer. 2006;119:2071–7. doi: 10.1002/ijc.22077. [DOI] [PubMed] [Google Scholar]
- 35.Wang Z, Li Y, Banerjee S, Kong D, Ahmad A, Nogueira V, Hay N, Sarkar FH. Down-regulation of Notch-1 and Jagged-1 inhibits prostate cancer cell growth, migration and invasion, and induces apoptosis via inactivation of Akt, mTOR, and NF-kappaB signaling pathways. J Cell Biochem. 2010;109:726–36. doi: 10.1002/jcb.22451. [DOI] [PubMed] [Google Scholar]