Abstract
Laminitis is a chronic, crippling disease triggered by the sudden influx of dietary starch. Starch reaches the hindgut resulting in enrichment of lactic acid bacteria, lactate accumulation, and acidification of the gut contents. Bacterial products enter the bloodstream and precipitate systemic inflammation. Hindgut lactate levels are normally low because specific bacterial groups convert lactate to short chain fatty acids. Why this mechanism fails when lactate levels rapidly rise, and why some hindgut communities can recover is unknown. Fecal samples from three adult horses eating identical diets provided bacterial communities for this in vitro study. Triplicate microcosms of fecal slurries were enriched with lactate and/or starch. Metabolic products (short chain fatty acids, headspace gases, and hydrogen sulfide) were measured and microbial community compositions determined using Illumina 16S rRNA sequencing over 12-hour intervals. We report that patterns of change in short chain fatty acid levels and pH in our in vitro system are similar to those seen in in vivo laminitis induction models. Community differences between microcosms with disparate abilities to clear excess lactate suggest profiles conferring resistance of starch-induction conditions. Where lactate levels recover following starch induction conditions, propionate and acetate levels rise correspondingly and taxa related to Megasphaera elsdenii reach levels exceeding 70% relative abundance. In lactate and control cultures, taxa related to Veillonella montpellierensis are enriched as lactate levels fall. Understanding these community differences and factors promoting the growth of specific lactate utilizing taxa may be useful to prevent acidosis under starch-induction conditions.
Introduction
Horses are hindgut fermenters, adapted to grazing continually on marginal forages that change seasonally, thus slowly [1]. The hindgut (caecum and colon) comprises roughly two thirds of the volume of the equine digestive tract [2]. Here complex plant material is fermented by microbes to short chain fatty acids (SCFA) such as acetate, propionate, and butyrate, which provide 60-70% of the daily energy needs of the horse [3,4]. Rapid dietary change and modern feeding practices of 2-3 meals a day of starch-based concentrate and/or fructans from rich pasture can disrupt normal fermentation in the hindgut, causing lactic acidosis, and colic [5–8], and predisposing animals to bouts of laminitis [9–11].
Laminitis is a chronic, crippling disease, accounting for 15% of all lameness in horses in the United States, with over 27% unable to return to normal work, and 4.7% mortality [12]. It is characterized by weakened adhesion and eventual detachment of the distal phalynx from the lamellae of the inner hoof wall resulting in permanent rotation of the coffin bone and severe pain. Factors released into the bloodstream by bacteria in the gut during lactic acidosis are thought to serve as triggers for dietary laminitis [13-15], however the molecular mechanisms underlying induction are unknown.
Surveys of equine hindgut bacteria using culture based methods [16] and 16S rRNA gene sequencing [17-19] have detected a diverse community of novel microbes dominated by Firmicutes, with Bacteroidetes, Proteobacteria, and Verrucomicrobia as other major phyla. Studies have detected a greater proportion of fibrolytic bacteria than starch and lactate utilizing bacteria in the cecum than in the colon [20,21], reflecting a substrate content normally low in starch and soluble carbohydrates due to the action of endogenous enzymes and absorption of nutrients in the small intestine.
Experimental in vivo models of laminitis induction using starch gruel or oligosaccharide [22] have revealed changes in hindgut microbiota during the developmental stage (24-36 hours post induction), correlated with a drop in pH and an increase in lactic acid concentration [23,24]. Lactic acid bacteria, specifically members of the Streptococcus bovis/ equinus group (now renamed Streptococcus lutetiensis [25]), have been implicated as major producers of lactic acid, rapidly increasing in numbers as lactic acid levels rise and the pH drops. At the lowest caecal pH (4-4.5) and levels of lactic acid reaching 1000 µmol/g caecal fluid, acid sensitive fibrolytic and gram negative bacteria die off, while Lactobacilli sp. and Mitzuokella sp. increase [23,26,27]. By 32-36 hr, hindgut lactate levels and pH approach normal levels in most horses [23,28]. In other experiments of starch induction, blood D-lactate levels peaked at 20-24 hr, then declined and disappeared by 36-40 hr [29].
Lactate levels in the hindgut are normally low due to the activity of lactate utilizing bacteria. It is unclear why this mechanism fails during conditions of starch induction. While studies of lactate producers have pointed to specific taxa that proliferate during the developmental stage of laminitis [23,26,27], little is known about how the abundance of lactate utilizing bacteria changes over the same time course, which lactate utilizers survive the drop in pH, and which lactate utilizers are active in the later stages to bring lactate concentrations back to normal levels.
In this study we used fecal samples collected from 3 healthy, adult horses eating an identical pasture based diet in an in vitro model system to track bacterial metabolites and community shifts over time in response to enrichment with starch and/or lactate. Patterns of changes in lactate concentration and pH were similar to those reported in published in vivo studies [5,23]. Illumina 16s rRNA amplicon sequencing was used to track changes in hindgut microbiota over the time course, specifically identifying lactate utilizing taxa and bacterial groups that proliferated as lactate levels drop. Additionally, we identified community differences in cultures lacking the ability to clear excess lactate, which may lead to further insight into why some horses are resistant to starch induction, and point to bacteria with the potential to attenuate or prevent lactic acidosis.
Materials and Methods
Ethics Statement
This study was carried out in accordance with the guidelines set forth by the Morris Animal Foundation and applied by the Institutional Animal Care and Use Committee at the University of Massachusetts, Amherst. We thank Dr. Carlos Gradil (Department of Veterinary and Animal Sciences, University of Massachusetts, Amherst, MA) for generously lending his time and expertise in sampling, and the Hadley Farm, University of Massachusetts, Amherst, MA for providing three horses for this study.
Sampling and in vitro enrichments
Fecal samples were manually collected from the midrectum of three Morgan geldings cohoused at the University of Massachusetts, Hadley Farm and fed identical hay based diets. None of the animals had received antibiotics, anthelmenthics, or other medications for at least three months prior to sampling. Samples were protected from oxygen exposure during collection by inverting the glove around each as it was removed, and placing each immediately in a container evacuated of oxygen. Samples were kept as close to 39°C as possible in a heated, insulated container during transport and the following steps of dilution and inoculation. In an anaerobic chamber, samples were diluted to make a 10% slurry in anaerobic dilution media prepared as described by Bryant [30]. This slurry was used to inoculate basal media described by de Carvalho [31] at 2.5% which was enriched with either 1% soluble starch, 50 mM sodium lactate, or both 1% soluble starch and 50 mM sodium lactate. Control cultures were diluted at 2.5% of basal media with no enrichment. Cultures were kept under anaerobic conditions, incubated at 39°C and sampled every 12 hours for metabolite analysis and DNA extraction. Sampling and enrichments were subsequently repeated for the same horses, inoculant concentrations, culture and incubation conditions in 125 ml serum bottles (Wheaton, Millville, NJ) fitted with stoppers that enable headspace gas collection and analysis.
Metabolite measurements
Short chain fatty acids (acetate, lactate, butyrate, succinate, formate, and propionate) were measured for samples taken over the time course using high performance liquid chromatography (HPLC) (Shimadzu, Japan) with an Aminex HPX-87H column (Bio-Rad, Hercules, CA). Headspace gases were analyzed using a gas chromatograph (Shimadzu GC-8A, Shimadzu, Japan) fitted with a HayeSep DB column 100/120 (Bandera, TX). Hydrogen sulfide levels were measured using the methylene blue assay as in Cline [32] modified for culture samples as follows: at each time point, 1.0 ml of culture was removed from each serum bottle via syringe, transferred into sealed vials containing an equal volume of 1.2% degassed zinc acetate solution, and stored at 4°C until all samples were collected. To a 1.0 ml subsample, 62.5 µl of 7% sodium hydroxide was added. Following a 15 min incubation at room temperature, 187.5 µl of 0.1% N,N’-dimethyl-p-phenylenediamine and 187.5 µl 10 mM iron (III) chloride were added, stoppered immediately, and incubated for 20 minutes at room temperature. The resulting suspension was spun down and the absorbance of the supernatant was measured at 670 nm in comparison to standard solutions (0-.55mM sodium sulfide, and uninoculated media controls). pH was determined using EMD colorphast pH strips (Fischer Scientific, Pittsburgh, PA).
DNA extraction, amplification, and sequencing
DNA was extracted from each sample as described elsewhere [33,34] with the following modifications. Samples were subjected to two extractions in Matrix E bead tubes containing 5% CTAB in 1 M NaCl and .25M phosphate buffer (pH 8), phenol: chloroform: isopropyl alcohol (25:24:1), and 0.1 M ammonium aluminium sulfate, followed by separation with 24:1 chloroform: isoamyl alcohol. DNA was then precipitated with 30% polyethylene glycol 6000 in 1.6 M NaCl, washed with 70% ethanol, and resuspended in 10 mM Tris, pH 8. Replicate extractions were pooled and purified using MoBio PowerClean DNA clean-up kit (MoBio, Carlsbad, Ca) and quantified using Quant-iT PicoGreen assay (Invitrogen, Carlsbad, Ca).
Amplification of the V4 region of the 16S rRNA gene and attachment of Illumina adaptors and bar codes for multiplexing samples (reverse read only) was done in triplicate as described elsewhere [35]. Briefly, genomic DNA was amplified with universal forward 515F (5’- Illumina adapter- Forward primer pad- Forward primer linker- GTGCCAGCMGCCGCGGTAA-3’) and universal reverse 806R (5’- Illumina adapter- Golay bar code- Reverse primer pad- Reverse primer linker- GGACTACHVGGGTWTCTAAT-3’). Each PCR reaction mixture contained 10 ng of genomic DNA, 2.5 µl 10X buffer, 2.0 µl MgCl2 (25 mM), 2.0 µl dNTP (2.5 mM each), 5.0 mM (each) forward and reverse primers, 1.25 µl (25 µg) BSA (Roche, Indianapolis, IN), 0.25 µl (1.25 U) Ex Taq (TaKaRa, Japan), and molecular grade water to reach a volume of 25 µl. PCR was performed with 3 min of initial denaturation at 94°C followed by 30 cycles of the following program (denaturation, 94 °C for 45 sec; annealing, 50 °C for 30 sec; and extension, 72 °C for 45 sec) followed by a final extension at 72 °C for 7 min. PCR products were cleaned using Qiagen MinElute kit (Qiagen, Valencia, Ca) as directed and quantified using the Quant-iT PicoGreen assay (Invitrogen, Carlsbad, Ca). Equal concentrations were pooled and sequenced using the Illumina MiSeq platform at the Dana Farber Cancer Institute, Molecular Biology Core Facilities (Cambridge, MA).
Sequence analysis
Sequences were demultiplexed and trimmed of bar codes and primer sequences, then filtered for quality and reverse and forward reads were assembled into contigs using FastQC [36]. Sequence processing was done in QIIME [37] using the following workflow: Reads were aligned using default parameters (PyNAST) [38], operational taxonomic units (otus) were picked at the 97% similarity threshold using the subsampled open-reference option, chimeric sequences were identified using ChimeraSlayer [39] and removed, taxonomic assignments were made against the most recent greengenes database (October, 2012) [40]. Sequence data has been submitted to the NCBI Sequence Read Archive (SRA), Accession number: SRP028582.
Results
Patterns of changes in metabolites
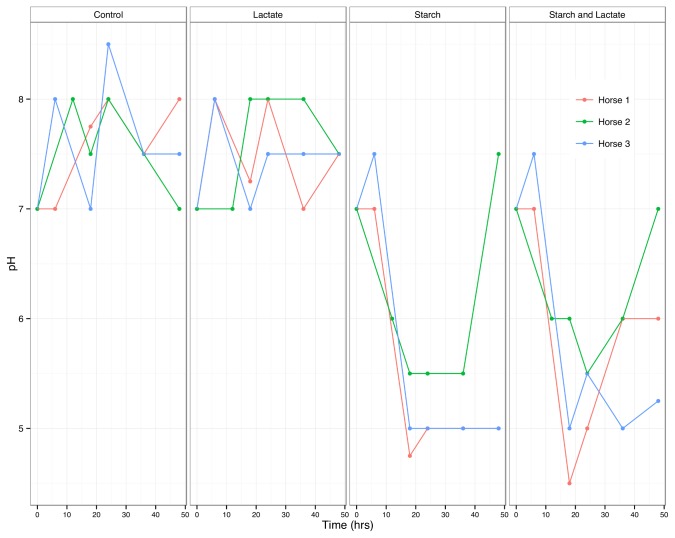
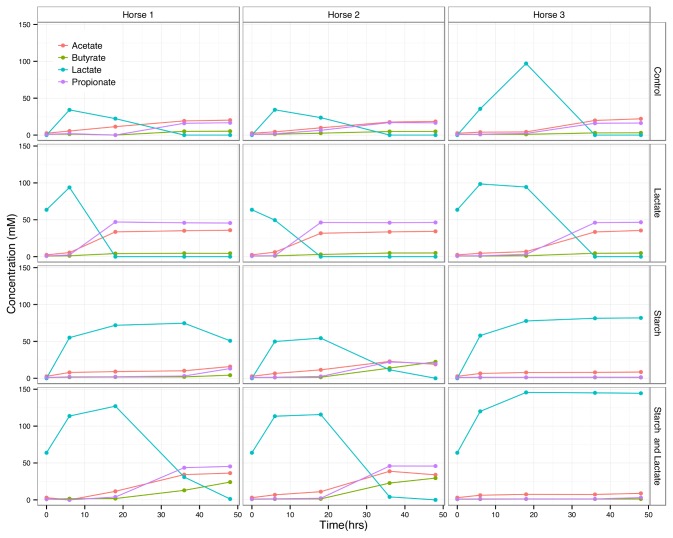
Despite variation in the pH response between the three horses, in all of the starch and starch/lactate enrichments, the pH dropped to below 6 by hour 12, and reached levels between 4 and 5 by hour 18 (Figure 1). These values paralleled the peak in lactate levels for these cultures over the same time course (Figure 2). The control and lactate enriched treatment groups showed an initial increase in lactate followed by a rapid decline as the lactate was used up. In the starch enriched cultures, lactate levels peaked by hour 18, exceeding 100 mM in cultures enriched with both starch and lactate. Where lactate levels dropped over time, there was a corresponding increase in acetate, propionate, and butyrate.
Figure 1. pH of cultures over time by horse.
pH of cultures from each horse and culture condition measured at 6 hour intervals.
Figure 2. Short chain fatty acid metabolites over time by horse.
Concentration (mM) of acetate, butyrate, lactate, and propionate measured by high performance liquid chromatography from each horse and culture condition at times 0, 6, 18, 36, and 48 hours.
The three horse cultures differed dramatically in the ability to attenuate accumulated lactate. The lactate was reduced to below detectable limits in the control and lactate enriched treatment groups of all three horse cultures, however the peak was higher for horse 3 cultures and took longer to drop. In the starch and starch/lactate enrichments the differences were more dramatic. Lactate persisted at maximum levels in horse 3 cultures over the full time course while dropping for horse 1 and 2 cultures by hour 36.
Headspace gases (hydrogen and methane) and hydrogen sulfide levels measured at 12 hour intervals did not show consistent differences between treatment and control conditions due to variation between horses especially for the starch and starch/lactate cultures (Figure S1 and Figure S2).
Sequence metrics
As shown in Table 1, there were over 6 million sequences and 41,000 OTUs in the dataset following quality filtering and initial OTU picking in QIIME [37]. Chimera removal using Chimera Slayer [39] left more than 2.5 million sequences and 32,000 OTUs for further analysis. Average read length was 254 bp.
Table 1. Sequence metrics.
| Before Chimera Check | After Chimera Check | |
|---|---|---|
| Total number of sequences | 6,043,194 | 2,576,535 |
| Sequences per sample (mean) | 125,900 | 53,678 |
| Sequences per sample (min) | 51,890 | 9,685 |
| Number of OTUs | 41,055 | 32,563 |
Total number of sequences, sequences per sample, and OTUs before and after chimera detection using Chimera Slayer.
Rarefaction curves of the number of sequences per sample by observed species (Figure S3) indicated a leveling off in terms of new species at the minimum sequence depth of 9685. Since 83% of the samples had over twice this depth, and Good’s coverage at the depth of the smallest library (9685) was 89% (Table S1), we are confident that our sequencing efforts have captured most of the diversity in these samples.
Relative abundance at the phylum level
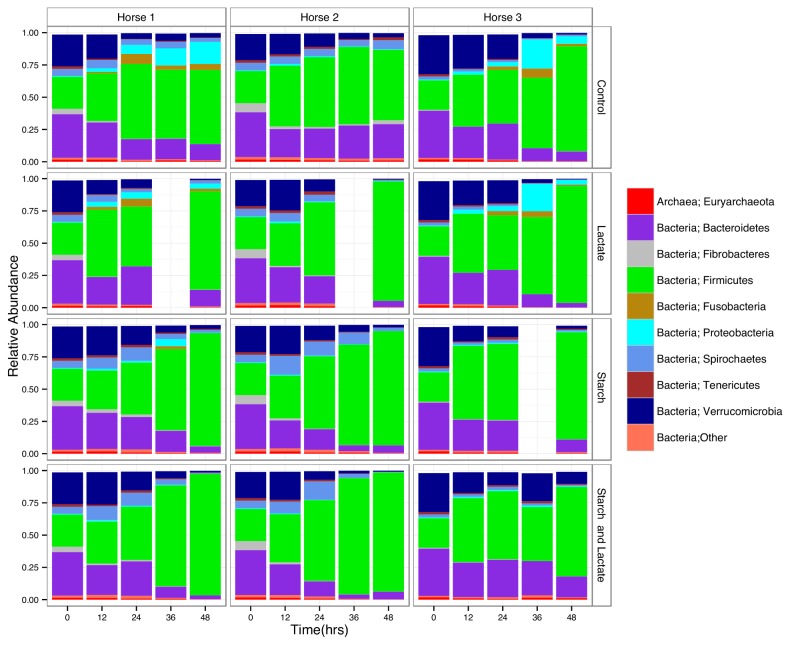
Taxonomic assignments at the phylum level (Figure 3) showed that the Firmicutes were the most abundant group by time 48 in all cultures regardless of enrichment conditions, with a corresponding decline in all other major groups, namely the Verrucomicrobia, Spirochaetes, Proteobacteria, and Bacteroidetes, however at this taxonomic level, clear differences between horse and treatment groups were not apparent.
Figure 3. Distribution of sequences by phyla.
Relative abundance of sequences for each operational taxonomic unit found at or greater than 1% at each time point for each culture condition and horse sample by phyla.
Relative abundance at the family level for Firmicutes
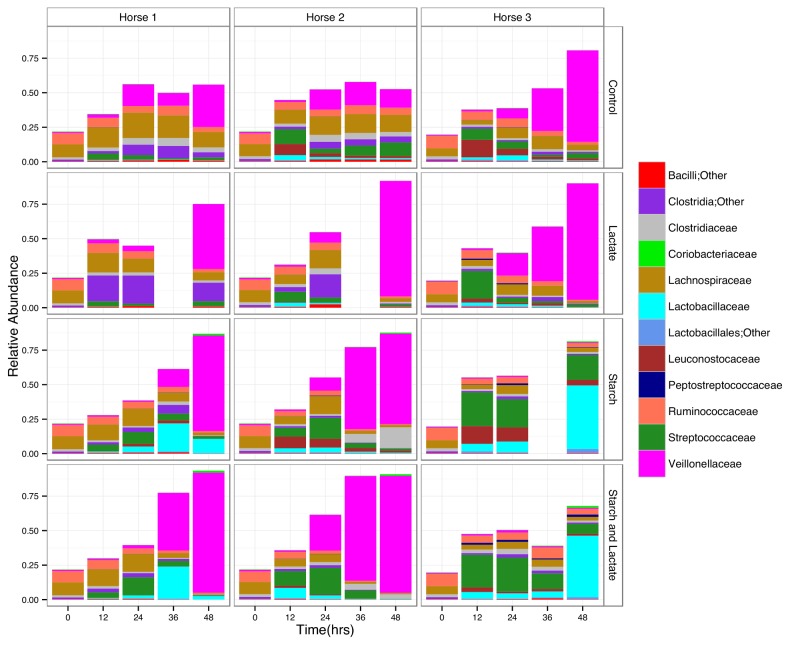
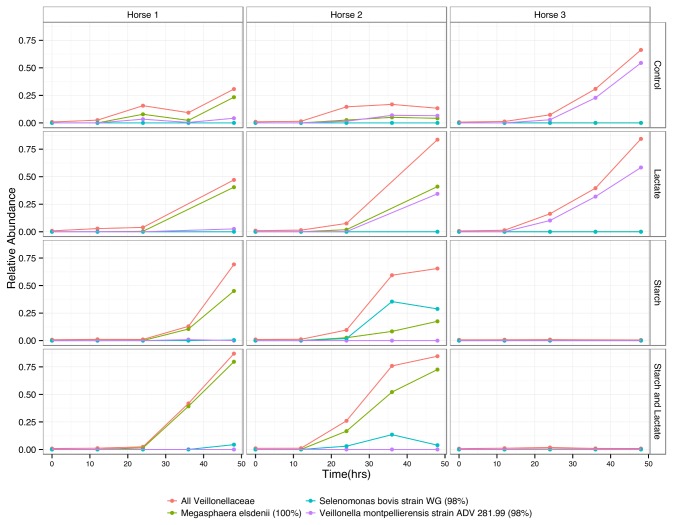
Differences between horse cultures and treatment conditions were evident at the family level, specifically for the most abundant phyla, the Firmicutes. The Veillonellaceae, a family with known lactate utilizing species [41,42], increased in abundance in all cultures in the control and lactate treatment groups. In the starch and starch/lactate enrichments there were dramatic differences between horse 3 cultures and those of horse 1 and 2 (Figure 4). By time 48, the Veillonellaceae dropped to less than 5% in horse 3 cultures, while in horse 1 and 2 cultures this group was the highest in abundance, making up more than 70% of the total sequences (Figure 4). The most abundant family for the starch and starch/lactate horse 3 cultures at time 48 were the Lactobacillaceae, making up greater than 40% of the total sequences at this time point. The Streptococcaceae reached a peak in abundance by 24 hours in the starch and starch/ lactate conditions for all horse cultures, after which the abundance dropped. In horse 1 and 3 cultures this decrease was accompanied by an increase in the Lactobacillaceae, however in horse 2 the abundance of Lactobacillaceae remained relatively low even as the Streptococcaceae declined over time.
Figure 4. Distribution of Firmicute sequences by family.
Relative abundance of Firmicutes sequences found at or greater than 1% by family at each time point for each culture condition and horse sample.
Distribution of abundant OTUs
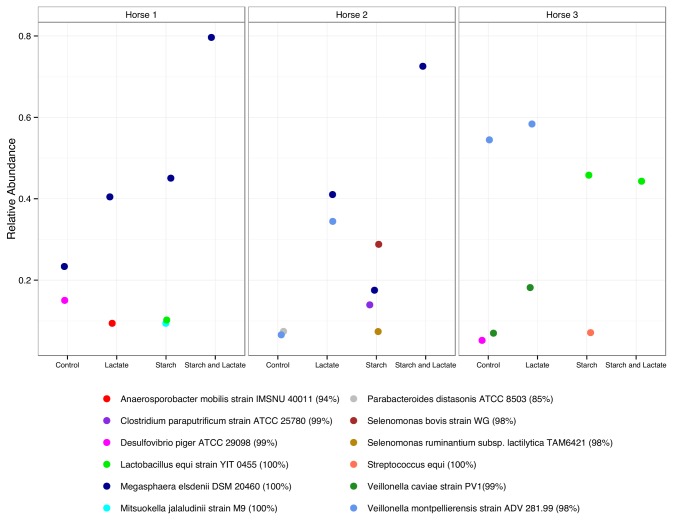
Identification of specific taxa that were most abundant by hour 48 (Figure 5 and Table 2) suggested community differences between horse cultures of specific interest in light of differences in lactate utilization and attentuation. There was a striking difference in OTU abundance and distribution between horse 3 cultures and those of horse 1 and 2 in all treatment conditions at hour 48. While the most abundant sequence (between 50-60% relative abundance, with 98% identity to Veillonella montpellierensis ) under control and lactate conditions for horse 3 was also found in horse 1 and 2 cultures, it reached a lower abundance in both. While horse 3 control and lactate enriched cultures were able to attenuate lactate, it persisted in high concentrations in starch and starch/lactate enrichments in which no member of the Veillonellaceae was highly abundant.
Figure 5. Distribution of most abundant OTUs at time 48.
Relative abundance of OTUs found at greater than 5% in each culture condition by horse. OTUs are identified by best BLAST match, and percent sequence similarity is given.
Table 2. Best BLAST hits for most abundant OTUs at Time 48.
| Best BLAST hit | Percent similarity | NCBI Accession Number |
|---|---|---|
| Parabacteroides distasonis ATCC 8503 | 85% | NR_074376.1 |
| Streptococcus equi subsp. zooepidemicus MGCS10565 | 100% | NR_102812.1 |
| Desulfovibrio piger ATCC 29098 | 99% | NR_041778.1 |
| Clostridium paraputrificum ATCC 25780 | 99% | NR_026135.1 |
| Mitsuokella jalaludinii M9 | 100% | NR_028840.1 |
| Megasphaera elsdenii DSM 20460 | 100% | NR_102980.1 |
| Anaerosporobacter mobilis IMSNU 40011 | 94% | NR_042953.1 |
| Selenomonas bovis strain WG | 98% | NR_044111.1 |
| Veillonella montpellierensis ADV 281.99 | 98% | NR_028839.1 |
| Lactobacillus equi YIT 0455 | 100% | NR_028623.1 |
| Selenomonas ruminantium subsp. lactilytica TAM6421 | 98% | NR_075026.1 |
| Veillonella caviae PV1 | 99% | NR_025762.1 |
Best BLAST it from the 16S rRNA Reference Sequence Database, Percent similarity and NCBI accession numbers for the reference sequence
A different OTU, related to Megasphaera elsdenii (100% identity) was the most abundant OTU in horse 1 and 2 cultures, especially in the starch and starch and lactate enrichments, reaching relative abundances of over 70%. While this OTU was present in single numbers at Time 0 in all three horse samples, and persisted in horse 3 in low numbers under all culture conditions (Figure 6), it never reached abundances of greater than 0.40% at any condition or time point.
Figure 6. Change in most abundant Veillonellaceae OTUs over time.
Relative abundance of most abundant Veillonellaceae OTUs over time in each culture condition by horse. OTUs are identified by best BLAST match, and percent sequence similarity is given.
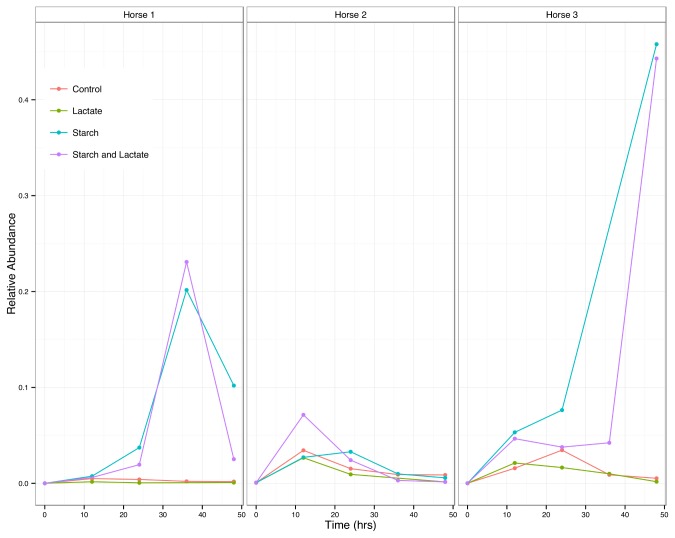
The most abundant OTU in horse 3 starch and starch and lactate cultures was related to Lactobacillus equi (100% sequence identity) and represented 97.7% of the Lactobacillaceae sequences across the dataset. This OTU was present in all three horse cultures, reaching abundances of 20% and greater in horse 1 in starch and starch and lactate enrichments at time 36, but then falling to 10% or less by time 48 (Figure 7).
Figure 7. Change in single, abundant Lactobacillaceae OTU over time.
Relative abundance of the single, dominant Lactobacillus OTU over time for each culture condition by horse.
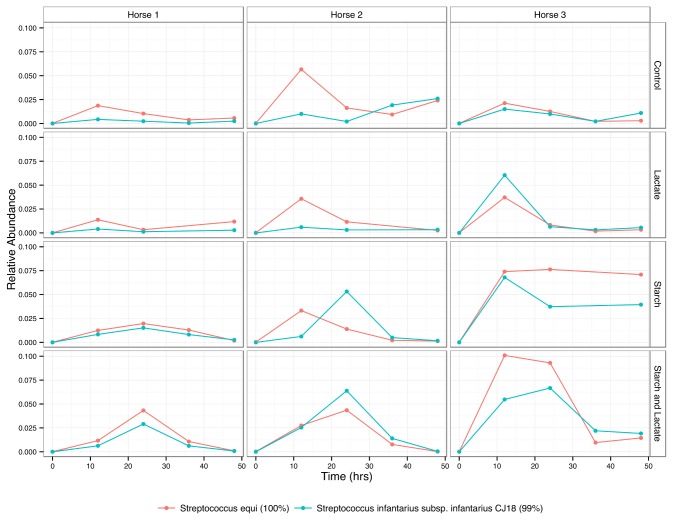
Instead of being dominated by one or two abundant OTUs, the distribution of the Streptococcaceae taxa was more dispersed, with the two most abundant OTUs (related to Streptococcus equi and Streptococcus infantarius with 100% and 99% sequence identities respectively) together accounting for less than 50% of the sequences in this group (Figure 8).
Figure 8. Change in abundant Streptococcaceae OTUs over time.
Relative abundance of dominant Streptococcus OTUs over time for each culture condition by horse. OTUs are identified by best BLAST match, and percent sequence similarity is given.
Discussion
Our in vitro system captures elements observed in vivo
The accumulation of lactate has long been recognized as an early event in the microbial response to carbohydrate overload leading to colic and laminitis in horses [5,10]. In the in vitro system described herein, we were able to simulate many key aspects of starch induced conditions that have been reported elsewhere for in vivo experiments. The extent and timing of pH changes (Figure 1) and fluctuations of SCFA levels (Figure 2), especially with respect to lactate, acetate, and propionate are similar to those reported for in vivo starch induction studies [5,23].
No study thus far has tracked microbial changes over the time course of starch induction in horses using 16S rRNA deep sequencing as described here, however, the changes that we observed in community composition are similar to what has been reported in equine and ruminant culture and probe based studies [7,14,43,44]. Specifically, in the first 24 hours following enrichment, we noted an increase in Firmicutes, especially members of the Streptococcaceae, coinciding with a decrease in fibrolytic groups (Ruminococcaceae and Lachnospiraceae), followed by an increase in the Lactobacillaceae as the abundance of Streptococcaceae falls.
Despite a sample size of three horses, we were able to observe between-horse differences in the ability to attenuate accumulated lactate as has been described in previous studies [5,23].
Certainly the microbial dynamics reported here may not reflect the actual community compositions of the caecum and large intestine of horses who recover or resist conditions of lactic acidosis, however the elucidation of endogenous lactate utilizers that thrive under conditions of low pH following starch enrichment in our in vitro model may provide insight into microbial mechanisms of resistance and/or recovery.
Lactate producing bacteria proliferate following starch induction
While we observed the pattern of increase in Streptococcus species during the first 24 hours of starch induction followed by an increase in Lactobacilli species noted in other studies [7,23] we expected the Streptococcus lutetiensis group (formerly Streptococcus bovis [25]) to be more highly represented in the starch and starch/lactate cultures, as it has been identified as the major lactate producer in in vivo starch induction studies [7,24,29]. Our data indicates a high abundance of the family Streptococcaceae in the starch and starch/lactate cultures, but fails to resolve subtle differences between species. We recognize that basing taxonomic assignments on a single region (V4) of the16S gene is inherently limited [45,46] for all bacterial groups since 500-700 bases are recommended for species resolution [47], and suspect that taxa within the Streptococcus lutetiensis group may be especially difficult to distinguish due to their close phylogenetic relationships [25,48]. Sequencing with longer reads would clarify the species composition of this family in our starch and starch/lactate enrichments.
Members of the Veillonellaceae are the most abundant lactate utilizing bacteria
While studies have pointed to Streptococcus lutetiensis and Lactobacillus sp as major lactic acid producers [7,28,29], relatively little attention has been paid to bacteria in the horse gut that actively utilize lactic acid. Studies of lactic acidosis in ruminants [43,44,49] have identified specific genera, namely Megasphaera , Veillonella , Selenomonas , Propionibacterium , and Anaerovibrio as key lactate utilizers. In fact, strains of Megasphaera elsdenii have been shown to be effective in preventing lactic acidosis in cattle and are under development as probiotic therapies [50–52].
Using deep sequencing of the 16S rRNA gene of fecal communities challenged with starch, lactate, or both in an in vitro model of starch induction, we report here changes in the abundance of specific microbes associated with the reduction of lactic acid. As we observed at time 0 in this study, 16S rRNA surveys of the equine gut microbiome have shown that under normal conditions, the Veillonellaceae (known lactate utilizers) comprise 1% or less of the total bacterial abundance [17–19]. One probe-based in vivo study did not see a difference in the abundance of Veillonellaceae in response to dietary change despite an increase in lactate levels [24]. It is unclear why the Veillonellaceae in that study did not increase in abundance as lactate accumulated, or which specific taxa were present in those horses.
In our study we observed that one particular taxa closely related to Megasphaera elsdenii was highly abundant in all starch and starch/lactate cultures in which lactate accumulated and was attenuated. This taxa was present in very low abundance in cultures in which lactate persisted. It is unclear why this taxa fails to proliferate in any of the horse 3 cultures while reaching such high abundances under all conditions in horse 1 and 2 cultures. A second OTU related to Veillonella montpellierensis was highly abundant in control and lactate enrichments specifically in horse 2 and 3 cultures, but did not thrive in the starch or starch/lactate enrichments, suggesting that other factors such as pH or competitive interactions exert selective pressure under starch and starch/lactate enrichment conditions.
While our data indicates a relationship between the presence of the Megasphaera elsdenii OTU and the reduction of lactate, conclusive evidence that this taxa is responsible for reducing lactate levels will require further study. It is possible that other community members with lactate utilizing capabilities are playing active roles as well.
Understanding the factors stimulating or preventing the proliferation of lactate utilizers in the horse gut microbiome could provide valuable information about why some horses are more sensitive to starch induction, and the microbial basis behind mechanisms of resistance.
Conclusions
A robust in vitro model for starch induced laminitis in horses as described here could provide a convenient and cost effective means to understand the microbial dynamics underlying colic and laminitis, and test hypotheses for ways to prevent or interrupt the progress of these equine diseases. Specific taxa in the family Veillonellaceae were highly abundant in starch enriched cultures that were able to attenuate lactate. These could provide useful insights into mechanisms of recovery or resistance, and could be valuable, individually or in consortia, as probiotics to prevent starch induced colic and laminitis.
Supporting Information
Hydrogen sulfide concentrations over time by horse. Concentration (mM) of hydrogen sulfide measured by the Cline (methylene blue) assay from each horse and culture condition at 12 hour intervals.
(TIF)
Headspace gas concentrations over time by horse. Concentration (mM) of hydrogen and methane gases measured by gas chromatography from each horse and culture condition at times 9, 20, 32, and 45 hours.
(TIF)
Rarefaction curves by horse. Observed species by number of sequences per sample for each horse dataset generated using a sampling depth of 9685 (the minimum number of sequences per sample and default parameters in QIIME.)
(TIF)
Alpha diversity estimates for each sample. Chao1, observed species, Shannon Index and Good’s coverage for each horse dataset generated using default parameters in QIIME.
(XLSX)
Acknowledgments
We thank Dr. Carlos Gradil (Department of Veterinary and Animal Sciences, University of Massachusetts, Amherst, MA) for generously lending his time and expertise in sampling, and the Hadley Farm, University of Massachusetts, Amherst, MA for providing three horses for this study.
Funding Statement
Support of research supplies and services provided by: Pilot Study: Morris Animal Foundation: D-12EQ-814: Identifying bacteria associated with starch induced laminitis and colic with the potential to attenuate lactate in the equine gut http://www.morrisanimalfoundation.org. For salary support: National Science Foundation Graduate Research Fellowship: http://www.nsfgrfp.org. The funders had no role in study design, data collection and analysis, decision to publish, or preparation of the manuscript.
References
- 1. Janis C (1976) The evolutionary strategy of the Equidae and the origins of rumen and cecal digestion. Evolution: 757–774. [DOI] [PubMed] [Google Scholar]
- 2. Argenzio RA (1975) Functions of the equine large intestine and their interrelationship in disease. Cornell Vet 65: 303–330. PubMed: 237739. [PubMed] [Google Scholar]
- 3. Argenzio RA, Hintz HF (1972) Effect of diet on glucose entry and oxidation rates in ponies. J Nutr 102: 879–892. PubMed: 4556122. [DOI] [PubMed] [Google Scholar]
- 4. Argenzio RA, Southworth M, Stevens CE (1974) Sites of organic acid production and absorption in the equine gastrointestinal tract. Am J Physiol 226: 1043–1050. PubMed: 4824856. [DOI] [PubMed] [Google Scholar]
- 5. Garner HE, Coffman JR, Hahn AW, Hutcheson DP, Tumbleson ME (1975) Equine laminitis of alimentary origin: an experimental model. Am J Vet Res 36: 441–449. PubMed: 1124880. [PubMed] [Google Scholar]
- 6. Al Jassim RAM, Andrews FM (2009) Bacterial Community of the Horse Gastrointestinal Tract and its Relation to Fermentative Acidosis, Laminitis, Colic, and Stomach Ulcers. Vet Clin North Am Equine Pract 25: 199–215. doi:10.1016/j.cveq.2009.04.005. PubMed: 19580934. [DOI] [PubMed] [Google Scholar]
- 7. Milinovich GJ, Trott DJ, Burrell PC, van Eps AW, Thoefner MB et al. (2006) Changes in equine hindgut bacterial populations during oligofructose-induced laminitis. Environ Microbiol 8: 885–898. doi:10.1111/j.1462-2920.2005.00975.x. PubMed: 16623745. [DOI] [PubMed] [Google Scholar]
- 8. Crawford C, Sepulveda MF, Elliott J, Harris PA, Bailey SR (2007) Dietary fructan carbohydrate increases amine production in the equine large intestine: Implications for pasture-associated laminitis. J Anim Sci 85: 2949–2958. doi:10.2527/jas.2006-600. PubMed: 17591708. [DOI] [PubMed] [Google Scholar]
- 9. Garner HE, Moore JN, Clark L, Amend JF, Tritschler LG et al. (1978) Changes in the caecal flora associated with the onset of laminitis. Equine Vet J 10: 249–252. doi:10.1111/j.2042-3306.1978.tb02273.x. PubMed: 738266. [DOI] [PubMed] [Google Scholar]
- 10. De Fombelle A, Julliand V, Drogoul C, Jacotot E (2001) Feeding and microbial disprders in horses: 1-Effects of an abrupt incorporation of two levels of barley in a hay diet on microbial profile and activities. J Equine Vet Sci 21: 439–445. doi:10.1016/S0737-0806(01)70018-4. [Google Scholar]
- 11. Gonçalves S, Julliand V, Leblond A (2002) Risk factors associated with colic in horses. Vet Res 33: 641–652. doi:10.1051/vetres:2002044. PubMed: 12498565. [DOI] [PubMed] [Google Scholar]
- 12. Lameness and Laminitis in U.S. Horses (2005). Usdaaphisvs Ceah 4: 250. [Google Scholar]
- 13. Garner HE, Moore JN, Johnson JH, Clark L, Amend JF, Tritschler LG, Coffmann JR (1978) Changes in the Caecal Flora associated with the Onset of Laminits. Equine Vet J 10: 249–252. doi:10.1111/j.2042-3306.1978.tb02273.x. PubMed: 738266. [DOI] [PubMed] [Google Scholar]
- 14. Bailey SR, Baillon M-L, Rycroft AN, Harris PA, Elliott J (2003) Identification of Equine Cecal Bacteria Producing Amines in an In Vitro Model of Carbohydrate Overload. Appl Environ Microbiol 69: 2087–2093. doi:10.1128/AEM.69.4.2087-2093.2003. PubMed: 12676687. [DOI] [PMC free article] [PubMed] [Google Scholar]
- 15. Bailey SR, Adair HS, Reinemeyer CR, Morgan SJ, Brooks AC et al. (2009) Plasma concentrations of endotoxin and platelet activation in the developmental stage of oligofructose-induced laminitis. Vet Immunol Immunopathol 129: 167–173. doi:10.1016/j.vetimm.2008.11.009. PubMed: 19091426. [DOI] [PubMed] [Google Scholar]
- 16. Mackie RI, Wilkins CA (1988) Enumeration of anaerobic bacterial microflora of the equine gastrointestinal tract. Appl Environ Microbiol 54: 2155–2160. PubMed: 3190223. [DOI] [PMC free article] [PubMed] [Google Scholar]
- 17. Daly K, Stewart CS, Flint HJ, Shirazi-Beechey SP (2001) Bacterial diversity within the equine large intestine as revealed by molecular analysis of cloned 16S rRNA genes. FEMS Microbiol Ecol 38: 141–151. doi:10.1111/j.1574-6941.2001.tb00892.x. [Google Scholar]
- 18. Shepherd ML, Swecker WS, Jensen RV, Ponder MA (2012) Characterization of the fecal bacteria communities of forage-fed horses by pyrosequencing of 16S rRNA V4 gene amplicons. FEMS Microbiol Lett 326: 62–68. doi:10.1111/j.1574-6968.2011.02434.x. PubMed: 22092776. [DOI] [PubMed] [Google Scholar]
- 19. Willing B, VöRö SA, Roos S, Jones C, Jansson A et al. (2009) Changes in faecal bacteria associated with concentrate and forage-only diets fed to horses in training. Equine Vet J 41: 908–914. doi:10.2746/042516409X447806. PubMed: 20383990. [DOI] [PubMed] [Google Scholar]
- 20. Kern DL, Slyter LL, Leffel EC, Weaver JM, Oltjen RR (1974) Ponies vs. steers: Microbial and chemical characteristics of intestinal microbiota. J Anim Sci 38: 559–564. PubMed: 4856481. [DOI] [PubMed] [Google Scholar]
- 21. De Fombelle A, Julliand V, Drogoul C, Jacotot E (2003) Characterization of the microbial and biochemical profile of the different segments of the digestive tract in horses given two distinct diets. Acta Agric Scand Secion Anim Sci 77: 293–304. [Google Scholar]
- 22. van Eps A, Pollitt CC (2006) Equine laminitis induced with oligofructose. Equine Vet J 38: 203–208. PubMed: 16706272. [DOI] [PubMed] [Google Scholar]
- 23. Milinovich GJ, Burrell PC, Pollitt CC, Klieve AV, Blackall LL et al. (2008) Microbial ecology of the equine hindgut during oligofructose-induced laminitis. Isme J 2: 1089–1100. doi:10.1038/ismej.2008.67. PubMed: 18580970. [DOI] [PubMed] [Google Scholar]
- 24. Daly K, Proudman CJ, Duncan SH, Flint HJ, Dyer J et al. (2012) Alterations in microbiota and fermentation products in equine large intestine in response to dietary variation and intestinal disease. Br J Nutr 107: 989–995. doi:10.1017/S0007114511003825. PubMed: 21816118. [DOI] [PubMed] [Google Scholar]
- 25. Poyart C (2002) Taxonomic dissection of the Streptococcus bovis group by analysis of manganese-dependent superoxide dismutase gene (sodA) sequences: reclassification of “Streptococcus infantarius subsp. coli” as Streptococcus lutetiensis sp. nov. and of Streptococcus bovis biotype II. 2 as Streptococcus pasteurianus sp. nov. Int J Syst Evol Microbiol 52: 1247–1255 doi:10.1099/ijs.0.02044-0. [DOI] [PubMed] [Google Scholar]
- 26. Respondek F, Goachet AG, Julliand V (2008) Effects of dietary short-chain fructooligosaccharides on the intestinal microflora of horses subjected to a sudden change in diet. J Anim Sci 86: 316–323. doi:10.2527/jas.2006-782. PubMed: 17940163. [DOI] [PubMed] [Google Scholar]
- 27. Al Jassim RAM, Scott PT, Krause D, Denman S, McSweeney CS (2005) The diversity of cellulolytic and lactic acid bacteria of the gastro-intestinal tract of the horse. Recent Adv Anim Nutr. Aust 15: 155–163. [Google Scholar]
- 28. Milinovich GJ, Trott DJ, Burrell PC, Croser EL, Al Jassim RAM et al. (2007) Fluorescence in situ hybridization analysis of hindgut bacteria associated with the development of equine laminitis. Environ Microbiol 9: 2090–2100. doi:10.1111/j.1462-2920.2007.01327.x. PubMed: 17635552. [DOI] [PubMed] [Google Scholar]
- 29. Al Jassim RAM, Scott PT, Trebbin AL, Trott D, Pollitt CC (2005) The genetic diversity of lactic acid producing bacteria in the equine gastrointestinal tract. Fems Microbiol Lett 248: 75–81. doi:10.1016/j.femsle.2005.05.023. PubMed: 15953698. [DOI] [PubMed] [Google Scholar]
- 30. Bryant MP, Burkey LA (1953) Culture methods and some characteristics of some of the more numerous groups of bacteria in the bovine rumen. J Dairy Sci 36: 205–217. doi:10.3168/jds.S0022-0302(53)91482-9. [Google Scholar]
- 31. de Carvalho IPC, Detmann E, Mantovani HC, Paulino MF, de Campos Valadares Filho S, et al. (2011) Growth and antimicrobial activity of lactic acid bacteria from rumen fluid according to energy or nitrogen source. Rev Bras Zootec 40: 1260–1265. doi:10.1590/S1516-35982011000600014. [Google Scholar]
- 32. Cline JD (1969) Spectrophotometric determination of hydrogen sulfide in natural waters. Limnol Ocean 14: 454–458. doi:10.4319/lo.1969.14.3.0454. [Google Scholar]
- 33. Griffiths RI, Whiteley AS, O’Donnell AG, Bailey MJ (2000) Rapid method for coextraction of DNA and RNA from natural environments for analysis of ribosomal DNA- and rRNA-based microbial community composition. Appl Environ Microbiol 66: 5488–5491. doi:10.1128/AEM.66.12.5488-5491.2000. PubMed: 11097934. [DOI] [PMC free article] [PubMed] [Google Scholar]
- 34. DeAngelis KM, Silver WL, Thompson AW, Firestone MK (2010) Microbial communities acclimate to recurring changes in soil redox potential status. Environ Microbiol 12: 3137–3149. doi:10.1111/j.1462-2920.2010.02286.x. PubMed: 20629704. [DOI] [PubMed] [Google Scholar]
- 35. Caporaso JG, Lauber CL, Walters WA, Berg-Lyons D, Huntley J et al. (2012) Ultra-high-throughput microbial community analysis on the Illumina HiSeq and MiSeq platforms. ISME J. Available: http://www.nature.com/ismej/journal/vaop/ncurrent/full/ismej20128a.html?WT.mc_id=ISMEHP12. [Accessed: 5 Mar 2013] [DOI] [PMC free article] [PubMed]
- 36. Andrews S (2012) FastQC. Cambridge, UK: Babraham Institute. [Google Scholar]
- 37. Caporaso JG, Kuczynski J, Stombaugh J, Bittinger K, Bushman FD et al. (2010) QIIME allows analysis of high-throughput community sequencing data. Nat Methods 7: 335–336. doi:10.1038/nmeth.f.303. PubMed: 20383131. [DOI] [PMC free article] [PubMed] [Google Scholar]
- 38. Caporaso JG, Bittinger K, Bushman FD, DeSantis TZ, Andersen GL et al. (2010) PyNAST: a flexible tool for aligning sequences to a template alignment. Bioinformatics 26: 266–267. doi:10.1093/bioinformatics/btp636. PubMed: 19914921. [DOI] [PMC free article] [PubMed] [Google Scholar]
- 39. Haas BJ, Gevers D, Earl AM, Feldgarden M, Ward DV et al. (2011) Chimeric 16S rRNA sequence formation and detection in Sanger and 454-pyrosequenced PCR amplicons. Genome Res 21: 494–504. doi:10.1101/gr.112730.110. PubMed: 21212162. [DOI] [PMC free article] [PubMed] [Google Scholar]
- 40. DeSantis TZ, Hugenholtz P, Larsen N, Rojas M, Brodie EL et al. (2006) Greengenes, a chimera-checked 16S rRNA gene database and workbench compatible with ARB. Appl Environ Microbiol 72: 5069–5072. doi:10.1128/AEM.03006-05. PubMed: 16820507. [DOI] [PMC free article] [PubMed] [Google Scholar]
- 41. Kolenbrander P (2006) The Genus Veillonella. In: Dworkin M, Falkow S, Rosenberg E, Schleifer K-H, Stackebrandt E. The Prokaryotes. New York, NY: Springer Verlag; US. pp. 1022–1040. Available: http://www.springerlink.com/index/10.1007/0-387-30744-3_36 . Accessed 26 June 2013 [Google Scholar]
- 42. Haikara A, Helander I (2006) Pectinatus, Megasphaera and Zymophilus. In: Dworkin M, Falkow S, Rosenberg E, Schleifer K-H, Stackebrandt E. The Prokaryotes. New York, NY: Springer; US. pp. 965–981. Available: http://www.springerlink.com/index/10.1007/0-387-30744-3_32 . [Accessed]: 26 Jun 2013 [Google Scholar]
- 43. Marounek M, Bartos S (1987) Interactions between rumen amylolytic and lactate-utilizing bacteria in growth on starch. J Appl Bacteriol 63: 233–238. doi:10.1111/j.1365-2672.1987.tb04941.x. PubMed: 3429358. [DOI] [PubMed] [Google Scholar]
- 44. Mackie RI, Gilchrist FMC, Heath S (1984) An in vivo study of ruminal micro-organisms influencing lactate turnover and its contribution to volatile fatty acid production. J Agric Sci 103: 37–51. doi:10.1017/S0021859600043306. [Google Scholar]
- 45. Kumar PS, Brooker MR, Dowd SE, Camerlengo T (2011) Target Region Selection Is a Critical Determinant of Community Fingerprints Generated by 16S Pyrosequencing. PLOS ONE 6: e20956. doi:10.1371/journal.pone.0020956. PubMed: 21738596. [DOI] [PMC free article] [PubMed] [Google Scholar]
- 46. Chakravorty S, Helb D, Burday M, Connell N, Alland D (2007) A detailed analysis of 16S ribosomal RNA gene segments for the diagnosis of pathogenic bacteria. J Microbiol Methods 69: 330–339. doi:10.1016/j.mimet.2007.02.005. PubMed: 17391789. [DOI] [PMC free article] [PubMed] [Google Scholar]
- 47. Clarridge JE (2004) Impact of 16S rRNA Gene Sequence Analysis for Identification of Bacteria on Clinical Microbiology and Infectious Diseases. Clin Microbiol Rev 17: 840–862. doi:10.1128/CMR.17.4.840-862.2004. PubMed: 15489351. [DOI] [PMC free article] [PubMed] [Google Scholar]
- 48. Schlegel L (2003) Reappraisal of the taxonomy of the Streptococcus bovis/Streptococcus equinus complex and related species: description of Streptococcus gallolyticus subsp. gallolyticus subsp. nov., S. gallolyticus subsp. macedonicus subsp. nov. and S. gallolyticus subsp. pasteurianus subsp. nov. Int J Syst Evol Microbiol 53: 631–645. doi:10.1099/ijs.0.02361-0. PubMed: 12807180. [DOI] [PubMed] [Google Scholar]
- 49. Mackie RI, Heath S (1979) Enumeration and isolation of lactate-utilizing bacteria from the rumen of sheep. Appl Environ Microbiol 38: 416–421. PubMed: 16345430. [DOI] [PMC free article] [PubMed] [Google Scholar]
- 50. Robinson JA, Smolenski WJ, Greening RC, Ogilvie ML, Bell RL et al. (1992) Prevention of acute acidosis and enhancement of feed intake in the bovine by Megasphaera elsdenii 407A. J Anim Sci 70: 310. [Google Scholar]
- 51. Kung L, Hession AO (1995) Preventing in vitro lactate accumulation in ruminal fermentations by inoculation with Megasphaera elsdenii. J Anim Sci 73: 250–256. PubMed: 7601741. [DOI] [PubMed] [Google Scholar]
- 52. Aikman PC, Henning PH, Humphries DJ, Horn CH (2011) Rumen pH and fermentation characteristics in dairy cows supplemented with Megasphaera elsdenii NCIMB 41125 in early lactation. J Dairy Sci 94: 2840–2849. doi:10.3168/jds.2010-3783. PubMed: 21605754. [DOI] [PubMed] [Google Scholar]
Associated Data
This section collects any data citations, data availability statements, or supplementary materials included in this article.
Supplementary Materials
Hydrogen sulfide concentrations over time by horse. Concentration (mM) of hydrogen sulfide measured by the Cline (methylene blue) assay from each horse and culture condition at 12 hour intervals.
(TIF)
Headspace gas concentrations over time by horse. Concentration (mM) of hydrogen and methane gases measured by gas chromatography from each horse and culture condition at times 9, 20, 32, and 45 hours.
(TIF)
Rarefaction curves by horse. Observed species by number of sequences per sample for each horse dataset generated using a sampling depth of 9685 (the minimum number of sequences per sample and default parameters in QIIME.)
(TIF)
Alpha diversity estimates for each sample. Chao1, observed species, Shannon Index and Good’s coverage for each horse dataset generated using default parameters in QIIME.
(XLSX)


