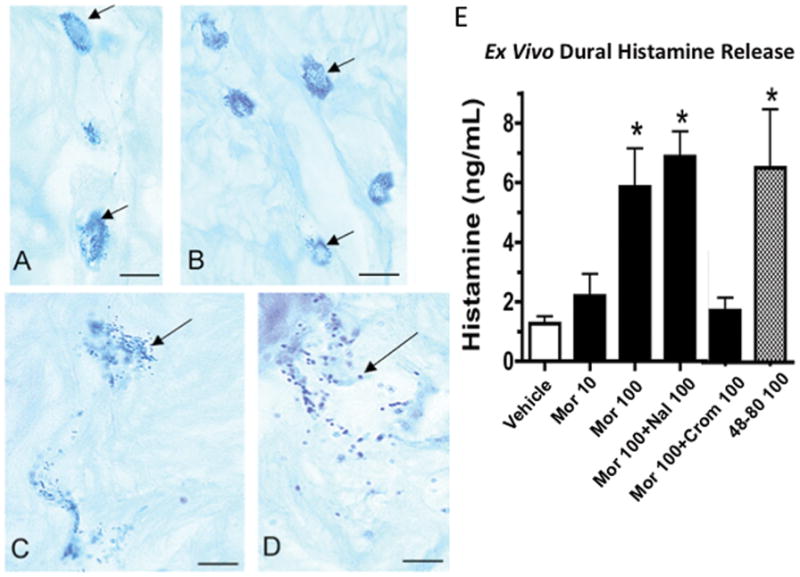
Figure 9.

Histology shows single Alcian Blue stained mast cells (see arrows) found in dog lumbar meninges harvested after exposure to A: vehicle, B: 10μM morphine, C/D: 100μM morphine (Bar = 20μ) E. Ex vivo histamine release from dural fragments after treatment as indicated (Mor: morphine; Nal: naloxone; Crom: cromolyn). Doses indicated are in μM indicated in legend. Each bar presents the mean ± SEM of 4–8 samples. 1-Way ANOVA analysis across treatments showed a significant main effect: p<0.0001. Post hoc using Dunnett’s multiple comparison: * p<0.05 vs. vehicle (saline).
