Abstract
Parkinson's disease (PD) is a progressive neurological disorder characterized by tremor, rigidity, and slowness of movements. Particular changes related to various pathological attacks in PD could result in causal interactions of the brain network from resting state functional magnetic resonance imaging (rs-fMRI) data. In this paper, we aimed to disclose the network structure of the directed influences over the brain using multivariate Granger causality analysis and graph theory in patients with PD as compared with control group. rs-fMRI at rest from 10 PD patients and 10 controls were analyzed. Topological properties of the networks showed that information flow in PD is smaller than that in healthy individuals. We found that there is a balanced local network in healthy control group, including positive pair-wise cross connections between caudate and cerebellum and reciprocal connections between motor cortex and caudate in the left and right hemispheres. The results showed that this local network is disrupted in PD due to disturbance of the interactions in the motor networks. These findings suggested alteration of the functional organization of the brain in the resting state that affects the information transmission from and to other brain regions related to both primary dysfunctions and higher-level cognition impairments in PD. Furthermore, we showed that regions with high degree values could be detected as betweenness centrality nodes. Our results demonstrate that properties of small-world connectivity could also recognize and quantify the characteristics of directed influence brain networks in PD.
Keywords: Functional magnetic resonance imaging, multivariate granger causality analysis, graph theory, parkinson's disease, resting state
INTRODUCTION
With moderately good spatial and temporal resolution, functional magnetic resonance imaging (fMRI) provides unique measure for the non-invasive study of the human brain. The human brain is a complex network, which has been characterized by spatially dynamic interactions among distinct regions in specific connectivity patterns.[1,2,3,4,5] Brain networks have been primarily studied in terms of two major approaches. One is functional connectivity analysis methods that identify the temporal similarity patterns of neuronal interactions between spatially separate brain regions,[6,7,8] usually computed using linear correlation analysis.[9,10,11] Nonetheless, correlation between two regions time series does not imply either causality or even direction of information flow. The other is effective connectivity that measures the causal influence that one neuronal system exerts over the other.[12] Since the connectivity matrix for the effective connectivity network is not symmetric, this network is also referred to a directed influence network.
Recently, there have been several studies that investigate the directed network in different activated brain regions[13,14] and within resting-state networks (RSNs).[15,16] One group of methods attempting to estimate directionality is “lag-based” approach, giving an estimation of directional connection. In this concept, it is assumed that one time series causes the other with temporal relation, if one has similar properties with a time-shifted version of the other. In particular, the most common method is Granger causality. Granger causality analysis (GCA)[17] is an efficient approach that quantifies the causal relationship and the flow of information.[18,19,20] This estimator is formalized within the framework of multivariate autoregressive (MVAR) linear model.[21,22]
The analysis of low-frequency (0.01-0.1 Hz) oscillations in task-free (“resting state”) BOLD fMRI data has revealed a rich spatiotemporal structure that has become a dominant theme in brain imaging.[7,23] Most resting state fMRI (rs-fMRI) studies have been extended to studies of functional and effective connectivity network based on small-world characteristics.[1] Small-world properties are highlighted mark of a complex network. Small-world topology can signify consistent and optimal architecture of the structural and/or functional connection network of human brain. Small-world architectures using graph theory have focused on connectivity at both regional level[1,16,24] and voxel level.[25] However, it remains as an open question what the structure of the directed influence brain network would be[1,2] and whether the characteristics of topology would change in neuropsychiatric or neurodegenerative diseases. For this reason, the methodological application is designed in a real diagnostic dilemma so that the techniques are assessed in both health and disease. As an example of a disease in which directional connectivity is impaired,[26] Parkinson's disease (PD) was elected for this study. PD is a neurodegenerative disorder of the brain that is clinically characterized by slow movement, resting tremor, and rigidity.[27] The primary culprit is dopaminergic cell loss, particularly in the nigrostriatal system.[27] We first briefly comment on studies that are related, but not directly comparable to our work. Helmich et al.[28] showed that connectivity of the posterior putamen with the inferior parietal cortex decreases in PD and that connectivity beween posterior putamen and the anterior part is increased. In addition, Wu et al.[29] found that, in order to compensate dysfunction of the basal ganglia, effective connectivity in cortico-cerebellar motor networks are increased in PD patients as compared to controls for improving the self-initiated movements. Baudrexel et al.[30] revealed the increase of subthalamic nucleus-motor cortex connectivity in PD. Recent studies on resting state connectivity of PD are mainly focused on functional connectivity.[30,31,32] However, few researchers have investigated effective connectivity of PD on task stimulation such as movement.[29,33] Thus, in this study, we purposely focused on the specific changes associated with pathological impairments in PD, which can be indicated in directed interaction of the brain network in rs-fMRI data. To this end, multivariate Granger causality analysis (MGCA) in the time domain was applied on the reference time series of each pair of ROIs. Subsequently, the resulting influence threshold matrices for directed graph networks of PD and normal control (NC) were generated and topological parameters such as causal flow, clustering coefficient, modulatory, and betweenness centrality were also evaluated.
MATERIALS AND METHODS
rs-fMRI Data
10 PD patients and 10 age- and sex-matched healthy subjects were studied. All patients were assessed clinically and scored according to the Hoehn and Yahr scale, while medications were withheld for long enough. The experiments were performed according to the national legislation and the Declaration of Helsinki and with the approval from the local ethics committee. All subjects were right-handed and gave their written informed consent for the study.
Data were acquired at John Radcliffe Hospital, Oxford, UK (at the Oxford Centre for Functional Magnetic Imaging of the brain). The driven equilibrium single pulse observation of T1 (DESPOT1)-HIFI quantitative imaging method implemented on a 3T Siemens (Erlangen, Germany) Trio MR scanner. For each subject, a structural high resolution T1-weighted with flip angle: 18° and 182 × 218 × 182 matrix size, and 120 volumes resting state functional T2-weighted images of EPI data with parameters: Slice thickness = 3 mm, resolution = 3 × 3 mm, TE = 30 ms, TR = 3000 ms were acquired.
Preprocessing
All functional data were first pre-processed using tools from the FMRIB Software Library (FSL, http://www.fmrib.ox.ac.uk/fsl) and applied to the following procedures: Slice-timing correction relative to middle axial slice for the temporal difference in acquisition among different slices, head motion correction as the translational or rotational parameters of a data set did not exceed ±1 mm or ±1° and therefore no datasets were excluded; spatial smoothing using a Gaussian kernel of FWHM 6 mm, mean-based intensity normalization of all volumes by the same factor, and removing nonbrain tissue using BET were also part of FSL with threshold of 0.6. The first three volumes were discarded to remove the initial transient effects. Further preprocessing included spatial normalization, which carried out in two steps: Coregistration to structural images with seven DOF and normalization to the Montreal Neurological Institute (MNI) template with 12 DOF using FMRIB's Linear Image Registration Tool (FLIRT). Moreover, for each subject, structural high-resolution images were segmented into three partials: White matter, gray matter, and cerebrospinal fluid derived using FAST, FSL tissue segmentation tool. The time series of each voxel was finally passed through a band-pass filter (0.01-0.08 Hz) to reduce low-frequency drift and high frequency physiological noise.
Granger Causality Analysis
The notion of causality between two time series was introduced by Wiener[34] and was later formalized by Granger within the framework of MVAR linear models.[17] In the concept of unconditional G-causality, X2 “causes” X1 if knowing X2 helps predict the future of X1 or its formulated statement, if the inclusion of past observations of X2 reduces the prediction error of X1 in a linear regression model of X1 and X2, as compared to a model which includes only previous observations of X1.[17,35] G-causality can be described for two time series X1 (t) and X2 (t) (both of length T) by a bivariate autoregressive model:

Where P is the maximum number of lagged observations included in the model, A contains the coefficients of the model, and ε1, ε2 are the residuals for each time series.
The definition of Granger–Wiener causality is based on statistical prediction: A time series has causal influence on another if the variance of the autoregressive prediction error of the later is reduced by including the past measurements of the former. Assuming that X1 and X2 are covariance stationary, the magnitude of this interaction can be measured by the log ratio of the prediction error variances for the restricted (R) and unrestricted (U) models:

Where, ξ1R is derived from the model omitting the A12, j (for all j) coefficients in the first equation and ξ1U is derived from the full model.
Geweke demonstrated that pairwise time-domain Granger causality can be additively decomposed by frequencies[36] and introduced measure of directional linear dependence between two time series conditioned on a third.[37] G-causality can generalize to the multivariate (conditional) case in which G-causality of X2 on X1 is tested in the context of multiple additional variables X3…. Xn.[36] In this case, X2 G-causes X1 if knowing X2 reduces the variance in X1's prediction error when all other variables X3…. Xn are also included in the regression model. In this paper, multivariate version of Granger causality is applied as described in Seth.[38]
The estimation of MVAR model requires the number of time lags as a parameter (p) to include, i.e., the model order. A principled approach to specify the model order is to minimize a criterion that balances the variance accounted for by the model against the number of coefficients to be estimated. Two important criteria are the Akaike information criterion (AIC)[39] and the Bayesian information criterion (BIC).[40] For n variables:

Where, T is the length of time series and n is the number of variables.
The causality relation is not reciprocal, thus allowing determination of the direction of information flow between the time series. In this method, the model includes the time series of individual regions without needing the reference time series derived from task stimulation design. Furthermore, this method is suitable for resting state analysis.
GRAPH THEORY
Graphs are sets of nodes and corresponding edges that can be used to represent networks.[1,4] An edge connecting two nodes can be interpreted as the presence of connection between them. The topological properties of the directed influence brain network are defined based on a weighted directed graph G consisting of the numeric values of the threshold in the causal interaction matrix:

Where, wij refers to the directed edge from node i to node j in the graph at the threshold level of T and Fi→j is the causality effect from node i to j. All edges have nonnegative weights and wij∈[0, 1] (1 ≤ i, j ≤ M), M is the number of ROIs. We implemented standard network parameters computation in MATLAB using software distributed by Rubinov and Sporns.[41] For each subject and each causality interaction, the following network parameters were calculated:
Connectivity Inflow-Outflow Relationships
Weighted out-degree Kouti of node i is the weight of outgoing edges incident the nodes:

Accordingly, weighted in-degree Kini is related to the incoming edges:[42]

the total degree of node i can be defined as the difference between Kouti and Kini:[43]
Ktotali = Kouti – Kini (9)
Clustering Coefficient
The clustering coefficient for a given node i describes the local connectedness of direct neighbors around individual nodes. The clustering coefficient of a weighted directed graph is defined as follows:[44]

Modulatory
A module is a subgroup of the graph that has higher connections with each other than with the other part of the graph. The algorithm to find the optimal modularity in directed network has been generalized by Leicht and Newman:[45]

Where, mi is the module containing node i, and δmimj = 1 if mi = mj, and 0 otherwise.
Betweenness Centrality
Betweenness centrality captures the influence that one node has over the flow of information between all other nodes in the network and can be calculated as follows:[46]

Where, δmn is the total number of shortest paths from node m to node n and δmn (i) is the number of shortest paths from node m to node n that pass through node i. Regions are identified as the hubs of the network if betweenness centrality values are at least one standard deviation (SD) greater than the average of the parameter over the network (i.e., Bi > mean ± SD).
ROI SELECTION
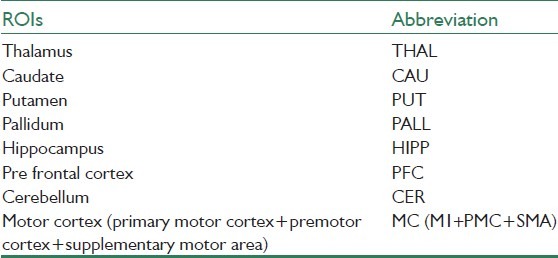
Based on the pathophysiologic model of PD in the literature[26] and according to the common understanding of the motor system, the regions that are especially involved in movement were selected. These included three parts of basal ganglia (caudate, putamen, pallidum), thalamus, cerebellum, hippocampus, and motor cortex (M1, premotor cortex, and supplementary motor cortex). The motor cortex comprises the primary motor cortex, premotor cortex, and supplementary motor area. Details of the abbreviations can be found in Table 1. For preparing the mask of ROIs, three following steps are required:
Table 1.
List of regions of interest and corresponding abbreviations
Extracting the ROIs using the Harvard-Oxford Cortical and Subcortical Structural Atlas atlases (http://www.fmrib.ox.ac.uk/fsl/data/atlas-descriptions.html)
Splitting ROIs in left and right hemisphere using the fslmaths commands
Setting weighted masks threshold at 50% and making binary masks.
All structural and functional images were transformed to standard atlas and the representative time series of each ROI was obtained by averaging the fMRI time series across all voxels in the ROI. Several procedures were used to remove possible spurious variances from the data including: 1) six head motion parameters obtained in the realigning step, 2) signal from a region in cerebrospinal fluid, 3) signal from a region centered in the white matter, and 4) the linear trend.[47]
Moreover, to correct for the influence of physiological noise, estimations of cardiac and respiratory information were performed using a temporal Probabilistic Independent Component Analysis (tPICA), as implemented in melodic. Specifically, 37 components were identified from our resting-state datasets. Among the spatial patterns of the components, the one with highest spatial correlation with a predefined cardiac source map was considered as the major source of cardiac artifact.[48] The time courses from the cardiac-correlated map were averaged to generate a cardiac time series. The same procedure was done to generate a respiratory artifact. These cardiac and respiratory time series were also then used to regress out physiological influence.
RESULTS
Regional Directed Interactions Based on Granger Causality
The most effective processing steps to implementation of GCA approach is illustrated in Figure 1. Here, we used an implementation of GCA referred to as “Granger Causal Connectivity Analysis” toolbox.[38] According to previous studies that give rational reasons to use the filtered fMRI data for directed influence brain network during the resting state,[49] band pass filtering (0.01-0.08 Hz) was applied on data before GCA. As this approach requires the specification of the “model order” (number of recent time points to include in the autoregressive model), the Akaike information criterion[39] yielded an optimum model order to seven.
Figure 1.
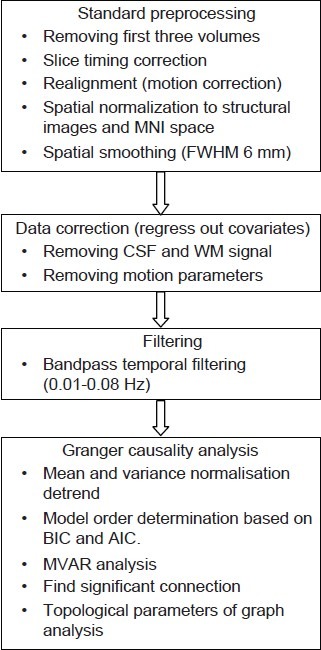
Resting-state Granger causality analysis processing methodology
The mean direct influence matrix of each pair of ROIs was calculated by averaging the Granger connectivity values across all the subjects in left and right hemispheres [Figure 2]. The causal coefficients of two groups are not significantly different (P = 0.6); nevertheless, mean and variance of NC is 0.122 ± 0.18 and PD is 0.089 ± 0.11.
Figure 2.
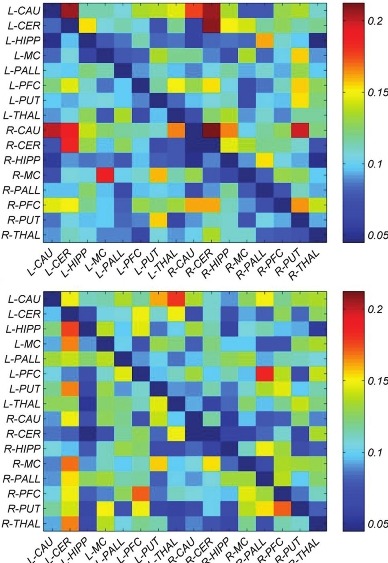
The group direct influence of each pair of ROIs was calculated by the Granger influence matrices across all the subjects in healthy group (top) and in Parkinson patients (below). Abberivations as in Table 1
Granger Causality Network of the Brain
A directed network can illustrate the interpretation of the measured effective connectivity. We constructed directed connectivity network of causal interactions for NC and PD group. The 16-ROI connectivity matrix contains a huge number of connections (16 × 15) and it is difficult to interpret. Therefore, the network was further reduced by removing connections, which did not comply threshold and it was constructed involving all significant connections at the threshold level of T in sixtheen ROIs. We established first level group analysis of Granger causality coefficients via an F-test at threshold level (P < 0.05) and multiple comparison correction with bonferroni correction.[38] The network obtained from the resulting MVAR is shown in Figure 3. The colors of connections represent Granger connection strengths. The figure illustrates that there are positive pairwise cross relevancies between caudate and cerebellum in the left and right hemispheres. In addition, motor cortex and caudate have reciprocal connections in the left and right hemispheres. However, there are not any symmetric connections in PD network.
Figure 3.
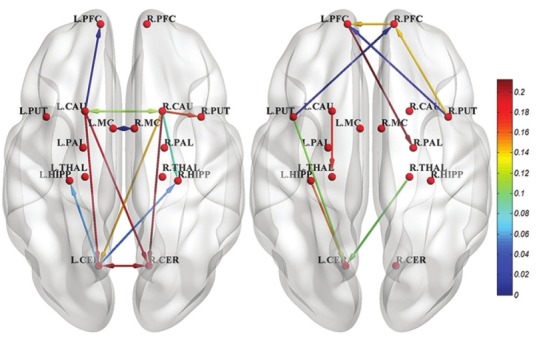
Directed causality network in resting state of normal control (left) and Parkinson's disease (right). Only significant connections are shown
Variations of GC coefficients corresponding to significant connections are shown in Figure 4 for NC (left) and PD (right). In these figures, the width of connection arrow represents standard deviation value of coefficients. As the variations in NC group show standard deviation, significant symmetric connections is less than asymmetric ones.
Figure 4.
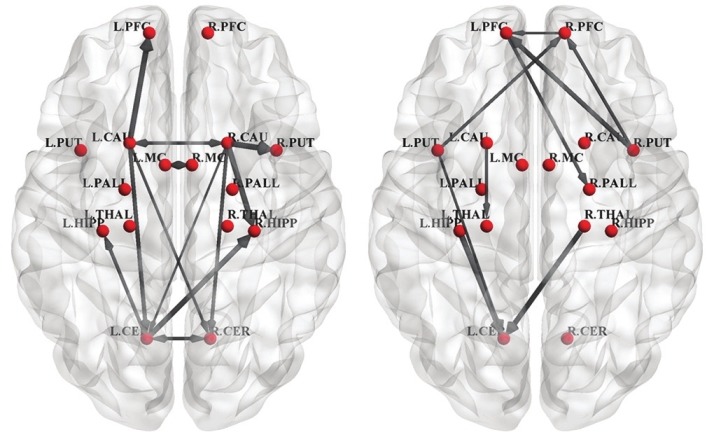
Variations of GC coefficients corresponding to significant connections of normal control (left) and Parkinson's disease (right). Only significant connections are shown. The width of connection arrow represents standard deviation value of coefficients
Moreover, the combination of GC coefficients [Figure 3] and those variations [Figure 4] is illustrated as error-bar plot (mean ± SD) in Figure 5.
Figure 5.
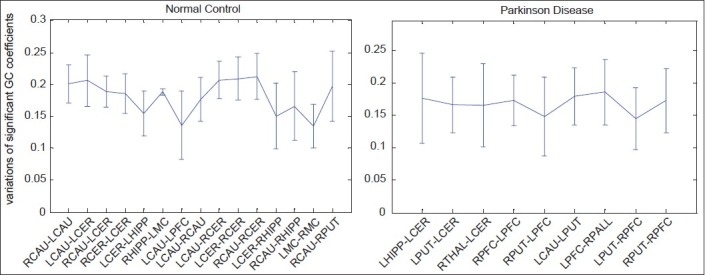
Variations of GC coefficients corresponding to significant connections of normal control (left) and Parkinson's disease (right). Error-bar plot, (mean ± SD)
Nodal Degrees
For each ROI, we computed the total degree, in-degree, and out-degree from the directed influence matrix. The group averaged results constructed by a threshold level T are shown in Figure 6 (P < 0.05 and multiple comparison correction). The L-CER and R-CER showed higher levels of out-degree than the other nodes in NC, demonstrating that it exerts a strong causal influence over the other ROIs. Moreover, L-CAU and R-CAU have maximum in-degree values, indicating that these regions are the center of impressibility over the rest of the nodes. The left and right Putamen showed high in-degree values in PD, indicating that these brain regions are more influenced by the other regions in PD. As Figure 6 shows, out-degree and in-degree values for the PD are smaller than NC.
Figure 6.
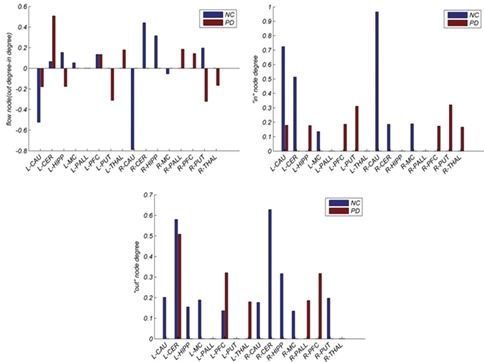
Total degree, in-degree, and out-degree of significant connections of the directed influence brain network are displayed from top to bottom row, respectively. The first blue column is related to the healthy and second to PD
Nodal Clustering Coefficient
The results of the clustering coefficients for directed influence brain network are shown in Figure 7. In NC group, left and right CER, left and right CAU and, R-HIPP show most clustering coefficient values. While in PD, R-PUT and left and right PFC show the highest clustering coefficient values.
Figure 7.
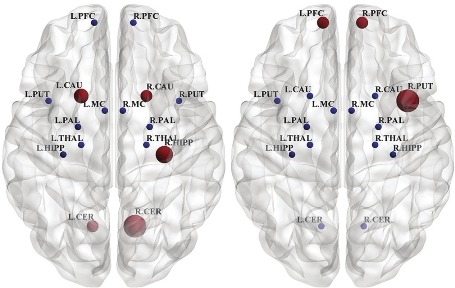
Nodal clustering coefficients of the directed influence brain network in normal control (left) and Parkinson's disease (right). The size of nodes represent nodal clustering coefficient values at the axial view
Modulatory of the Directed Brain Network
The results of modulatory algorithm show that the directed brain networks of PD and NC are divided into 3 modules [Figure 8]. Module I of NC is shown with green in figure including 6 symmetric regions such as left and right PALL, left and right HIPP, and left and right CER. This module has changed in PD, especially the rule of PALL, and it moves to module II. Module II and III are shown with blue and red respectively; both of them are also changed in PD.
Figure 8.
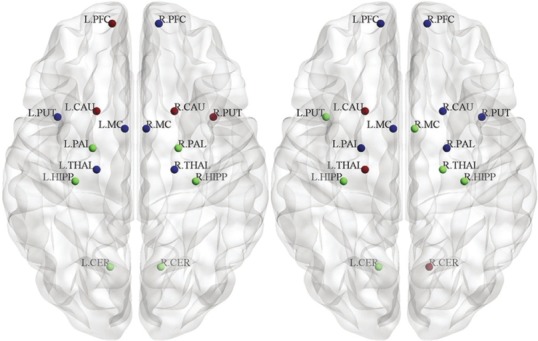
Modularity of the directed influence brain network. Three module in normal control (left) and Parkinson's disease (right). Regions that are placed at their respective centroids are marked by using different colored spheres at the axial view
Betweenness Centrality of the Directed Brain Network
Based on betweenness centrality, we identified the consistent hubs that passed threshold levels. They include L-CAU, L-CER, and L-PUT in the healthy [Figure 9]. Furthermore, the hubs in PD patients include L-PFC and R-PFC.
Figure 9.
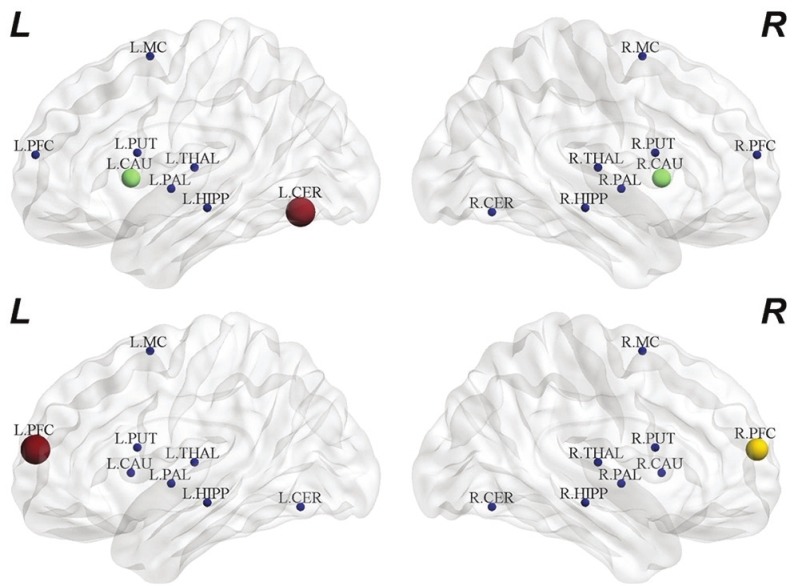
The hubs identified based on betweenness centrality in normal control (top) and Parkinson's disease (bottom)
DISCUSSION
In recent years, some rs-fMRI studies have revealed the causal influence among brain regions in the DMN[50,51,52] or among the RSNs,[49] but only few studies have investigated the changes of causal influence in especial condition or in disorders.[15] On the other hand, the variety of studies investigating the effect of PD on directional connectivity was recorded under different conditions, e.g., during motor tasks while our data set is related to PD on resting condition. However, prior to us, Wu et al. also performed GCA to investigate pattern of basal ganglia network in PD in movement and in resting state.[53] They identified the brain regions where activities follow or predict activations in the Substantia Nigra and showed that causal connections were abnormal in PD.
In Granger concept,[17,35] it has been known that if two signals are influenced by a third one, which is not included in the regression model, this leads to erroneous causal quality. Thus, in the present study, an extension to the multivariate case was used. MGCA is based on an expansion of the autoregressive model to a general multivariate case including all measured variables.[38]
In current study, we focused on directed influence brain network based on multivariate (conditional) Granger Causality (MGCA) at regional level from rs-fMRI data in Parkinson patients. We consider all the regions involved in the movement and regard the directed causality network as a small-world topology.
Previous studies[2,54] found that the brain network has a small-world connectivity structure with topological properties. Liao et al.[16] demonstrated that it would also be true for the graph derived by the directed network. They showed that topological properties of the graph theory are the characteristics of directed influence networks of the human brain network. Disruption of these networks is responsible for several specific neurological disorders of the brain.[55] In this study, we used this concept and examined the architecture of the directed brain network at rest using GCA and graph theory.
The group mean and standard deviation of causality coefficients matrix extracted by MGCA across the group of NC and PD were 0.122 ± 0.18 and 0.089 ± 0.11, respectively. This result shows that there was no significant difference between two groups (P = 0.630, two-sample t-test). It also demonstrates that the strenght of causality interactions decrease in PD. Previous study reveals decreased connectivity from the substantia nigra to the corresponding brain regions in PD patients as compared to healthy controls.
The directed brain network constructed using significant connections in each group suggested that there are positive pair-wise cross relevancies between caudate and cerebellum in the left and right hemispheres in equilibrium manner as in the control group [Figure 3 left]. We found weaker causal connectivity between CER and CAU with their local regions in patients with PD as compared to controls. These results propose the effect of abnormal signals from and to the motor network. Due to the significant role of CER in motor control and cognition, decrease of CER connectivity could account for the clinical problems in PD.[28] These disrupted connections indicate a lack of readiness for movement and might be responsible for difficulty in initiating movements.
Furthermore, motor cortex and caudate have reciprocal connections in left and right hemispheres, while these symmetric connections are disorganized in PD network [Figure 3]. Disruption of this local network in PD demonstrates the disturbance of the interactions of motor networks in resting state of PD patients. Alteration of directional connectivity among networks are related to motor preparation and initiation rather than to motor execution in PD.
One of the primary purpose of this study was to investigate the application of graph theoretical measures to evaluate human brain causality networks and to compare and quantify the results between NC and PD. Graph analysis provides a way of looking at human brain architecture to reach out to more systematic approaches that focus on regions of interest.[1]
With reference to direct information flow, some brain regions were characterized by pivotal regions, which influenced or were influenced more by the other brain regions. The L-CER and R-CER show higher levels of out-degree than the other nodes in NC, demonstrating that it exerts a strong causal influence over other ROIs. The left and right caudate had maximum in-degree values in NC, explaining that these regions are the center of impressibility among other nodes. Furthermore, left and right Putamen showed high in-degree values in PD, indicating that these brain regions are more influenced by the other regions in PD. In general, flow of information was smaller in PD than in NC [Figure 6]. These findings suggest alteration of the functional arrangement of the brain in the resting state, which affects the information organization from and to the other brain regions related to both primary dysfunction and higher-level cognition impairment in PD.
Considering topological properties, R-CER in NC and R-PUT in PD show the highest clustering coefficient values. High clustering allows adjusted information processing, which is functionally segregated from one area to another. The main function of the putamen is to regulate movements and influence various types of learning. It employs dopamine to perform its functions. Because the PUT plays a critical role in motor execution, it increases its connectivities compared to control group to compensate for the depletion of dopamine. This is likely a crucial reason for motor deficits in PD.
Modularity is an important topological characteristic of complex networks; therefore, identification of modularity can help us reveal the topological properties of human brain networks.[1] Modular structure in the brain system recognize subset of anatomically and/or functionally integrated nodes that manage specific biological functions. Recently, many studies have proposed that human brain networks have similar modular structures.[45,56] They have recognized that principle modules are related to the different primary brain functions. In our analysis, we found three different modules which were mostly symmetric ROIs in two hemispheres in NC [Figure 8], while, in patients, only HIPP and PFC had similar modules in two hemispheres.
Betweenness centrality recognize region, which plays a key role in the integration of information in the complex processes. A node with high value of information flow reflects its functional importance and proves to identify betweenness centrality within the directed influence brain network. For instance, L-CER, L-CAU, and R-CAU, which have high in-degree values in NC are detected as betweenness centrality node in NC [Figure 9]. In addition, L-PFC and R-PFC with high out-degree in PD are also recognized as betweenness centrality nodes.
In implementation details of multivariate G-causality method, for each pair-ROI connection in MVAR model, other measured signals of all ROIs are also included. Therefore, the result of MVAR depends on not only the causal influence level between the two time series but also on the other variables included in the model. Structural constraints typically make presumptions about the causal connectivity patterns embedded in the data. At this point, we limited our study to regions that were involved in movement, if all brain areas had been included, the conditional Granger causality measures might have led to different outcome.
G-causality cannot recognize whether or not the causal connection between two regions is direct or indirect via other region (s). Thus, this study is not sufficient to discover a complete model of the changes in influence interaction in PD. Understanding structural and anatomical connectivity using diffusion tensor imaging can help us to improve our causality network.
In this work, results have profound implications for understanding the topological mechanisms underlying the directed influence network in the human brain in the healthy control and PD. One possible interpretation of the small-world topology characteristics is that they might reflect an optimal minimized architecture of the directed influence brain network in which the information is processed by a highly interconnected network of regions and efficiently transferred between them.[16] Therefore, topological properties can provide reliable and robust markers for identifying dysfunctional brain architecture. Clearly, further work is needed to explore these aspects that would provide more insights into the interpretation of the directed network results and in clarifying key points in pathophysiological disorders.
ACKNOWLEDGMENT
The authors would like to thank Dr. Mojtaba Zarei from fMRIB center at Oxford University for kindly providing the dataset.
Footnotes
Source of Support: Nil
Conflict of Interest: None declared
REFERENCES
- 1.Bullmore E, Sporns O. Complex brain networks: Graph theoretical analysis of structural and functional systems. Nat Rev Neurosci. 2009;10:186–98. doi: 10.1038/nrn2575. [DOI] [PubMed] [Google Scholar]
- 2.Sporns O, Chialvo DR, Kaiser M, Hilgetag CC. Organization, development and function of complex brain networks. Trends Cogn Sci. 2004;8:418–25. doi: 10.1016/j.tics.2004.07.008. [DOI] [PubMed] [Google Scholar]
- 3.Van den Heuvel MP, Hulshoff Pol HE. Exploring the brain network: A review on resting-state fMRI functional connectivity. Eur Neuropsychopharmacol. 2010;20:519–34. doi: 10.1016/j.euroneuro.2010.03.008. [DOI] [PubMed] [Google Scholar]
- 4.Wang J, Zuo XN, He Y. Graph-based network analysis of resting-state functional MRI. Front Syst Neurosci. 2010;4:16. doi: 10.3389/fnsys.2010.00016. [DOI] [PMC free article] [PubMed] [Google Scholar]
- 5.Stam CJ, Reijneveld JC. Graph theoretical analysis of complex networks in the brain. Nonlinear Biomed Phys. 2007;1:3. doi: 10.1186/1753-4631-1-3. [DOI] [PMC free article] [PubMed] [Google Scholar]
- 6.Aertsen AM, Gerstein GL, Habib MK, Palm G. Dynamics of neuronal firing correlation: Modulation of effective connectivity. J Neurophysiol. 1989;61:900–17. doi: 10.1152/jn.1989.61.5.900. [DOI] [PubMed] [Google Scholar]
- 7.Biswal B, Yetkin FZ, Haughton VM, Hyde JS. Functional connectivity in the motor cortex of resting human brain using echo-planar MRI. Magn Reson Med. 1995;34:537–41. doi: 10.1002/mrm.1910340409. [DOI] [PubMed] [Google Scholar]
- 8.Friston KJ, Frith CD, Liddle PF, Frackowiak RS. Functional connectivity: The principal-component analysis of large (PET) data sets. J Cereb Blood Flow Metab. 1993;13:5–14. doi: 10.1038/jcbfm.1993.4. [DOI] [PubMed] [Google Scholar]
- 9.Cordes D, Haughton V, Arfanakis K, Carew JD, Turski PA, Moritz CH, et al. Frequencies contributing to functional connectivity in the cerebral cortex in resting-state data. AJNR Am J Neuroradiol. 2001;22:1326–33. [PMC free article] [PubMed] [Google Scholar]
- 10.Hampson M, Peterson BS, Skudlarski P, Gatenby JC, Gore JC. Detection of functional connectivity using temporal correlations in MR images. Hum Brain Mapp. 2002;15:247–62. doi: 10.1002/hbm.10022. [DOI] [PMC free article] [PubMed] [Google Scholar]
- 11.Xiong J, Parsons LM, Gao JH, Fox PT. Interregional connectivity to primary motor cortex revealed using MRI resting state images. Hum Brain Mapp. 1999;8:151–6. doi: 10.1002/(SICI)1097-0193(1999)8:2/3<151::AID-HBM13>3.0.CO;2-5. [DOI] [PMC free article] [PubMed] [Google Scholar]
- 12.Friston KJ. Functional and effective connectivity in neuroimaging: A synthesis. Hum Brain Mapp. 1994;2:56–78. [Google Scholar]
- 13.Kaas A, Weigelt S, Roebroeck A, Kohler A, Muckli L. Imagery of a moving object: The role of occipital cortex and human MT/V5+ Neuroimage. 2010;49:794–804. doi: 10.1016/j.neuroimage.2009.07.055. [DOI] [PubMed] [Google Scholar]
- 14.Sato JR, Junior EA, Takahashi DY, Maria DE, Felix M, Brammer MJ, et al. A method to produce evolving functional connectivity maps during the course of an fMRI experiment using wavelet-based timevarying Granger causality. Neuroimage. 2006;31:187–96. doi: 10.1016/j.neuroimage.2005.11.039. [DOI] [PubMed] [Google Scholar]
- 15.Stevens MC, Pearlson GD, Calhoun VD. Changes in the interaction of resting-state neural networks from adolescence to adulthood. Hum Brain Mapp. 2009;30:2356–66. doi: 10.1002/hbm.20673. [DOI] [PMC free article] [PubMed] [Google Scholar]
- 16.Liao W, Ding J, Marinazzo D, Xu Q, Wang Z, Yuan C, et al. Small-world directed networks in the human brain: Multivariate Granger causality analysis of resting-state fMRI. Neuroimage. 2011;54:2683–94. doi: 10.1016/j.neuroimage.2010.11.007. [DOI] [PubMed] [Google Scholar]
- 17.Granger C. Investigating causal relations by econometric models and cross-spectral methods. Econometrica. 1969;37:424–38. [Google Scholar]
- 18.Gao Q, Chen H, Gong Q. Evaluation of the effective connectivity of the dominant primary motor cortex during bimanual movement using Granger causality. Neurosci Lett. 2008;443:1–6. doi: 10.1016/j.neulet.2008.07.036. [DOI] [PubMed] [Google Scholar]
- 19.Seth AK. Causal connectivity of evolved neural networks during behavior. Network. 2005;16:35–54. doi: 10.1080/09548980500238756. [DOI] [PubMed] [Google Scholar]
- 20.Zhou Z, Chen Y, Ding M, Wright P, Lu Z, Liu Y. Analyzing brain networks with PCA and conditional Granger causality. Hum Brain Mapp. 2009;30:2197–206. doi: 10.1002/hbm.20661. [DOI] [PMC free article] [PubMed] [Google Scholar]
- 21.Hemmelmann D, Ungureanu M, Hesse W, Wüstenberg T, Reichenbach JR, Witte OW, et al. Modelling and analysis of time-variant directed interrelations between brain regions based on BOLD-signals. Neuroimage. 2009;45:722–37. doi: 10.1016/j.neuroimage.2008.12.065. [DOI] [PubMed] [Google Scholar]
- 22.Kaminski M, Ding M, Truccolo WA, Bressler S. Evaluating causal relations in neural systems: Granger causality, directed transfer function and statistical assessment of significance. Biol Cybern. 2001;85:145–57. doi: 10.1007/s004220000235. [DOI] [PubMed] [Google Scholar]
- 23.Fox MD, Raichle ME. Amplitude of fluctuations in brain activity observed with functional magnetic resonance imaging. Nat Rev Neurosci. 2007;8:700–11. doi: 10.1038/nrn2201. [DOI] [PubMed] [Google Scholar]
- 24.Wang J, Wang L, Zang Y, Yang H, Tang H, Gong Q, et al. Parcellation-dependent small-world brain functional networks: A resting-state fMRI study. Hum Brain Mapp. 2009;30:1511–23. doi: 10.1002/hbm.20623. [DOI] [PMC free article] [PubMed] [Google Scholar]
- 25.Hayasaka S, Laurienti PJ. Comparison of characteristics between region- and voxel-based network analyses in resting-state fMRI data. Neuroimage. 2010;50:499–508. doi: 10.1016/j.neuroimage.2009.12.051. [DOI] [PMC free article] [PubMed] [Google Scholar]
- 26.Galvan A, Wichmann T. Pathophysiology of Parkinsonism. Clin Neurophysiol. 2008;119:1459–74. doi: 10.1016/j.clinph.2008.03.017. [DOI] [PMC free article] [PubMed] [Google Scholar]
- 27.Jankovic J. Parkinson's disease: Clinical features and diagnosis. J Neurol Neurosurg Psychiatry. 2008;79:368–76. doi: 10.1136/jnnp.2007.131045. [DOI] [PubMed] [Google Scholar]
- 28.Helmich RC, Derikx LC, Bakker M, Scheeringa R, Bloem BR, Toni I. Spatial remapping of cortico-striatal connectivity in Parkinson's disease. Cereb Cortex. 2010;20:1175–86. doi: 10.1093/cercor/bhp178. [DOI] [PubMed] [Google Scholar]
- 29.Wu T, Wang L, Hallett M, Chen Y, Li K, Chan P. Effective connectivity of brain networks during self-initiated movement in Parkinson's disease. Neuroimage. 2011;55:204–15. doi: 10.1016/j.neuroimage.2010.11.074. [DOI] [PubMed] [Google Scholar]
- 30.Baudrexel S, Witte T, Seifried C, Von Wegner F, Beissner F, Klein JC, et al. Resting state fMRI reveals increased subthalamic nucleus-motor cortex connectivity in Parkinson's disease. Neuroimage. 2011;55:1728–38. doi: 10.1016/j.neuroimage.2011.01.017. [DOI] [PubMed] [Google Scholar]
- 31.Wu T, Wang L, Chen Y, Zhao C, Li K, Chan P. Changes of functional connectivity of the motor network in the resting state in Parkinson's disease. Neurosci Lett. 2009;460:6–10. doi: 10.1016/j.neulet.2009.05.046. [DOI] [PubMed] [Google Scholar]
- 32.Skidmore F, Korenkevych D, Liua Y, He G, Bullmore E, Pardalos PM. Connectivity brain networks based on wavelet correlation analysis in Parkinson fMRI data. Neurosci Lett. 2011;499:47–51. doi: 10.1016/j.neulet.2011.05.030. [DOI] [PubMed] [Google Scholar]
- 33.Palmer SJ, Eigenramm L, Hoque T, Mccaig RG, Troiano A, Mckeown MJ. Levodopa-sensitive, dynamic change in effective connectivity during simultaneous movements in Parkinson's disease. Neuroscience. 2009;158:693–704. doi: 10.1016/j.neuroscience.2008.06.053. [DOI] [PubMed] [Google Scholar]
- 34.Wiener N. The theory of prediction. In: Beckenbach EF, editor. Modern Mathematics for Engineers. New York: McGraw-Hill; 1956. [Google Scholar]
- 35.Seth A. Granger causality. Scholarpedia. 2007;2:1667. [Google Scholar]
- 36.Geweke J. Measurement of linear dependence and feedback between multiple time series. J Am Stat Assoc. 1982;77:304–13. [Google Scholar]
- 37.Geweke J. Measurement of linear dependence and feedback between multiple time series. J Am Stat Assoc. 1984;79:907–15. [Google Scholar]
- 38.Seth AK. A MATLAB toolbox for Granger causal connectivity analysis. J Neurosci Methods. 2010;186:262–73. doi: 10.1016/j.jneumeth.2009.11.020. [DOI] [PubMed] [Google Scholar]
- 39.Akaike H. A new look at the statistical model identification. IEEE T Automat Contr. 1974;19:716–23. [Google Scholar]
- 40.Schwartz G. Estimating the dimension of a model. Ann Stat. 1978;5:461–4. [Google Scholar]
- 41.Rubinov M, Sporns O. Complex network measures of brain connectivity: Uses and interpretations. Neuroimage. 2010;52:1059–69. doi: 10.1016/j.neuroimage.2009.10.003. [DOI] [PubMed] [Google Scholar]
- 42.Boccaletti S, Latora V, Moreno Y, Chavez M, Hwang DU. Complex networks: Structure and dynamics. Phys Rep. 2006;424:175–308. [Google Scholar]
- 43.Bassett DS, Bullmore ET. Small-world brain networks. Neuroscientist. 2006;12:512–23. doi: 10.1177/1073858406293182. [DOI] [PubMed] [Google Scholar]
- 44.Fagiolo G. Clustering in complex directed networks. Phys Rev E Stat Nonlin Soft Matter Phys. 2007;76:026107. doi: 10.1103/PhysRevE.76.026107. [DOI] [PubMed] [Google Scholar]
- 45.Leicht EA, Newman ME. Community structure in directed networks. Phys Rev Lett. 2008;100:118703. doi: 10.1103/PhysRevLett.100.118703. [DOI] [PubMed] [Google Scholar]
- 46.He Y, Wang J, Wang L, Chen ZJ, Yan C, Yang H, et al. Uncovering intrinsic modular organization of spontaneous brain activity in humans. PLoS One. 2009;4:e5226. doi: 10.1371/journal.pone.0005226. [DOI] [PMC free article] [PubMed] [Google Scholar]
- 47.Fox MD, Snyder AZ, Vincent JL, Corbetta M, Van Essen DC, Raichle ME. The human brain is intrinsically organized into dynamic, anticorrelated functional networks. Proc Natl Acad Sci U S A. 2005;102:9673–8. doi: 10.1073/pnas.0504136102. [DOI] [PMC free article] [PubMed] [Google Scholar]
- 48.Beall EB, Lowe MJ. Isolating physiologic noise sources with independently determined spatial measures. Neuroimage. 2007;37:1286–300. doi: 10.1016/j.neuroimage.2007.07.004. [DOI] [PubMed] [Google Scholar]
- 49.Liao W, Mantini D, Zhang Z, Pan Z, Ding J, Gong G, et al. Evaluating the effective connectivity of resting state networks using conditional Granger causality. Biol Cybern. 2010;102:57–69. doi: 10.1007/s00422-009-0350-5. [DOI] [PubMed] [Google Scholar]
- 50.Jiao Q, Lu G, Zhang Z, Zhong Y, Wang Z, Guo Y, et al. Granger causal influence predicts BOLD activity levels in the default mode network. Hum Brain Mapp. 2010;32:154–61. doi: 10.1002/hbm.21065. [DOI] [PMC free article] [PubMed] [Google Scholar]
- 51.Sridharan D, Levitin DJ, Menon V. A critical role for the right fronto-insular cortex in switching between central-executive and default-mode networks. Proc Natl Acad Sci U S A. 2008;105:12569–74. doi: 10.1073/pnas.0800005105. [DOI] [PMC free article] [PubMed] [Google Scholar]
- 52.Uddin LQ, Kelly AM, Biswal BB, Castellanos FX, Milham MP. Functional connectivity of default mode network components: Correlation, anticorrelation, and causality. Hum Brain Mapp. 2009;30:625–37. doi: 10.1002/hbm.20531. [DOI] [PMC free article] [PubMed] [Google Scholar]
- 53.Wu T, Wang J, Wang C, Hallett M, Zang Y, Wu X, et al. Basal ganglia circuits changes in Parkinson's disease patients. Neurosci Lett. 2012;524:55–9. doi: 10.1016/j.neulet.2012.07.012. [DOI] [PMC free article] [PubMed] [Google Scholar]
- 54.Sporns O, Honey CJ. Small worlds inside big brains. Proc Natl Acad Sci U S A. 2006;103:19219–20. doi: 10.1073/pnas.0609523103. [DOI] [PMC free article] [PubMed] [Google Scholar]
- 55.Uhlhaas PJ, Singer W. Neuronal dynamics and neuropsychiatric disorders: Toward a translational paradigm for dysfunctional large-scale networks. Neuron. 2012;75:963–80. doi: 10.1016/j.neuron.2012.09.004. [DOI] [PubMed] [Google Scholar]
- 56.Meunier D, Lambiotte R, Fornito A, Ersche KD, Bullmore ET. Hierarchical modularity in human brain functional networks. Front Neuroinform. 2009;3:37. doi: 10.3389/neuro.11.037.2009. [DOI] [PMC free article] [PubMed] [Google Scholar]


