Abstract
The mammalian placenta is remarkably distinct between species, suggesting a history of rapid evolutionary diversification1. To gain insight into the molecular drivers of placental evolution, we compared biochemically predicted enhancers between mouse and rat trophoblast stem cells (TSCs) and find that species-specific enhancers are highly enriched for endogenous retroviruses (ERVs) on a genome-wide level. One of these ERV families, RLTR13D5, contributes hundreds of mouse-specific H3K4me1/H3K27ac-defined enhancers that functionally bind Cdx2, Eomes, and Elf5 - core factors that define the TSC regulatory network. Furthermore, we demonstrate that RLTR13D5 is capable of driving gene expression in rat placental cells. Comparison with other tissues revealed that species-specific ERV enhancer activity is generally restricted to hypomethylated tissues, suggesting that tissues permissive to ERV activity gain access to an otherwise silenced source of regulatory variation. Overall, our results implicate ERV enhancer cooption as a mechanism underlying the striking evolutionary diversification of placental development.
During pregnancy, maternal-fetal physiological exchange is mediated by the placenta, an organ that emerged in mammals 150 mya. Though the placenta performs the same basic function in all mammals, striking interspecies differences exist in overall structure, organization of tissue layers, and trophoblast cell types1. The dramatic evolutionary diversification of the placenta is thought to be driven in part by parent-offspring conflict, where disagreement over optimal parental investment leads to antagonistic coevolution at the placental interface2-4. Evidence suggests that regulatory mutations may underlie the morphological diversification of the placenta, as the development of the placenta is governed by highly conserved proteins5,6. Although many placental-specific proteins are rapidly evolving, these are primarily hormones and growth factors secreted during the later physiological response to pregnancy and are not expressed during placenta development7-9. Overall, this suggests that that regulatory mutations—rather than protein-coding mutations—may form the basis for placental morphological evolution.
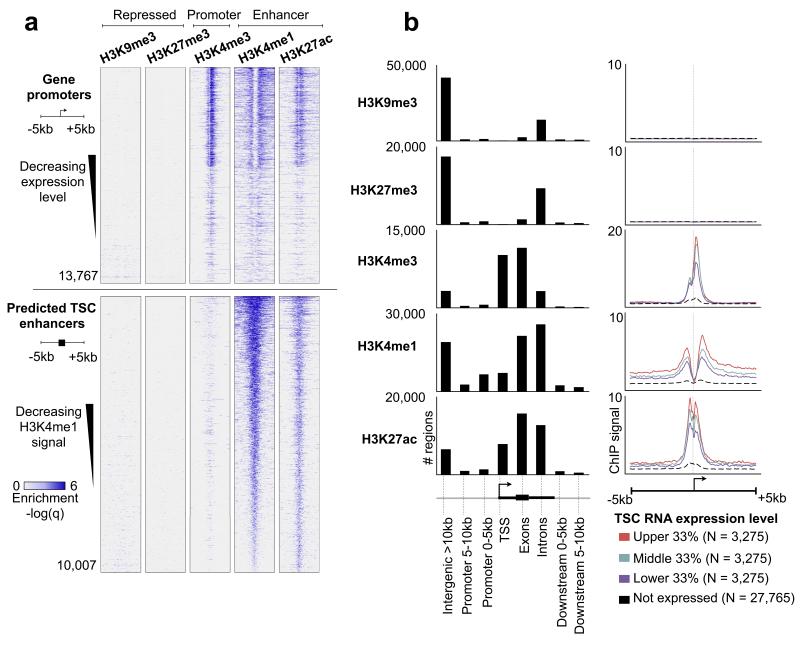
As mounting evidence has implicated regulatory mutations as a general mechanism underlying developmental diversification10, we sought to investigate the regulatory landscape of early placental development in two closely related species - mouse and rat. Despite the similarities between mouse and rat placentation, genes expressed by the mature placenta show clear signs of rapid evolution since rodents diverged9, suggesting that evolution at the regulatory level may also be detected. We cultured mouse and rat trophoblast stem cells (TSCs), which represent the first cell population to give rise to the fetal placenta11, and performed 3′ RNA-Seq12 and ChIP-Seq against histone marks indicative of promoters (H3K4me3), enhancers (H3K4me1 and H3K27ac), and repressed regions (H3K27me3 and H3K9me3)13. Only high quality uniquely mapping reads were retained, and histone marked regions were identified using MACS (v2.09) with an FDR < 0.05. We predicted 9,460 mouse and 7,932 rat TSC promoters based on H3K4me3 enrichment over gene transcriptional start sites (TSS), which were associated with expressed genes (Fig. 1a, b). We predicted 52,476 mouse and 41,142 rat TSC enhancers based on distal enrichment of H3K4me1 (>5 kb from a gene TSS), and 25,736 mouse and 4,471 rat regions of distal H3K27ac enrichment. These predicted enhancers are significantly enriched near genes with annotated placental function (Fig. S1). Repressive marks H3K9me3 and H3K27me3 were predominantly intergenic, consistent with their association with inactive chromatin (Fig. 1b). Notably, we did not observe H3K27me3 at promoters in either species (Fig. 1a,b, Fig. S2a,b), suggesting that H3K27me3 does not associate with silenced promoters within the placenta. These observations are consistent with a previous study14 and, together, strongly suggest that Polycomb activity in TSCs is distinct from its role in embryonic stem cells (ESCs), and that trophoblast-specific mechanisms of gene repression are likely to be conserved across rodents.
Figure 1. The epigenetic landscape of mouse TSCs using histone ChIP-Seq.
(a) Top five panels: heatmap representation of histone ChIP-Seq enrichment across gene promoters. Each row represents a 10 kb window centered at the gene TSS and extending 5 kb upstream and 5 kb downstream (see cartoon left side). Genes are sorted by decreasing expression levels. Lower five panels are the same histone marks, centered around predicted enhancers (defined as regions co-enriched for H3K27ac + H3K4me1 and located >5 kb away from a gene TSS), and sorted by decreasing average H3K4me1 enrichment across the window. (b) Left panel: distribution of histone marks within genomic elements, including gene TSS, exons, introns, promoters (0-5 or 5-10 kb away from TSS), and intergenic regions (>10 kb away from TSS). The Y axis represents the total number of marks present in each category. Right panel: averaged ChIP-Seq enrichment profile across a 10 kb window centered on the gene TSS. Genes are grouped into 4 categories: high expression (red), medium expression (green), low expression (blue), and nondetectable expression (black dashed). The Y axis represents the average ChIP-Seq enrichment (q value).
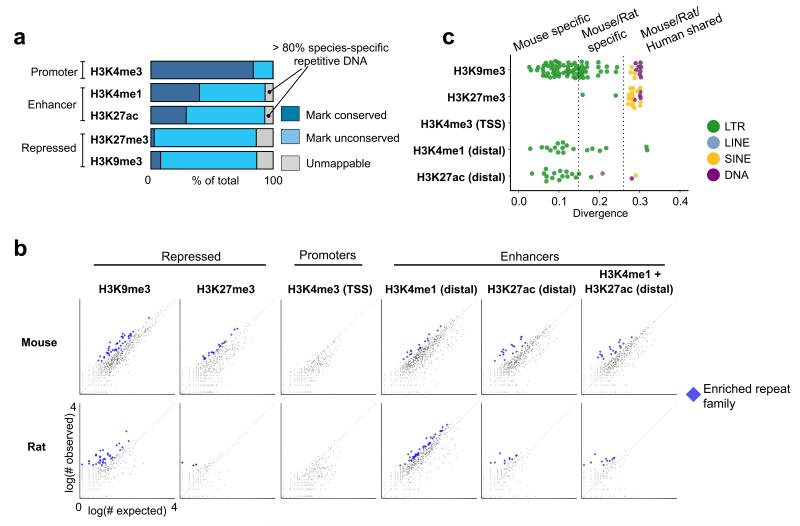
If regulatory mutations drive morphological differences between mouse and rat, then identifying species-specific regulatory elements might reveal genomic regions that underlie novel adaptations. To this end, we compared the regulatory landscape between these species by mapping each regulatory element from rat to its orthologous position in the mouse genome, and then examined whether the chromatin state at each region was epigenetically conserved (Fig. 2a). We found that, although the majority of promoter regions are conserved between mouse and rat, both enhancer and repressed regions are predominantly species-specific. Interestingly, 8-10% of species-specific enhancers could not be mapped to the other genome. We found that over 80% of these unmappable enhancers directly overlap species-specific transposable elements (TEs). TEs have been established as important mediators of regulatory evolution due to their intrinsic regulatory activity15, and species-specific TEs constitute the majority of genomic DNA unique to mouse or rat16. Taken together, these analyses indicate that the TSC regulatory landscape has undergone substantial evolution since the divergence of rodents, and pinpoint TEs as being a significant source of this variation.
Figure 2. Comparison between mouse and rat reveals over abundance of species specific ERVs in enhancer regions.
(a) Rat TSC ChIP-Seq defined regulatory elements were mapped to their orthologous position in the mouse genome. If the same histone mark was present in mouse, then the element was considered epigenetically conserved. For unconserved elements, we further distinguished whether the genomic DNA was mappable to the other genome, or derived from species-specific sequence. Each category is represented as a fraction of the total number of elements in the ChIP-Seq dataset (dark blue: rat-mouse conserved elements, light blue: unconserved regions gray: unmappable elements). In both species, the unmappable regions were predominantly composed of species-specific TEs. (b) We deduced whether the frequency of any type of TE was enriched within each class of regulatory element. Each point represents a single TE family, composed of up to several thousand copies genome-wide. For each family, the number of individual copies observed residing within a set of regulatory elements (Y axis) is plot against a random expectation (X axis). Significantly overrepresented families are indicated in blue. (c) Overrepresented mouse TE families from (b) are plot against the average nucleotide divergence of their individual copies versus the consensus sequence, which is a proxy for the evolutionary age of the TE. Each point is colored based on the class of TE. Divergence measurements representing the distance between mouse/rat and mouse/human are depicted by dotted lines. ERVs: endogenous retroviruses; TE: transposable elements.
As TEs have been implicated in the regulatory evolution of other systems17, we next investigated whether specific families of TEs have contributed to rapid evolutionary amplifications of enhancers, promoters, or repressed regions within TSCs. Therefore, we identified TEs whose individual copies were significantly overrepresented within each set of regulatory elements, using a conservative binomial test to compare the observed overlap against a background expectation (Methods) (Fig. 2b, Tables S1-S13). In repressed regions, we found an enrichment of species-specific endogenous retroviruses (ERVs) within H3K9me3 regions and ancestral LINE1s within H3K27me3 regions, suggesting distinct epigenetic strategies for silencing different classes of TEs. In promoters, marked by H3K4me3, we found no enrichment of TEs, consistent with the high overall conservation of promoters observed between mouse and rat. Surprisingly, we found multiple species-specific ERVs enriched in both mouse and rat TSC enhancer regions (marked by both H3K4me1 and H3K27ac or either/or; see above) (Fig. 2c, Fig. S3). These observations suggest that the amplification of specific TE families may have shaped enhancer activity during placental evolution.
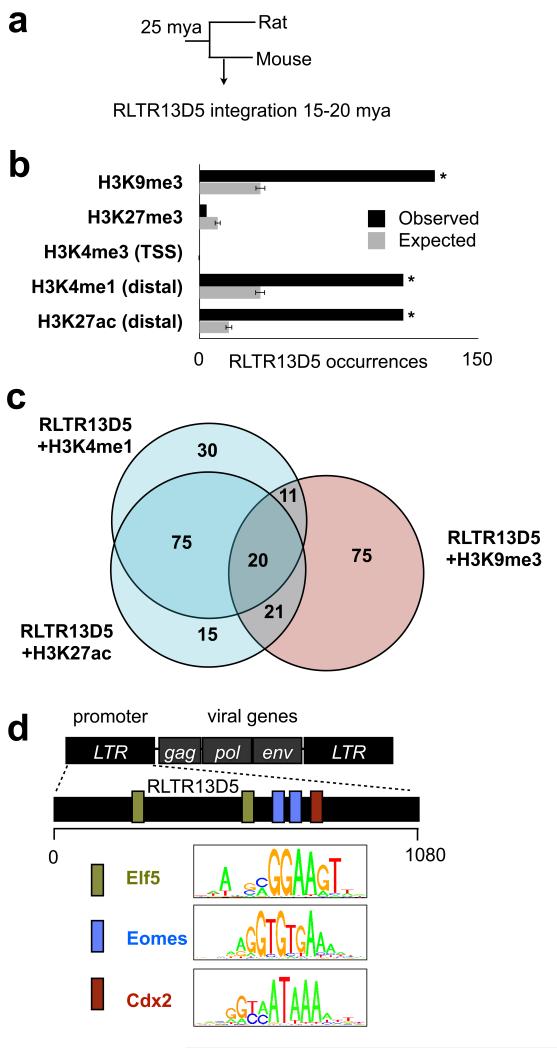
The enrichment of species-specific ERV families within predicted TSC enhancer regions prompted us to investigate ERVs as potential drivers of placenta regulatory evolution. For this analysis, we selected one mouse-specific ERV, RLTR13D5, which is highly enriched within mouse TSC enhancer regions defined by both H3K4me1 and H3K27ac. RLTR13D5 is present in 608 copies that exhibit ~91% sequence identity to their consensus sequence, indicating that it likely integrated 15-25 mya but is no longer actively replicating (Fig. 3a). Of these 608 copies, 95 exhibit enrichment of both H3K4me1 and H3K27ac in the absence of H3K9me3, compared to < 20 expected by chance (Fig. 3b,c). The strong association between RLTR13D5 copies and enhancer marks prompted us to ask whether the RLTR13D5 consensus sequence harbored transcription factor binding motifs that might drive enhancer function. Strikingly, statistically significant binding sites were predicted for Eomes, Cdx2, and Elf5 (Fig. 3d), which together are known to define the core TSC regulatory network18-20. Furthermore, although individual RLTR13D5 copies exhibit 9% nucleotide divergence on average, the majority of copies retain these binding motifs (Fig. S4). These results suggest that RLTR13D5 copies may serve as mouse specific enhancer elements by recruiting the core TSC regulatory machinery.
Figure 3. Mouse-specific ERV RLTR13D5 is highly enriched within placental enhancers.
(a) Phylogenetic tree indicating approximate RLTR13D5 integration time in mouse genome. (b) Examination of all 608 instances of RLTR13D5 shows that this family is highly enriched within the enhancer marks H3K4me1 (Bonferroni P = 4.5 × 10⁻²⁹, binomial test) and H3K27ac (P = 4.2 × 10−57) as well as for the repressive mark H3K9me3 (P = 1.5 × 10−36). This is illustrated in a barplot comparing the observed number of RLTR13D5 copies within a histone modification to the random expectation. The random expectation is displayed as the average over 1000 randomized datasets, and error bars indicate standard deviation. (c) Venn Diagram showing that RLTR13D5 instances containing the H3K4me1 and H3K27ac enhancer marks are distinct from those containing the repressive mark H3K9me3. (d) Diagram of RLTR13D5, whose sequence originally derives from a long terminal repeat (LTR) segment of an ERV. The RLTR13D5 consensus sequence harboring predicted binding sites for Eomes, Cdx2, and Elf5, which are depicted by colored boxes across the 1080 bp-long consensus sequence. Uniprobe motifs used to scan the sequence are shown in the legend.
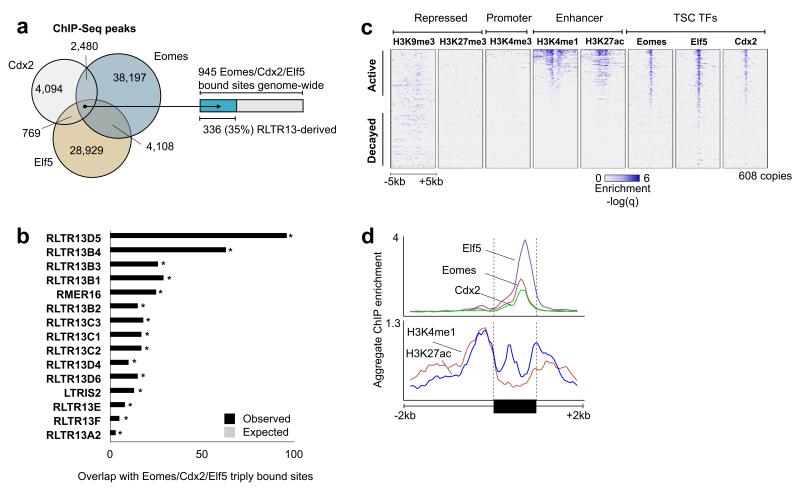
Although the presence of binding motifs is suggestive of function, we next tested whether Eomes, Cdx2, and Elf5 physically associate with RLTR13D5 and other ERVs. To this end, we performed ChIP-Seq with anti-Eomes, anti-Cdx2, and anti-Elf5 antibodies in mouse TSCs, using 100 bp paired-end reads to assist in detecting punctuate binding sites within repetitive regions. We identified thousands of binding sites for Eomes (45,730), Cdx2 (11,451), and Elf5 (34,751), and de novo motif discovery recovered the canonical motifs for each transcription factor (Fig. 3d, 4a). All three transcription factors showed significant association with RLTR13D5 (Fig. 4b). Examination of the transcription factor and histone occupancy across all RLTR13D5 copies revealed strong patterns of co-occupancy at a subset of copies with potential enhancer activity (Fig. 4c), as well as a clear bimodal distribution of H3K4me1 and H3K27ac with all transcription factor binding centered between the histone peaks—a configuration strongly associated with active enhancers (Fig. 4d)21. Notably, 40% (241) of all RLTR13D5 copies were bound by at least 1 transcription factor, and 16% (96) were bound by all three - Eomes, Cdx2, and Elf5. As regions containing multiple transcription factor binding sites are most likely to function as active enhancers22, we next examined how frequently the co-association of all three transcription factors occurred genome-wide and subsequently what portion of these regions derive from ERVs. We found a total of 945 triply bound regions genome-wide, 96 (10%) of which were derived from RLTR13D5. Strikingly, in addition to RLTR13D5, several closely related ERVs including RLTR13B4 and RLTR13C3 were also dramatically enriched at triply bound regions (Fig. 4b). Overall, we find that 35% (336) of all genomic regions triply bound by Eomes, Cdx2, and Elf5 are derived directly from the mouse-specific RLTR13 ERV superfamily, demonstrating a central role in dramatically reshaping the TSC core regulatory network.
Figure 4. Core TSC transcription factors bind RLTR13D5 copies.
(a) Venn diagram representing the genomic overlap between Eomes, Cdx2, and Elf5 ChIP-Seq binding sites. (b) Barplot showing TEs overrepresented within the 945 genomic regions triply bound by Eomes, Cdx2, and Elf5. The top 15 results are shown, where black bars represent the observed overlap and gray represents the random expectation (< 1 in all cases). All TEs displayed are significantly overrepresented (Bonferroni P < 4.1 × 10⁻¹⁸, binomial test). (c) Heatmap representation of all 608 RLTR13D5 copies. Rows represent 10kb windows centered on an individual copy, and the ChIP enrichment signal from each experiment is displayed in each column. Elements are sorted by decreasing average H3K4me1 signal across the 10 kb window. (d) Aggregate ChIP enrichment profiles for transcription factors (top panel) and histones (bottom) across all RLTR13D5 copies, including 2 kb flanking genomic regions. LTR: Long terminal repeat. ERV: endogenous retrovirus.
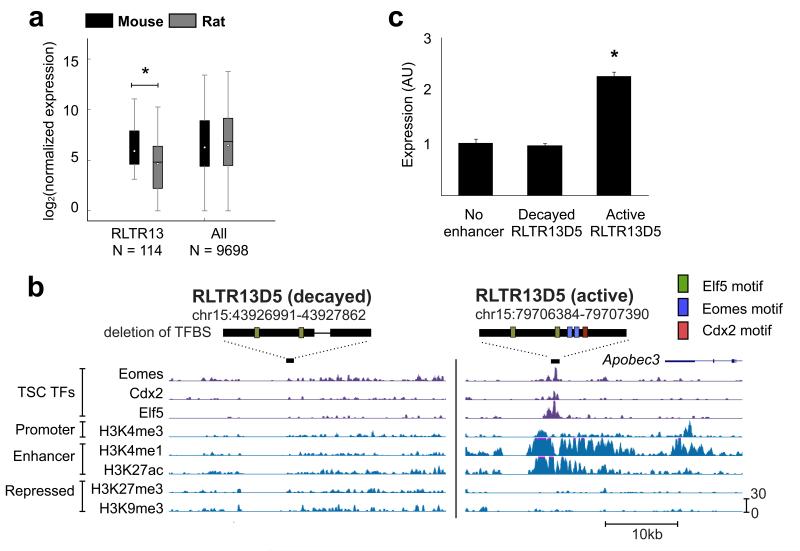
As RLTR13 elements have all the hallmarks of active TSC enhancers, we next investigated whether these elements functionally influence placental gene expression. First, given that RLTR13 is mouse-specific, we asked whether genes proximal to RLTR13-derived enhancers display species-specific patterns of expression. From our 3′ RNA-Seq data, we identified 9,698 orthologous genes that exhibit TSC expression in either rat, mouse, or both. We then determined which of these genes are proximal to the 336 triply bound RLTR13 elements within a range of 100 kb. This yielded 114 genes that collectively exhibit increased expression levels in mouse (P = 0.0036, Wilcoxon signed rank test), consistent with RLTR13 elements enhancing proximal gene expression in a species-specific manner (Fig. 5a). Next, we tested whether RLTR13-derived enhancers could functionally drive gene expression by performing a luciferase assay in Rcho-1 cells23, a readily transfectable rat TSC model with no native RLTR13 elements in its genome. We selected two copies of RLTR13D5 for examination. The first was an ‘active’ copy bound by H3K27ac, H3K4me1, Cdx2, Eomes, and Elf5, and was adjacent to Apoceb3, which is expressed in mouse TSCs but not in rat. The second was a ‘decayed’ copy that harbors a 200 bp deletion that removed binding sites for Eomes, Cdx2, and Elf5 (Fig. 5b). We found the active copy drove a significant 2-fold increase in expression over the minimal promoter, while the decayed copy failed to drive expression (Fig. 5c). Overall, these results demonstrate that RLTR13D5 is capable of driving gene expression in placental cells and provide strong evidence that RLTR13-derived enhancers have facilitated the evolution of mouse-specific gene expression patterns in TSCs.
Figure 5. RLTR13D5 functions to drive trophoblast expression.
(a) Boxplot depicting normalized 3′ RNA-Seq levels for both mouse and rat. Whiskers extend to 1.5 times the inner quartile range. For genes neighboring Eomes/Elf5/Cdx2 triply bound RLTR13 elements within 100 kb, mouse expression levels are higher than in rat (P = 0.0036, Wilcoxon signed rank test). (b) UCSC genome screenshots of the “decayed” and “active” RLTR13D5 copies used in the luciferase assay. Above each screenshot, the element is represented by a black rectangle with predicted binding sites as in Fig. 4a. The decayed copy harbors a deletion represented by the thin black line. (c) Luciferase assay demonstrating reporter activity driven by “active” versus “decayed” RLTR13D5 copies (P = 3.5 × 10⁻⁷, T test). Relative luciferase activity is expressed as the means ± S.D.
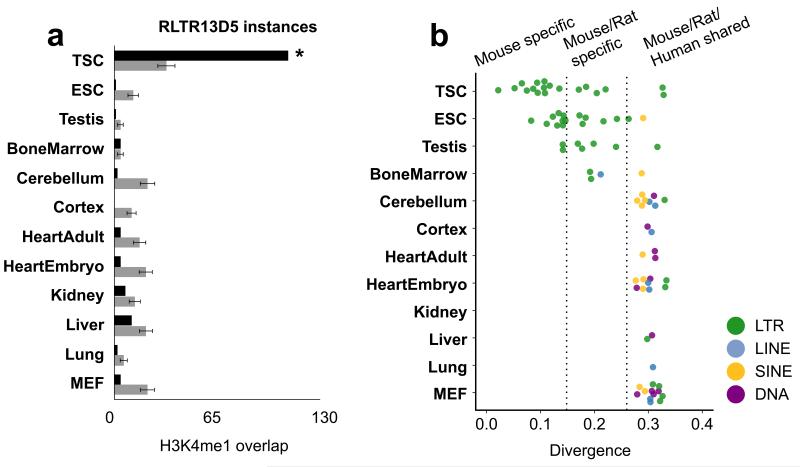
We next asked whether species-specific ERVs might function as enhancer elements in other tissues. Using the mouse ENCODE H3K4me1 datasets24, we identified putative regulatory TEs in 11 non-placental tissues. First, we found RLTR13D5 and the majority of other putative ERV enhancers predicted from our TSC dataset were not enriched within enhancer regions of other tissues, indicating that their activity is restricted to the placenta (Fig. 6a). We next found that while putative regulatory TEs could be identified in most tissues, most of these TEs are ancient (shared between mouse, rat, human) and constitute multiple classes including DNA transposons (Fig. 6b). This is in contrast to TSCs, where the majority of regulatory TEs are species-specific ERVs. Notably, the only other samples exhibiting similar patterns were embryonic stem cells (ESCs), and testes. Intriguingly, placenta, ESCs and testes all feature global DNA hypomethylation and intrinsic ERV activity. This is in stark contrast to the embryo proper which undergoes genome-wide methylation and silences retroviral activity25-27. Overall, this suggests a correlation between a permissive epigenetic state and the ability of ERVs to escape repression. This escape from repression within these few cellular contexts, most notably the placenta, may allow for ERVs to function as active enhancers, potentially altering the development of these tissues.
Figure 6. RLTR13D5 enhancer cooption is placental-specific and species-specific ERV enhancer activity is restricted to TSCs, ESCs and testes.
(a) Barplot of enrichment of RLTR13D5 within tissue enhancer datasets as predicted by distal H3K4me1. (b) Dotplot of TEs enriched in tissue enhancer datasets, generated using distal H3K4me1 regions following Fig. 2c. Only TSC, ESC, and testis exhibit widespread enrichment of recently integrated ERVs within enhancer regions.
We suggest that species-specific ERVs contribute to the rapid divergence of the placental gene regulatory network. ERVs have affected diverse aspects of mammalian biology17,28,29, and have been influential in shaping placental evolution by contributing viral proteins that mediate placental growth, immunosuppression, and cell fusion30. ERVs are normally repressed by the embryo, but for reasons that remain unclear, ERVs are highly active in the mammalian placenta31. Our findings suggest a model where placental ERV activity may be adaptive over time. Under parent-offspring conflict theory, the placental interface is shaped by ongoing conflict between mother and fetus4. We speculate that ERV variation, exposed by the permissive epigenetic state within the placenta, allows the fetus increased evolvability against maternal defenses. Specifically, by relaxing epigenetic repression of ERV activity, the placenta gains access to a highly polymorphic source of enhancer elements that may dramatically influence its developmental phenotype (Fig. S5). As the placenta is a transient organ, the long-term advantage conferred by increased developmental evolvability would outweigh the potentially mutagenic effects of ERV activity. We propose this model as a plausible explanation for the persistence of placenta-specific ERV activity, which has been observed in all major mammalian taxa31. Our study demonstrates that ERVs facilitate placental evolution at the regulatory level by serving as active developmental enhancers, and that this mechanism—made possible by the unique epigenetic environment of trophoblast cells—may contribute to the remarkable morphological diversification of the placenta.
Methods
Accession Numbers
All 3′ RNA-Seq and ChIP-Seq data for both mouse and rat have been deposited at the Gene Expression Omnibus (GEO), accession # GSE42207.
TSC culture
Mouse TSCs were obtained from Dr. Janet Rossant, Hospital for Sick Children, (Toronto, Canada) and maintained in DMEM/F12 with 15 mM Hepes, 20% FBS, 2 mM glutamine, 100 ug/ml streptomycin, 1 mM sodium pyruvate, 100 uM BME, supplemented with Activin, FGF4, and Heparin as previously described32. Rat TSCs and Rcho-1 TSCs were cultured as previously described23,33.
Chromatin immunoprecipitation and sequencing (ChIP-Seq)
Each ChIP was performed with 20 million cells (100 million for transcription factors/TFs) using the ChIP Assay kit (Millipore) following manufacturer’s instructions. Briefly, cells were cross-linked in 2% formaldehyde for 15 minutes, quenched in 1 M glycine for 5 minutes, washed twice with PBS, and resuspended in lysis buffer (1% SDS, 10mM EDTA, 50mM Tris-HCl, pH 8.1) supplemented with a protease inhibitor cocktail (Roche) for 30 minutes. Cell lysates were diluted 1:1 with dilution buffer (0.01% SDS, 1.1% Triton X-100,1.2mM EDTA, 16.7mM Tris-HCl, pH 8.1, 167mM NaCl) then sonicated for 12 cycles (30 seconds on/off) at 60% amplitude to produce an average fragment size range of 300-600 bp. Immunoprecipitation was performed using 2-5 ug antibody (H3K4me3: ActiveMotif 39159, H3K27me3: ActiveMotif 39535, H3K27ac: Abcam ab4729, H3K9me3: Abcam ab8898, H3K4me1: Abcam ab8895, CDX2: Bethyl Labs A300-691-A, EOMES: Abcam ab23345, ELF5: Santa Cruz sc-9645x) conjugated to 50 ul protein G Dynabeads (Invitrogen) overnight. Bead-chromatin complexes were washed using High Salt Immune Complex Wash (0.1% SDS, 1%Triton X-100, 2mM EDTA, 20mM Tris-HCl, pH 8.1, 500mM NaCl), Low Salt Immune Complex Wash (0.1% SDS, 1% Triton X-100, 2mM EDTA, 20mM Tris-HCl, pH 8.1, 150mM NaCl), LiCl Immune Complex Wash (0.25M LiCl,1% IGEPAL, 1% deoxycholate acid, 1mM EDTA, 10mM Tris-HCl, pH 8.1), and TE buffer (10mM Tris-HCl, 1mM EDTA, pH 8.0) with each wash performed twice for 5 minutes. Cell lysis, sonication, immunoprecipitation, and cleanup steps were all performed at 4 °C. Finally, chromatin was eluted from beads using elution buffer (1% SDS, 0.1M NaHCO3) and protein-DNA crosslinks were reversed with the addition of 5M NaCl, and DNA was purified using Qiaquick column cleanup (Qiagen). 50-500 ng immunoprecipitated DNA was prepared for sequencing using the Illumina genomic DNA preparation kit. Briefly, DNA fragments were end repaired and ligated to Illumina adapter linkers, size selected using Invitrogen E-gel SizeSelect agarose gels, PCR amplified 15 cycles (18 for TFs), and purified using Ampure XP beads (Beckman Coulter). Libraries were sequenced using the Illumina Genome Analyzer IIx or HiSeq 2000.
ChIP-Seq analysis
High quality 36 bp or paired-end 100 bp reads (for TFs) were aligned to the mouse (mm9) or rat (rn4) genomes using BWA (v0.9.6)34 and filtered to remove reads that mapped to multiple locations. Data from replicates were pooled and regions of enriched occupancy relative to a background input were identified using MACS (v2.09)35 with default settings and regions with an FDR < 0.05 were retained for analysis. Histone marks were called using the “broad” peak setting, which accounts for breaks in coverage due to repetitive sequence. All association of MACS ChIP-Seq defined regions to gene body features (e.g. gene transcriptional start site/TSS and exon/intron coordinates) was performed using coordinates downloaded from ENSEMBL e63 for mouse and rat. Basic genomic region manipulations including intersections and windows were performed using BedTools36. Functional annotation enrichment of genes near predicted enhancers (defined as regions of H3K27ac + H3K4me1 enrichment >5 kb from a gene TSS) was examined using GREAT37. ChIP aggregate profiles and heatmap graphics were generated using siteproBW and heatmaprBW from the Cistrome package38. For heatmaps, regions that fell within 5 kb of another region were discarded for visualization purposes. For comparative analysis, genomic coordinates of were converted across species using the UCSC liftOver tool requiring at least 50% of the region to be mappable (−minmatch 0.5). For each histone mark, epigenetically conserved regions were defined as regions that mapped across species and resided within 1 kb of ChIP-Seq defined region in the other species (e.g. a rat H3K4me1 region mapped to mouse, overlapping or within 1 kb of a mouse H3K4me1 region). Regions of TF overlap were defined as multiple TF binding sites within a 1 kb window. De novo motif discovery was performed using MDSeqPos module from Cistrome on repeat-masked sequence with the top 1000 enriched ChIP-Seq peaks for each TF dataset based on MACS enrichment scores. Scanning of existing motifs was performed using FIMO, part of the MEME suite39, with binding motif profiles downloaded from Uniprobe40.
Repeat analysis
All repeat data (annotations, consensus sequences) were obtained from RepeatMasker libraries downloaded from the RepeatMasker website (http://www.repeatmasker.org, mouse: v20090604, rat: v20080521). Repeats classified as “Simple,” “Satellite,” and “Unknown” were discarded. Relative repeat ages were estimated based on median percent sequence divergence between extant copies, which is generally indicative of actual repeat age41. Divergence cutoffs for species-specific/shared repeats were determined as previously described42. Mouse repeat ages in years were estimated using the divergence/substitution rate (4.5 × 10⁻⁹)42.
Overrepresented repeat families were determined by comparing the observed number of copies from a family overlapping a ChIP-Seq dataset against a background expectation. The background was estimated by generating 1000 randomized datasets based on each ChIP-Seq dataset, matched for region size, chromosome, and relative distribution from annotated genes (i.e. an equivalent number of regions directly overlapping a gene TSS, exon, intron, 10 kb gene proximal region, 100 kb distal region, or > 100kb intergenic regions) to account for genomic biases in TE integration sites. The number of overlapping TE copies within each of the 1000 randomized datasets were averaged to determine a background expectation, and the enrichment of the observed overlap against the background was assessed with a binomial test using a Bonferroni corrected P < 0.005. Candidate enriched repeat families were further filtered to require ≥ 30 observed overlaps and ≥ 2 fold observed/expected enrichment. These additional thresholds primarily removed SINE elements, which were modestly but significantly enriched in multiple datasets. Though SINES are likely to contribute regulatory elements as well, the extremely high frequency and small size of SINES relative to broad regions of histone mark enrichment led us to discard them as candidates in our analysis. Further, as multiply mapping reads were discarded, our analysis was generally biased against extremely recent TE families that contain non-unique copies.
ENCODE comparison
Illumina read data in FASTQ format for mouse ENCODE H3K4me1 ChIP-Seq experiments was downloaded from the UCSC Genome Browser ENCODE portal24. Replicates were pooled together, re-mapped and processed as described above.
3′ RNA-Seq
Two replicates from different passages (10 million cells each) were prepared for each cell type. mRNA was extracted directly from cell lysates using Dynabeads Oligo (dT)25 (Invitrogen) and assessed for quality using a Bioanalyzer. 500 ng of mRNA was then used to prepare 3′ RNA-Seq libraries as previously described12. Theoretically, 3′ RNA-Seq ensures only a single 3′ fragment per mRNA transcript is represented in the data. Briefly, mRNA was heat sheared for 7 minutes to produce an average fragment size range of 300-500 bp, then used to generate cDNA libraries using a custom oligo dT primer containing Illumina-compatible adapter sequence. cDNA fragments were end-repaired and ligated to standard Illumina adapters. Size-selection was performed using E-gel SizeSelect agarose gels (Invitrogen), products were PCR amplified for 15 cycles, and purified using Ampure XP beads. Library quality was assessed using the 2100 Bioanalyzer (Agilent) and Qubit (Invitrogen), and sequenced on the Genome Analyzer IIx.
High-quality 36 bp reads were aligned to the mouse (mm9) or rat (rn4) genomes using Bowtie 0.12.743, and reads mapping to multiple locations were removed. Significant transcribed regions were detected using Unipeak v0.99 (Foley J., and Sidow A., in review). Regions were associated with annotated gene coordinates downloaded from ENSEMBL build e63, and multiple regions mapping to a single gene were combined, resulting in a raw count total of transcripts per gene. For cross-species analysis, only genes with 1:1 direct orthologs between mouse and rat (defined by ENSEMBL) were retained. Read counts were normalized across samples and species using the DESeq R package(v1.5)44. Genes were associated to RLTR13 elements by identifying the closest proximal gene TSS within 100 kb upstream or downstream of the element. The paired comparison of gene expression between species was performed using normalized expression levels averaged between replicates and significance was assessed using a Wilcoxon signed rank test.
Luciferase assay
To prepare the promoter-reporter constructs, positive/”active” and negative/”decayed” RLTR13D5 sequences were cloned into the KpnI and XhoI sites of pGL4.12 [luc2CP] firefly luciferase vector (Promega) containing a 230bp minimal HSVTK promoter. Rcho-1 TSCs, a commonly used TSC model positive for Cdx2, Eomes and Elf5 expression, were plated into 24 well plates in proliferating condition (RPMI with 20% FBS). 24h after plating, proliferation medium was replaced with transfection medium and 300ng of promoter-reporter vector along with 30ng of the control renilla vector (pGL4.74[hRluc/TK]) were transfected into Rcho-1 rat TSCs in each well using 3ul of Lipofectamine 2000 (Invitrogen) following manufacturer’s protocol. 12h after transfection, transfection medium was replaced with proliferation medium (RPMI with 20% FBS) and cultured for another 12h. 24h after transfection, cells were washed with cold PBS, lysed in 200ul of passive lysis buffer and standard dual luciferase assays were performed on the cell lysates by using Dual-Luciferase Reporter (DLR) Assay reagents (Promega).
Supplementary Material
Acknowledgements
The authors wish to thank G. Barsh for helpful comments, the A. Sidow lab for assistance with sequencing and J. Rossant for contribution of mouse TSCs. This work was supported by the Stanford Genome Training Grant (EBC) (T32 HG000044), the National Science Foundation Graduate Research Fellowship (EBC) (2008052909), the Stanford Bio-X program (JCB), and the Burroughs Welcome Prematurity Initiative (JCB).
Footnotes
Author contributions EBC and JBC conceived and designed the study and wrote the manuscript. EBC designed and performed RNA-Seq and ChIP-Seq experiments and analyzed the data. MAR and MJS provided rat samples. MAR performed luciferase assays.
References
- 1.Mossman HW. Vertebrate Fetal Membranes: Comparative Ontogeny and Morphology; Evolution; Phylogenetic Significance; Basic Functions; Research Opportunities. Rutgers University Press; 1987. [Google Scholar]
- 2.Enders A. Reasons for Diversity of Placental Structure. Placenta. 2009;30(Supplement):15–18. doi: 10.1016/j.placenta.2008.09.018. [DOI] [PubMed] [Google Scholar]
- 3.Crespi B, Semeniuk C. Parent-offspring conflict in the evolution of vertebrate reproductive mode. Am Nat. 2004;163:635–653. doi: 10.1086/382734. [DOI] [PubMed] [Google Scholar]
- 4.Haig D. Genetic conflicts in human pregnancy. The Quarterly Review of Biology. 1993;68:495–532. doi: 10.1086/418300. [DOI] [PubMed] [Google Scholar]
- 5.Knox K, Baker JC. Genomic evolution of the placenta using co-option and duplication and divergence. Genome Res. 2008;18:695–705. doi: 10.1101/gr.071407.107. [DOI] [PMC free article] [PubMed] [Google Scholar]
- 6.Rossant J, Cross JC. Placental development: lessons from mouse mutants. Nat Rev Genet. 2001;2:538–548. doi: 10.1038/35080570. [DOI] [PubMed] [Google Scholar]
- 7.Hughes AL, Green JA, Garbayo JM, Roberts RM. Adaptive diversification within a large family of recently duplicated, placentally expressed genes. Proc Natl Acad Sci USA. 2000;97:3319–3323. doi: 10.1073/pnas.050002797. [DOI] [PMC free article] [PubMed] [Google Scholar]
- 8.Hou Z, Romero R, Uddin M, Than NG, Wildman DE. Adaptive history of single copy genes highly expressed in the term human placenta. Genomics. 2008;93:33–41. doi: 10.1016/j.ygeno.2008.09.005. [DOI] [PMC free article] [PubMed] [Google Scholar]
- 9.Chuong EB, Tong W, Hoekstra HE. Maternal-fetal conflict: rapidly evolving proteins in the rodent placenta. Mol Biol Evol. 2010;27:1221–1225. doi: 10.1093/molbev/msq034. [DOI] [PMC free article] [PubMed] [Google Scholar]
- 10.Carroll SB. Evo-devo and an expanding evolutionary synthesis: a genetic theory of morphological evolution. Cell. 2008;134:25–36. doi: 10.1016/j.cell.2008.06.030. [DOI] [PubMed] [Google Scholar]
- 11.Roberts RM, Fisher SJ. Trophoblast Stem Cells. Biol Reprod. 2011;84:412–421. doi: 10.1095/biolreprod.110.088724. [DOI] [PMC free article] [PubMed] [Google Scholar]
- 12.Beck AH, et al. 3′-end sequencing for expression quantification (3SEQ) from archival tumor samples. PLoS ONE. 2010;5:e8768. doi: 10.1371/journal.pone.0008768. [DOI] [PMC free article] [PubMed] [Google Scholar]
- 13.Zhou VW, Goren A, Bernstein BE. Charting histone modifications and the functional organization of mammalian genomes. Nature Reviews Genetics. 2011;12:7–18. doi: 10.1038/nrg2905. [DOI] [PubMed] [Google Scholar]
- 14.Rugg-Gunn PJ, Cox BJ, Ralston A, Rossant J. Distinct histone modifications in stem cell lines and tissue lineages from the early mouse embryo. Proc Natl Acad Sci USA. 2010;107:10783–10790. doi: 10.1073/pnas.0914507107. [DOI] [PMC free article] [PubMed] [Google Scholar]
- 15.Feschotte C. Transposable elements and the evolution of regulatory networks. Nature Reviews Genetics. 2008;9:397–405. doi: 10.1038/nrg2337. [DOI] [PMC free article] [PubMed] [Google Scholar]
- 16.Weinstock GM, et al. Genome sequence of the Brown Norway rat yields insights into mammalian evolution. Nature. 2004;428:493–521. doi: 10.1038/nature02426. [DOI] [PubMed] [Google Scholar]
- 17.Lynch VJ, Leclerc RD, May G, Wagner GP. Transposon-mediated rewiring of gene regulatory networks contributed to the evolution of pregnancy in mammals. Nat Genet. 2011;43:1154–1159. doi: 10.1038/ng.917. [DOI] [PubMed] [Google Scholar]
- 18.Ng RK, et al. Epigenetic restriction of embryonic cell lineage fate by methylation of Elf5. Nature Cell Biology. 2008;10:1280–1290. doi: 10.1038/ncb1786. [DOI] [PMC free article] [PubMed] [Google Scholar]
- 19.Niwa H, et al. Interaction between Oct3/4 and Cdx2 determines trophectoderm differentiation. Cell. 2005;123:917–929. doi: 10.1016/j.cell.2005.08.040. [DOI] [PubMed] [Google Scholar]
- 20.Russ AP, et al. Eomesodermin is required for mouse trophoblast development and mesoderm formation. Nature. 2000;404:95–99. doi: 10.1038/35003601. [DOI] [PubMed] [Google Scholar]
- 21.He H-H, et al. Nucleosome dynamics define transcriptional enhancers. Nature Genetics. 2010;42:343–347. doi: 10.1038/ng.545. [DOI] [PMC free article] [PubMed] [Google Scholar]
- 22.Yoon S-J, Wills AE, Chuong E, Gupta R, Baker JC. HEB and E2A function as SMAD/FOXH1 cofactors. Genes Dev. 2011;25:1654–1661. doi: 10.1101/gad.16800511. [DOI] [PMC free article] [PubMed] [Google Scholar]
- 23.Faria TN, Soares MJ. Trophoblast cell differentiation: establishment, characterization, and modulation of a rat trophoblast cell line expressing members of the placental prolactin family. Endocrinology. 1991;129:2895–2906. doi: 10.1210/endo-129-6-2895. [DOI] [PubMed] [Google Scholar]
- 24.Shen Y, et al. A map of the cis-regulatory sequences in the mouse genome. Nature. 2012;488:116–120. doi: 10.1038/nature11243. [DOI] [PMC free article] [PubMed] [Google Scholar]
- 25.Prudhomme S, Bonnaud B, Mallet F. Endogenous retroviruses and animal reproduction. Cytogenet Genome Res. 2005;110:353–364. doi: 10.1159/000084967. [DOI] [PubMed] [Google Scholar]
- 26.Molaro A, et al. Sperm Methylation Profiles Reveal Features of Epigenetic Inheritance and Evolution in Primates. Cell. 2011;146:1029–1041. doi: 10.1016/j.cell.2011.08.016. [DOI] [PMC free article] [PubMed] [Google Scholar]
- 27.Rowe HM, Trono D. Dynamic control of endogenous retroviruses during development. Virology. 2011;411:273–287. doi: 10.1016/j.virol.2010.12.007. [DOI] [PubMed] [Google Scholar]
- 28.Cordaux R, Batzer MA. The impact of retrotransposons on human genome evolution. Nature Reviews Genetics. 2009;10:691–703. doi: 10.1038/nrg2640. [DOI] [PMC free article] [PubMed] [Google Scholar]
- 29.Bourque G, et al. Evolution of the mammalian transcription factor binding repertoire via transposable elements. Genome Res. 2008;18:1752–1762. doi: 10.1101/gr.080663.108. [DOI] [PMC free article] [PubMed] [Google Scholar]
- 30.Feschotte C, Gilbert C. Endogenous viruses: insights into viral evolution and impact on host biology. Nat Rev Genet. 2012;13:283–296. doi: 10.1038/nrg3199. [DOI] [PubMed] [Google Scholar]
- 31.Haig D. Retroviruses and the Placenta. Current Biology. 2012;22:R609–R613. doi: 10.1016/j.cub.2012.06.002. [DOI] [PubMed] [Google Scholar]
- 32.Erlebacher A, Price KA, Glimcher LH. Maintenance of mouse trophoblast stem cell proliferation by TGF-beta/activin. Developmental biology. 2004;275:158–169. doi: 10.1016/j.ydbio.2004.07.032. [DOI] [PubMed] [Google Scholar]
- 33.Asanoma K, et al. FGF4-dependent stem cells derived from rat blastocysts differentiate along the trophoblast lineage. Developmental biology. 2011;351:110–119. doi: 10.1016/j.ydbio.2010.12.038. [DOI] [PMC free article] [PubMed] [Google Scholar]
- 34.Li H, Durbin R. Fast and accurate short read alignment with Burrows-Wheeler transform. Bioinformatics (Oxford, England) 2009;25:1754–1760. doi: 10.1093/bioinformatics/btp324. [DOI] [PMC free article] [PubMed] [Google Scholar]
- 35.Zhang Y, et al. Model-based Analysis of ChIP-Seq (MACS) Genome Biology. 2008;9:R137. doi: 10.1186/gb-2008-9-9-r137. [DOI] [PMC free article] [PubMed] [Google Scholar]
- 36.Quinlan AR, Hall IM. BEDTools: a flexible suite of utilities for comparing genomic features. Bioinformatics (Oxford, England) 2010;26:841–842. doi: 10.1093/bioinformatics/btq033. [DOI] [PMC free article] [PubMed] [Google Scholar]
- 37.McLean CY, et al. GREAT improves functional interpretation of cis-regulatory regions. Nat Biotechnol. 2010;28:495–501. doi: 10.1038/nbt.1630. [DOI] [PMC free article] [PubMed] [Google Scholar]
- 38.Liu T, et al. Cistrome: an integrative platform for transcriptional regulation studies. Genome Biology. 2011;12:R83. doi: 10.1186/gb-2011-12-8-r83. [DOI] [PMC free article] [PubMed] [Google Scholar]
- 39.Bailey TL, et al. MEME SUITE: tools for motif discovery and searching. Nucleic Acids Res. 2009;37:W202–8. doi: 10.1093/nar/gkp335. [DOI] [PMC free article] [PubMed] [Google Scholar]
- 40.Newburger DE, Bulyk ML. UniPROBE: an online database of protein binding microarray data on protein-DNA interactions. Nucleic Acids Res. 2009;37:D77–82. doi: 10.1093/nar/gkn660. [DOI] [PMC free article] [PubMed] [Google Scholar]
- 41.Giordano J, et al. Evolutionary History of Mammalian Transposons Determined by Genome-Wide Defragmentation. PLoS Comp Biol. 2007;3:e137. doi: 10.1371/journal.pcbi.0030137. [DOI] [PMC free article] [PubMed] [Google Scholar]
- 42.Chinwalla AT, et al. Initial sequencing and comparative analysis of the mouse genome. Nature. 2002;420:520–562. doi: 10.1038/nature01262. [DOI] [PubMed] [Google Scholar]
- 43.Langmead B, Trapnell C, Pop M, Salzberg SL. Ultrafast and memory-efficient alignment of short DNA sequences to the human genome. Genome Biol. 2009;10:R25. doi: 10.1186/gb-2009-10-3-r25. [DOI] [PMC free article] [PubMed] [Google Scholar]
- 44.Anders S, Huber W. Differential expression analysis for sequence count data. Genome Biology. 2010;11:R106. doi: 10.1186/gb-2010-11-10-r106. [DOI] [PMC free article] [PubMed] [Google Scholar]
Associated Data
This section collects any data citations, data availability statements, or supplementary materials included in this article.


