Abstract
MAL promoter hypermethylation was examined in 260 human esophageal specimens using real-time quantitative methylation-specific PCR (qMSP). MAL hypermethylation showed highly discriminative ROC curve profiles which clearly distinguished esophageal adenocarcinomas (EAC) from both esophageal squamous cell carcinomas (ESCC) and normal esophagus (NE). Both MAL methylation frequency and normalized methylation value (NMV) were significantly higher in Barrett's esophagus (BE), dysplastic BE, and EAC than in ESCC or in NE. Among matched NE and EAC samples, MAL NMVs in EAC were significantly higher than in corresponding NE. There was a significant correlation between MAL hypermethylation and BE segment length. Treatment with 5-aza-2′-deoxycytidine reversed MAL methylation and reactivated MAL mRNA expression in OE33 EAC cells. MAL mRNA levels in EACs with unmethylated MAL were significantly higher than in EACs with methylated MAL. MAL hypermethylation is a common, tissue-specific event in human EAC and correlates with clinical neoplastic progression risk factors.
Esophageal cancer ranks as the 8th most-frequent and 6th most-fatal cancer type worldwide, with an estimated 480,000 new cases diagnosed and 400,000 deaths globally in 20081. This cancer consist of two major histologic subtypes: esophageal adenocarcinoma (EAC), which is more prevalent in Western countries, with a rapidly increasing incidence; and esophageal squamous cell carcinoma (ESCC), which is frequent in developing countries, especially in Asia, and including China2. Since both types of esophageal cancer exhibit highly aggressive behavior, with rapid progression to death3, a better understanding of the molecular events underlying their pathogenesis is essential to achieving improved survival. Therefore, we sought to discover molecular events with potential asearly detection biomarkers ortargets of chemoprevention and therapy.
Myelin and Lymphocyte protein (MAL, also known as mal or T-cell differentiation protein), a 17 kDa hydrophobic membrane protein, is widely expressed in a variety of cell types, including T-lymphocytes4, myelin-forming cells5,6, and epithelial cells of the kidney, stomach, and large intestine7,8. It has recently been clarified that MAL constitutes an essential component of glycolipid-enriched membrane micro-domains or lipid rafts involved in the apical transport of membrane and secretory proteins in polarized epithelial cells9,10. Apical transport is essential for the proper functioning of epithelial cells, and the neoplastic transformation process is frequently associated with loss of this polarized phenotype11. Several investigations have indicated that downregulation of MAL may constitute as a common molecular event contributing to the initiation and/or progression of several cancers, including those arising in the digestive tract. For example, using tissue microarrays, Guro et al. found that epithelial cells of colorectal carcinomas were MAL-negative, whereas in normal colonic tissues cytoplasmic expression of MAL occurred in both epithelial and connective tissues12. Koshi et al. showed that MAL expression was reduced or absent in esophageal cancers vs. normal cells, using differential display experiments13. Dysregulation of MAL has also been implicated in several other malignancies, including breast14, cervical15 and HNSCC cancers16. These results suggest that MAL possesses tumour-suppressive capabilities.
Aberrant methylation of promoter CpG islands upstream of tumor suppressor genes is now well-established as a major mechanism of gene inactivation in human tumorigenesis17, including ESCC and EAC18, where it plays an important role in pathogenesis19,20,21,22. Some of these methylation events appear to represent useful prognostic markers, as they precede and thus predict the progression of Barrett's esophagus (BE) to EAC23. Aberrant promoter methylation of MAL is indeed associated with inactivation of its expression in breast and colorectal cancers12,14. Therefore, we hypothesized that MAL might be inactivated via promoter hypermethylation in human esophageal cancers, and that hypermethylation of MAL could constitute an early event in the genesis of EAC.
Results
MAL promoter hypermethylation in different esophageal tissues
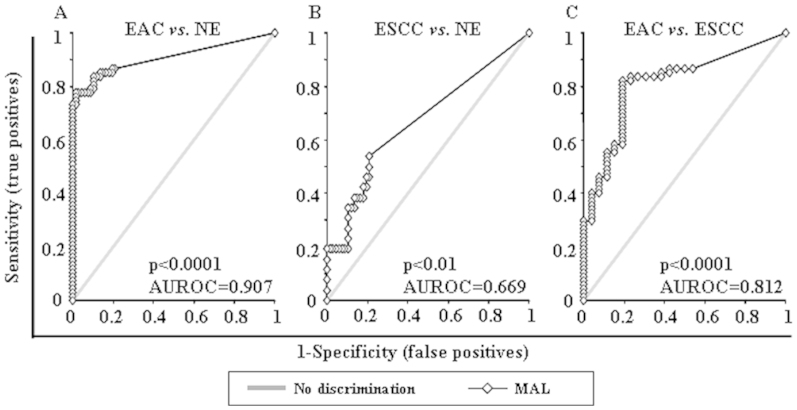
Promoter hypermethylation of the MAL gene was analyzed in 67 normal esophagus (NE), 60 BE, 40 dysplasias occurring in BE [D, 19 low-grade (LGD) and 21 high-grade (HGD)], 67 EAC and 26 ESCC samples. MAL promoter hypermethylation showed highly discriminative receiver-operator characteristic (ROC) curve profiles, which clearly distinguished EAC from both NE and ESCC. ROC curves with corresponding the area under the ROC curve (AUROC) for MAL of EAC vs. NE, ESCC vs. NE and EAC vs. ESCC are shown in Figure 1.
Figure 1. Receiver-operator characteristic (ROC) curve analysis of normalized methylation value (NMV).
ROC curve analysis of MAL NMVs of normal esophagus (NE) vs. esophageal adenocarcinoma (EAC) (A), NE vs. esophageal squamous cell carcinoma (ESCC) (B), and EAC vs. ESCC (C). The area under the ROC curve (AUROC) conveys this biomarker's accuracy in distinguishing EAC from NE and from ESCC in terms of its sensitivity and specificity.
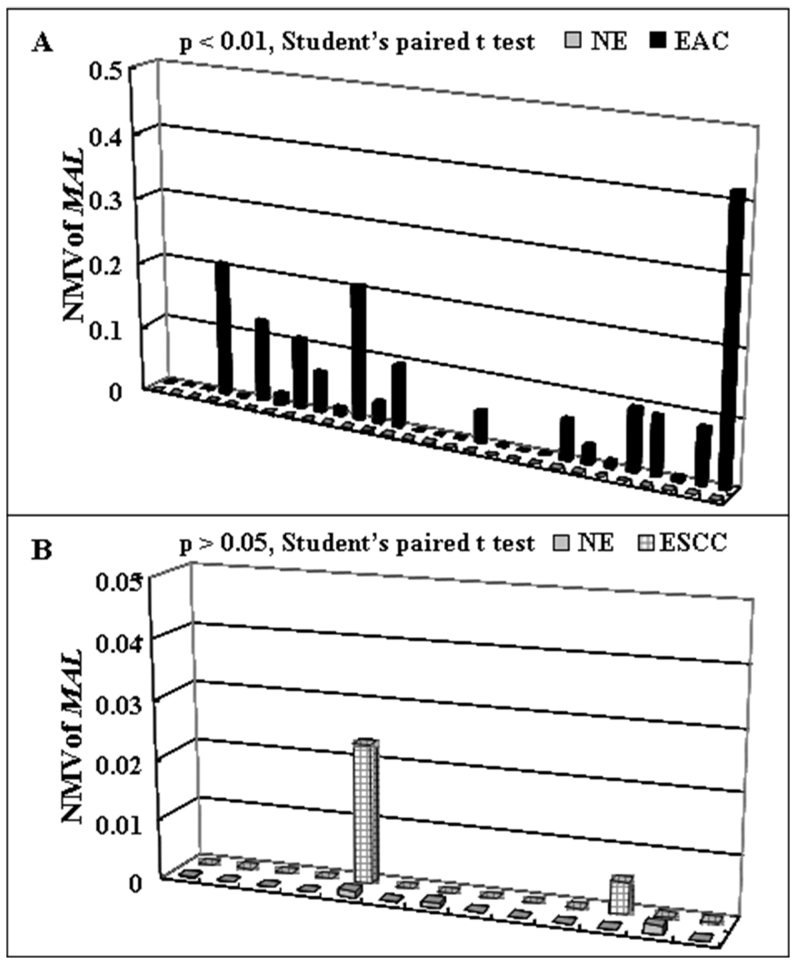
The cutoff normalized methylation value (NMV) for MAL (0.02) was chosen from ROC curves to maximize sensitivity and specificity. Mean NMV and frequency of MAL hypermethylation for each tissue type are shown in Table 1. The mean NMV of MAL was significantly higher in BE (0.0681, p = 0000001), LGD (0.0945, p = 000004), HGD (0.0549, p = 0000001), D (0.0737, p = 00000001), EAC (0.0459, p = 0.000002), and ESCC (0.0042, p = 0.009) than in NE (0.0001; Student's t-test). The frequency of MAL hypermethylation was increased in BE (53.3%), LGD (63.2%), HGD (57.1%), D (60%), and EAC (40.3%) vs. NE (0.0%; all p < 0.01; Fisher's exact probability test). Among 28 cases with matched NE and EAC, the MAL NMVs in EAC (mean = 0.0610) were significantly higher than in corresponding NE (mean = 0.0001; p = 0.0015, Student's paired t-test; Figure 2A). However, Among 13 cases with matched NE and ESCC, the difference of MAL NMVs in ESCC (mean = 0.0023) and in corresponding NE (mean = 0.0003) were not significant (p = 0.29, Student's paired t-test; Figure 2B). Finally, both NMVs and hypermethylation frequency of MAL were significantly higher in BE, D and EAC than in ESCC (Table 1).
Table 1. Clinicopathologic characteristics and methylation status of MAL in human esophageal tissues.
| No. of | Age (year) | Gender | Race | NMV | Methylation Frequency | |
|---|---|---|---|---|---|---|
| Histological type | samples | mean | M/F | W/B/A/unknown | mean ± SD* | cut off 0.02** |
| Normal esophagus | 67 | 64.4 | 60/7 | 40/11/4/12 | 0.00014 ± 0.00039 | 0 |
| Barrett's metaplasia | 60 | 63.7 | 56/4 | 43/3/1/13 | 0.0681 ± 0.09951 #/$ | 53.3% (32/60)#/$ |
| Dysplasia in Barrett's esophagus | 40 | 65.3 | 35/5 | 29/3/2/6 | 0.0737 ± 0.11781#/$ | 60% (24/40)#/$ |
| Low-grade dysplasia | 19 | 65.3 | 17/2 | 13/2/1/3 | 0.0945 ± 0.15812#/$ | 63.2% (12/19)#/$ |
| High-grade dysplasia | 21 | 65.2 | 18/3 | 16/1/1/3 | 0.0549 ± 0.06149#/$ | 57.1% (12/21)#/$ |
| Esophageal adenocarcinoma | 67 | 65.1 | 58/9 | 57/1/2/7 | 0.0459 ± 0.07453#/$ | 40.3% (27/67)#/$ |
| Esophageal squamous cell carcinoma | 26 | 62.5 | 19/7 | 8/13/2/3 | 0.0042 ± 0.01248# | 7.7% (2/26) |
M, male; F, female; W, white; B, black; A, asian; NMV: normalized methylation value.
*p < 0.01, Student's t test.
**p < 0.01, Fisher's exact probability test.
#comparisons made to normal esophagus.
$comparisons made to esophageal squamous cell carcinoma.
Figure 2. Methylation status of MAL in corresponding esophageal samples.
(A) In 28 patients with corresponding NE and EAC. MAL normalized methylation values for EAC (mean = 0.0610) were significantly higher than those for matching NE (mean = 0.0001; p < 0.01, Student t test for paired data). (B) In 13 patients with corresponding NE and ESCC, the differences between MAL NMVs for ESCC (mean = 0.0023) and those for matching NE (mean = 0.0003) were not significantly (p > 0.05, Student t test for paired data).
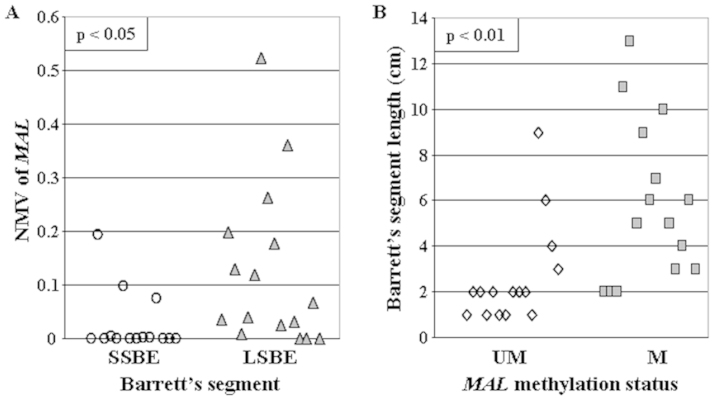
According to generally accepted criteria24, BE was defined as long-segment (LSBE) if it was equal to or greater than 3 cm in length, or short-segment (SSBE) if less than 3 cm. The mean NMV of MAL was significantly higher in LSBE (mean = 0.1235) than in SSBE (mean = 0.0269; p = 0.03, Student's t-test, Figure 3A). Similarly, segment lengths of BEs with hypermethylated MAL promoters (mean = 5.87 cm) were significantly greater than segment lengths of BEs with unmethylated MAL promoters (mean = 2.60 cm; p = 0.005, Student's t-test; Figure 3B).
Figure 3. Correlation between Barrett's segment length and MAL hypermethylation.
(A) Mean NMV of MAL was significantly higher in LSBE (mean = 0.1235, black triangle) than in SSBE (mean = 0.0269, white cricle; p < 0.05, Student's t test). (B) segment lengths of BEs with hypermethylated MAL promoters (mean = 5.87 cm, black square) were significantly greater than segment lengths of BEs with unmethylated MAL promoters (mean = 2.60 cm, white rhombus; p < 0.01, Student's t-test).
No significant associations were observed between MAL promoter hypermethylation and patient age, survival, smoking or alcohol consumption status, tumor stage or lymph node metastasis, histologic tumor differentiation, or histologic type of esophageal carcinoma (data not shown).
MAL methylation and mRNA levels in OE33 cells after 5-Aza-dC treatment
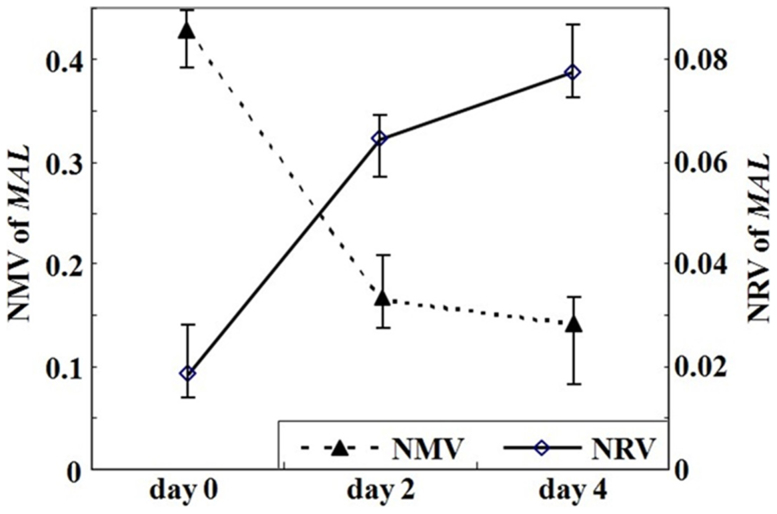
OE33 cells were subjected to demethylation by 5-Aza-dC treatment. After 5-Aza-dC treatment, the NMV of MAL was diminished (0.4264, 0.1647 and 0.1414 on day 0, 2 and 4, respectively), while the mRNA level of MAL(0.0184 on day 0) was increased on day 2 (0.0643) and further increased on day 4 (0.0773, Figure 4).
Figure 4. MAL methylation level and mRNA expression in esophageal cancer cell line (OE33) after treatment with the demethylating agent 5-aza-20-deoxycytidine (5-Aza-dC).
After 5- Aza-dC treatment, the NMV of MAL was diminished, while the NRV of MAL was increased.
Inverse correlation between hypermethylation and mRNA expression of MAL in human esophageal tissues
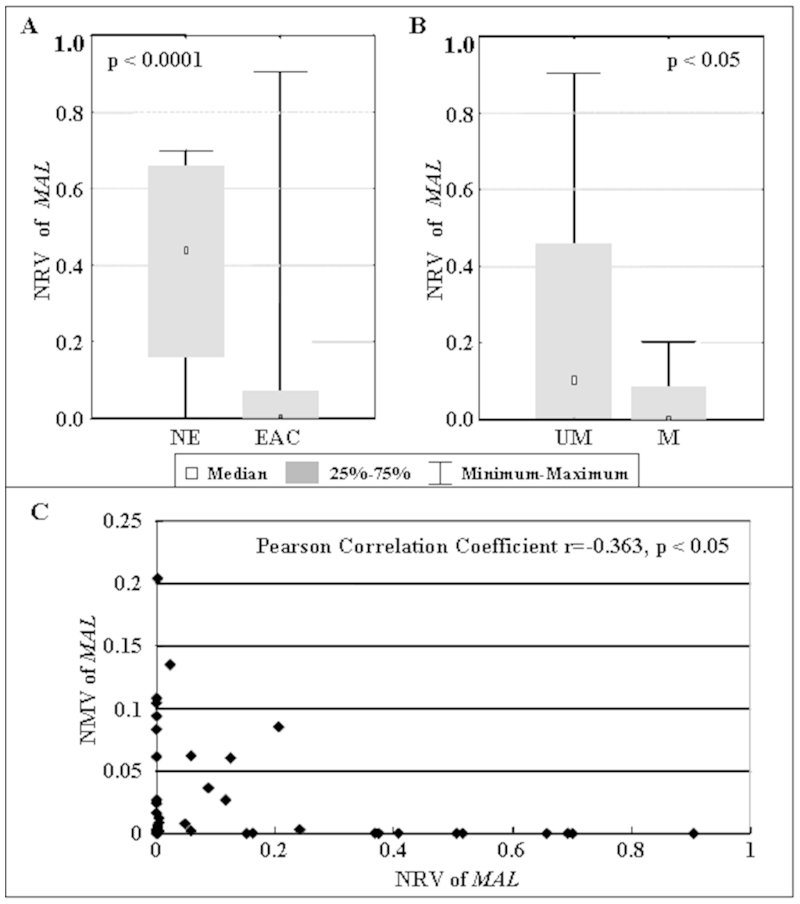
To further elucidate the relationship between DNA hypermethylation and mRNA expression of MAL, we determined the normalized mRNA value (NRV) of MAL in 10 NE and 28 EAC samples using qRT-PCR. The mean NRV of MAL in EAC (mean = 0.0819) was significantly lower than in NE (mean = 0.4128; p = 0.00015, Mann-Whitney U test; Figure 5A). The mean NRV of MAL in specimens with unmethylated MAL (mean = 0.2418, n = 24) was significantly higher than in specimens with hypermethylated MAL (mean = 0.0441, n = 14; p = 0.0084, Mann-Whitney U test; Figure 5B). A significant negative correlation (Pearson correlation coefficient r = −0.363, p = 0.025) between NMVs and NRVs of MAL was also found among these samples (Figure 5C).
Figure 5. Correlation between MAL methylation status and mRNA expression levels in human esophageal tissues.
(A) The mean NRV of MAL in EAC (mean = 0.0819, n = 28) was significant lower than in NE (mean = 0.4128, n = 10;p < 0.0001, Mann-Whitney U test). (B) The mean NRV of MAL in specimens with unmethylated MAL (mean = 0.2418, n = 24) was significantly higher than in specimens with hypermethylated MAL (mean = 0.0441, n = 14;p < 0.05, Mann-Whitney U test). (C) Significant negative correlation (Pearson correlation coefficient r = −0.363, p < 0.05) between NMV and NRV of MAL in human esophageal tissues.
Discussion
MAL down-regulation has been reported in many types of cancer, including breast, cervical, colorectal and esophagus14,15,25,26. These results suggest that low expression of MAL may represent a general characteristic or even a requirement of transformed cells in many kinds of carcinogenesis. Potential mechanisms underlying this suppression of expression include posttranscriptional and epigenetic changes, such as aberrant DNA methylation20,27. Koshi et al. reported that the expression of MAL was extinguished in ESCC, and speculated that DNA methylation and histone deacetylation in the MAL promoter may act as synergistic controls to silence the MAL gene in esophageal cancer13. However, evidence for this conclusion was based on 5-aza-20-deoxycytidine and trichostatin A-treated esophageal carcinoma cell lines. Whether hypermethylation of the MAL gene was a common event in esophageal carcinoma was thus still unknown. Further evidence based on sufficient clinical samples was therefore needed.
In the current study, by studying 260 primary human tissue specimens, we systematically investigated hypermethylation of the MAL gene promoter in primary human esophageal lesions of differing histological types and grades using real-time quantitative methylation-specific PCR (qMSP). DNA methylation levels were not validated by other methods, such as pyrosequencing. Our results demonstrate that MAL promoter hypermethylation occurs frequently in human EAC, but not in ESCC (Table 1). MAL NMVs in EAC were significantly higher than in corresponding NE in 28 cases with matched NE and EAC (Figure 2A). However, no significant difference of MAL NMVs was found between NE and ESCC in 13 cases with matched NE and ESCC (Figure 2B). In addition, both NMV and hypermethylation frequency of MAL were significantly higher in BE, D and EAC than in ESCC (Table 1). These results suggest that hypermethylation of MAL may represent an early epigenetic event in these subjects, and that this event is highly prevalent in human esophageal adenocarcinomas.
BE is the major risk factor for esophageal adenocarcinoma28. Although it is somewhat arbitrary to separate SSBE from LSBE, this distinction persists in clinical practice29,30. To date, length of BE as a predictive factor for BE progression remains controversial. While several previous studies found that patients with SSBE can develop dysplasia and cancer31,32, the statement that an increased risk of EAC development exists only in patients with LSBE33,34 is not accepted universally. Giovanni et al. reported that complete-type intestinal metaplasia (IM), which is considered the least prone to cancerization, was significantly prevalent in SSBE patients at baseline, whereas the incomplete type of IM, which is more closely associated with cancer progression, significantly prevailed in LSBE35. In a prospective cohort study of 309 Barrett's patients followed in the Seattle Barrett's Esophagus Project, a strong trend was observed, with a 5 cm difference in length associated with a 1.7-fold increase in cancer risk (95% CI, 0.8–3.8-fold), when patients with HGD at entrance were excluded36. Several other researchers also demonstrated significant differences between SSBE and LSBE in the frequency of both dysplasia and EAC33,34. Thus, it is likely that length of Barrett's epithelium is an important risk factor for both the prevalence of concurrent dysplasia or cancer and the incidence of future malignant progression. Notably, MAL hypermethylation exhibited a strong correlation with BE segment length in the current study (Figure 3). Therefore, MAL methylation may constitute both a molecular correlate of BE segment length, and a potential biomarker for the prediction of future BE progression.
We further analyzed the methylation status and mRNA expression level of MAL, both in 5-Aza-dC treated EAC cells and in primary human EAC specimens. These experiments revealed that reversal of methylation and restoration of MAL expression were induced in OE33 cells by 5-Aza-dC treatment (Figure 4). Restoration of MAL mRNA expression due to 5-Aza-dC treatment is consistent with the interpretation that DNA promoter hypermethylation silences the MAL gene. This experiment was performed in only one EAC cell line, and not in any BE or ESCC cell lines. Moreover, in 38 esophageal specimens, the mean NRV of MAL was significantly higher in specimens with unmethylated MAL promoters than in specimens with hypermethylated MAL (Figure 5B), and a significant negative correlation between NMV and NRV of MAL was also observed (Figure 5C). It is worthwhile to note that many previous studies have proposed epigenetic regulation of MAL expression12,37,38, These previous observations, together with our own new data, suggest that epigenetic regulation (such as promoter hypermethylation) is essential in silencing of MAL expression in human esophageal adenocarcinoma, and that the MAL gene is a candidate tumor suppressor gene in this disease.
In conclusion, the current study shows that hypermethylation of the MAL gene promoter, leading to gene silencing, is a common event in human Barrett's-associated EAC and is associated with clinical risk factors of neoplastic progression. In addition, MAL hypermethylation is uncommon in human ESCC, thus making this event a potential cell type-specific biomarker for EAC.
Methods
Tissue samples
In the current study, 67 NE, 60 BE samples without dysplasia, 19 low-grade and 21 high-grade dysplasias occurring in BE (D), 67 EACs, and 26 ESCCs were examined. All patients provided written informed consent under a protocol approved by the Institutional Review Boards at the University of Maryland and Baltimore Veterans Affairs Medical Centers, where all esophagogastroduodenoscopies were performed. Biopsies were taken using a standardized biopsy protocol, as previously described19. Research tissues were obtained from grossly apparent Barrett's epithelium or from mass lesions in patients manifesting these changes at endoscopic examination, and histology was confirmed using parallel aliquots obtained at endoscopy. All biopsy specimens were stored in liquid nitrogen before DNA/RNA extraction. Clinicopathologic characteristics are summarized in Table 1.
Cell lines
The EAC (OE33) cell line was obtained from the ATCC (Manassas, VA). These cells were cultured in 47.5% RPMI 1640, 47.5% F-12 supplemented with 5% fetal bovine serum.
DNA and RNA extraction
Genomic DNA was extracted from biopsies and cultured cells using a DNeasy Tissue Kit (Qiagen, Valencia, CA). Total RNA was isolated cultured cells using TRIzol reagent (Invitrogen, Carlsbad, CA). DNAs and RNAs were stored at −80°C before analysis.
Bisulfite treatment and real-time quantitative methylation-specific PCR
DNA was treated with bisulfite to convert unmethylated cytosines to uracils prior to qMSP, as described previously19. Promoter methylation levels of MAL were determined with the ABI 7900 Sequence Detection System (Applied Biosystems, Foster City, CA), using primers and probes as described previously20. A standard curve was generated using serial dilutions of CpGenome Universal Methylated DNA (CHEMICON, Temecula, CA). The NMV was defined as follows: NMV = (MAL-S/MAL-FM)/(ACTB-S/ACTB-FM), where MAL-S and MAL-FM represent the methylation levels of MAL in sample and universal methylated DNAs, respectively, while ACTB-S and ACTB-FM correspond to β-Actin in sample and universal methylated DNAs, respectively21.
Real-time quantitative reverse-transcriptase polymerase chain reaction
To determine MAL mRNA levels, one-step real-time quantitative reverse-transcriptase polymerase chain reaction (qRT-PCR) was performed using a Qiagen QuantiTect Probe RT-PCR Kit (Qiagen, Hilden, Germany) and the ABI 7900 Sequence Detection System (Applied Biosystems, Foster City, CA). Primers and probes were the same as previously reported20. β-Actin was used for normalization of data. A standard curve was generated using serial dilutions of qPCR Reference Total RNA (Clontech, Mountainview, CA). The NRV was calculated according to the following formula for relative expression of target mRNA: NRV = (TarS/TarC)/(ACTB-S/ACTB-C), where TarS and TarC represent levels of mRNA expression for the target gene in sample and control mRNAs, respectively, whereas ACTB-S and ACTB-C correspond to amplified β-Actin levels in sample and control mRNAs, respectively21.
5-Aza-dC treatment of esophageal cancer cell lines
To determine whether MAL inactivation was due to promoter hypermethylation in esophageal cancer, OE33 EAC cells were subjected to 5-Aza-dC (Sigma, St. Louis, MO) treatment as previously described21. Briefly, 1 × 10⁵ cells/ml were seeded onto a 100 mm dish and grown for 24 h. Then, 1 ul of 5 mM 5-Aza-dC per ml of cells was added every 24 hours for 6 days. DNA and RNA were harvested on day 4.
Data analysis and statistics
ROC curve analysis39 was performed using NMVs for the 67 EAC, 26 ESCC and 67 NE by Analyse-it software (Version 1.71, Analyse-it Software, Leeds, UK). Using this approach, the AUROC yielded optimal sensitivity and specificity to distinguish normal from malignant esophageal tissues, and corresponding NMV thresholds were calculated for MAL. The cutoff value determined from this ROC curve was applied to determine the frequency of MAL methylation in each tissue type included in the present study. For all other tests, Statistica (version 6.1; StatSoft, Inc., Tulsa, OK) was used. Differences with p < 0.05 were deemed significant.
Author Contributions
Dr. Liang Wang as L.W., Dr. Yuan Zhang as Y. Z., Dr. Yulan Cheng as Y.C., Dr. Yan Gao as Y.G., Dr. Xianling Feng as X.Fe., Dr. Ming Dong as M.D., Dr. Ziyi Cao as Z.C., Dr. Si Chen as S.C., Dr. Huimin Yu as H.Y., Dr. Zhenfu Zhao as Z.Z., Dr. Xiaojing Zhang as X.Z., Dr. Jie Liu as J.L., Dr. Xinmin Fan as X.Fa., Dr. Yuriko Mori as Y.M., Dr. Stephen J. Meltzer as S.J.M., Prof. Zhe Jin as Z.J., Z.J. and S.J.M. designed the study. Z.J. and L.W. wrote the main manuscript text. Y. Z., Y.C., Y.G., X.Fe., M.D., Z.C., S.C., H.Y., Z.Z., X.Z., J.L., X.Fa. and Y.M. analyzed and interpreted the data. All authors reviewed the manuscript.
Acknowledgments
Supported by National Nature Science Foundation of China grant 81172282,Natural Science Foundation of SZU grants 201108 and T201202 to Z Jin; NIH grants DK087454, CA146799 and CA133012 to SJ Meltzer; National Nature Science Foundation of China grant 81171921 and the Science and Technology Bureau of ShenZhen City grant JC201006010727A and JCYJ20120613165853326 to L Wang.
References
- Bray F., Ren J. S., Masuyer E. & Ferlay J. Global estimates of cancer prevalence for 27 sites in the adult population in 2008. Int J Cancer 132, 1133–1145 (2013). [DOI] [PubMed] [Google Scholar]
- Zhang X. M. & Guo M. Z. The value of epigenetic markers in esophageal cancer. Front Med China 4, 378–84 (2010). [DOI] [PubMed] [Google Scholar]
- Enzinger P. C. & Mayer R. J. Esophageal cancer. N Engl J Med 349, 2241–52 (2003). [DOI] [PubMed] [Google Scholar]
- Alonso M. A. & Weissman S. M. cDNA cloning and sequence of MAL, a hydrophobic protein associated with human T-cell differentiation. Proc Natl Acad Sci U S A 84, 1997–2001 (1987). [DOI] [PMC free article] [PubMed] [Google Scholar]
- Kim T., Fiedler K., Madison D. L., Krueger W. H. & Pfeiffer S. E. Cloning and characterization of MVP17: a developmentally regulated myelin protein in oligodendrocytes. J Neurosci Res 42, 413–22 (1995). [DOI] [PubMed] [Google Scholar]
- Schaeren-Wiemers N., Valenzuela D. M., Frank M. & Schwab M. E. Characterization of a rat gene, rMAL, encoding a protein with four hydrophobic domains in central and peripheral myelin. J Neurosci 15, 5753–64 (1995). [DOI] [PMC free article] [PubMed] [Google Scholar]
- Zacchetti D., Peranen J., Murata M., Fiedler K. & Simons K. VIP17/MAL, a proteolipid in apical transport vesicles. FEBS Lett 377, 465–9 (1995). [DOI] [PubMed] [Google Scholar]
- Martin-Belmonte F., Kremer L., Albar J. P., Marazuela M. & Alonso M. A. Expression of the MAL gene in the thyroid: the MAL proteolipid, a component of glycolipid-enriched membranes, is apically distributed in thyroid follicles. Endocrinology 139, 2077–84 (1998). [DOI] [PubMed] [Google Scholar]
- Martin-Belmonte F., Puertollano R., Millan J. & Alonso M. A. The MAL proteolipid is necessary for the overall apical delivery of membrane proteins in the polarized epithelial Madin-Darby canine kidney and fischer rat thyroid cell lines. Mol Biol Cell 11, 2033–45 (2000). [DOI] [PMC free article] [PubMed] [Google Scholar]
- Martin-Belmonte F., Arvan P. & Alonso M. A. MAL mediates apical transport of secretory proteins in polarized epithelial Madin-Darby canine kidney cells. J Biol Chem 276, 49337–42 (2001). [DOI] [PubMed] [Google Scholar]
- Marazuela M. & Alonso M. A. Expression of MAL and MAL2, two elements of the protein machinery for raft-mediated transport, in normal and neoplastic human tissue. Histol Histopathol 19, 925–33 (2004). [DOI] [PubMed] [Google Scholar]
- Lind G. E. et al. Hypermethylated MAL gene - a silent marker of early colon tumorigenesis. J Transl Med 6, 13 (2008). [DOI] [PMC free article] [PubMed] [Google Scholar]
- Mimori K. et al. MAL gene expression in esophageal cancer suppresses motility, invasion and tumorigenicity and enhances apoptosis through the Fas pathway. Oncogene 22, 3463–71 (2003). [DOI] [PubMed] [Google Scholar]
- Horne H. N. et al. Inactivation of the MAL gene in breast cancer is a common event that predicts benefit from adjuvant chemotherapy. Mol Cancer Res 7, 199–209 (2009). [DOI] [PMC free article] [PubMed] [Google Scholar]
- Overmeer R. M. et al. Repression of MAL tumour suppressor activity by promoter methylation during cervical carcinogenesis. J Pathol 219, 327–36 (2009). [DOI] [PubMed] [Google Scholar]
- Kuriakose M. A. et al. Selection and validation of differentially expressed genes in head and neck cancer. Cell Mol Life Sci 61, 1372–83 (2004). [DOI] [PMC free article] [PubMed] [Google Scholar]
- Wang J. S. et al. DNA promoter hypermethylation of p16 and APC predicts neoplastic progression in Barrett's esophagus. Am J Gastroenterol 104, 2153–60 (2009). [DOI] [PMC free article] [PubMed] [Google Scholar]
- Hennessy T. P. Cancer of the oesophagus. Postgrad Med J 72, 458–63 (1996). [DOI] [PMC free article] [PubMed] [Google Scholar]
- Jin Z. et al. A multicenter, double-blinded validation study of methylation biomarkers for progression prediction in Barrett's esophagus. Cancer Res 69, 4112–5 (2009). [DOI] [PMC free article] [PubMed] [Google Scholar]
- Mori Y. et al. A genome-wide search identifies epigenetic silencing of somatostatin, tachykinin-1, and 5 other genes in colon cancer. Gastroenterology 131, 797–808 (2006). [DOI] [PubMed] [Google Scholar]
- Jin Z. et al. Hypermethylation of tachykinin-1 is a potential biomarker in human esophageal cancer. Clin Cancer Res 13, 6293–300 (2007). [DOI] [PubMed] [Google Scholar]
- Tischoff I. et al. Methylation of SOCS-3 and SOCS-1 in the carcinogenesis of Barrett's adenocarcinoma. Gut 56, 1047–53 (2007). [DOI] [PMC free article] [PubMed] [Google Scholar]
- Hahn H. P. et al. Intestinal differentiation in metaplastic, nongoblet columnar epithelium in the esophagus. Am J Surg Pathol 33, 1006–15 (2009). [DOI] [PMC free article] [PubMed] [Google Scholar]
- Donahue D. & Navab F. Significance of short-segment Barrett's esophagus. J Clin Gastroenterol 25, 480–4 (1997). [DOI] [PubMed] [Google Scholar]
- Lind G. E., Ahlquist T. & Lothe R. A. DNA hypermethylation of MAL: a promising diagnostic biomarker for colorectal tumors. Gastroenterology 132, 1631–2; author reply 1632 (2007). [DOI] [PubMed] [Google Scholar]
- Mimori K. et al. Loss of MAL expression in precancerous lesions of the esophagus. Ann Surg Oncol 14, 1670–7 (2007). [DOI] [PubMed] [Google Scholar]
- Lin S. Y. et al. Promoter CpG methylation of caveolin-1 in sporadic colorectal cancer. Anticancer Res 24, 1645–50 (2004). [PubMed] [Google Scholar]
- Hvid-Jensen F., Pedersen L., Drewes A. M., Sorensen H. T. & Funch-Jensen P. Incidence of adenocarcinoma among patients with Barrett's esophagus. N Engl J Med 365, 1375–83 (2011). [DOI] [PubMed] [Google Scholar]
- Clark G. W. et al. Short-segment Barrett's esophagus: A prevalent complication of gastroesophageal reflux disease with malignant potential. J Gastrointest Surg 1, 113–22 (1997). [DOI] [PubMed] [Google Scholar]
- Csendes A. et al. Clinical, endoscopic, and functional studies in 408 patients with Barrett's esophagus, compared to 174 cases of intestinal metaplasia of the cardia. Am J Gastroenterol 97, 554–60 (2002). [DOI] [PubMed] [Google Scholar]
- Yagi K. et al. Endoscopic findings of adenocarcinoma arising from short-segment Barrett's esophagus. J Gastroenterol Hepatol 19, 940–3 (2004). [DOI] [PubMed] [Google Scholar]
- May A. et al. Intraepithelial high-grade neoplasia and early adenocarcinoma in short-segment Barrett's esophagus (SSBE): curative treatment using local endoscopic treatment techniques. Endoscopy 34, 604–10 (2002). [DOI] [PubMed] [Google Scholar]
- Hirota W. K. et al. Specialized intestinal metaplasia, dysplasia, and cancer of the esophagus and esophagogastric junction: prevalence and clinical data. Gastroenterology 116, 277–85 (1999). [DOI] [PubMed] [Google Scholar]
- Hage M. et al. Oesophageal cancer incidence and mortality in patients with long-segment Barrett's oesophagus after a mean follow-up of 12.7 years. Scand J Gastroenterol 39, 1175–9 (2004). [DOI] [PubMed] [Google Scholar]
- Zaninotto G. et al. Long-term follow-up of Barrett's epithelium: medical versus antireflux surgical therapy. J Gastrointest Surg 16, 7–14; discussion 14–5 (2012). [DOI] [PubMed] [Google Scholar]
- Rudolph R. E. et al. Effect of segment length on risk for neoplastic progression in patients with Barrett esophagus. Ann Intern Med 132, 612–20 (2000). [DOI] [PubMed] [Google Scholar]
- Lee P. S. et al. Elevated MAL expression is accompanied by promoter hypomethylation and platinum resistance in epithelial ovarian cancer. Int J Cancer 126, 1378–89 (2010). [DOI] [PubMed] [Google Scholar]
- Cao W. et al. Epigenetic silencing of MAL, a putative tumor suppressor gene, can contribute to human epithelium cell carcinoma. Mol Cancer 9, 296 (2010). [DOI] [PMC free article] [PubMed] [Google Scholar]
- Hanley J. A. & McNeil B. J. The meaning and use of the area under a receiver operating characteristic (ROC) curve. Radiology 143, 29–36 (1982). [DOI] [PubMed] [Google Scholar]


