Abstract
The Medipix All Resolution System (MARS) system is a commercial spectral/multi-energy micro-CT scanner designed and assembled by the MARS Bioimaging, Ltd. in New Zealand. This system utilizes the state-of-the-art Medipix photon-counting, energy-discriminating detector technology developed by a collaboration based at European Organization for Nuclear Research (CERN). In this paper, we report our preliminary experimental results using this system, including geometrical alignment, photon energy characterization, protocol optimization, and spectral image reconstruction. We produced our scan datasets with a multi-material phantom, and then applied ordered subset-simultaneous algebraic reconstruction technique (OS-SART) to reconstruct images in different energy ranges and principal component analysis (PCA) to evaluate spectral deviation between the energy ranges.
Keywords: Spectral/Multi-Energy Micro-CT, OS-SART, Multi-Material Phantom, PCA
1. Introduction
In a conventional x-ray computed tomography (CT) system, the x-ray source has a broad energy spectrum, and the detector is a digital integrating sensor whose output is proportional to the energy fluence integrated over the entire incidence spectrum. Given that x-ray attenuation is dependent both on the object material and photon energy, a conventional x-ray CT detector loses some of the attenuation information due to the detector’s energy integration. In other words, conventional x-ray CT detectors do not have the capability to resolve the energy level of incident photons, thus the additional information provided by the attenuation map with respect to different energies is lost.
On the other hand, recent advances in spectral /multi-energy detector technology has allowed for spectral CT systems which can identify absorption features in the available range of photon energies. Spectral/multi-energy CT has a stronger capability to distinguish different materials because it can simultaneously capture images at multiple energy levels (bins) [1–3]. One type of spectral/multi-energy CT system utilizes a synchrotron or dual-energy x-ray source with a conventional x-ray detector. In this system, the source generates monochromatic x-ray photons at different energies (separated in time) and the detector captures these monochromatic photons [4–7]. Recently, another type of spectral/multi-energy CT was developed which employs a polychromatic x-ray source and an energy discriminating x-ray detector [8–10].
In August 2010, under a research agreement, the Biomedical Imaging Division of the Virginia Tech-Wake Forest University School of Biomedical Engineering and Sciences purchased a state-of-the-art spectral/multi-energy micro-CT scanner, the Medipix All Resolution System (MARS), which is designed and produced by the MARS Bioimaging Ltd. It is one of two such systems currently in the USA (the other is at Mayo Clinic). The MARS system includes a polychromatic x-ray source and an energy discriminating detector (Medipix MXR) developed by collaboration at the European Organization for Nuclear Research (CERN). The Medipix detector is a photon counting system with selectable threshold, thus it is sensitive to the energy of the incoming photons and can be used as a spectroscopic imaging device [3,8,11,12]. We have performed a series of preliminary studies with our MARS system. First, we studied the MARS system architecture, and performed geometrical alignment work (refer to addenda) to determine the relative position of the x-ray source, an imaging object and the detector plane. We then performed K-edge imaging studies with the MARS system, which involves setting the energy resolving thresholds to both sides of the material’s K-edge and measuring the change in attenuation. We used high atomic weight materials (iodine and others) to analyze the K-edge, and adjusted the energy threshold and exposure time for the Medipix detector to generate attenuation-versus-energy plots. Meanwhile, we designed and imaged a multi-material phantom, consisting of soft-tissue-like and bone-like materials and contrast agents. Finally, we employed the ordered-subset simultaneous algebraic reconstruction technique (OS-SART) [13–16] to reconstruct the multi-material phantom in different energy ranges. To analyze and render the spectral image data, we chose the principal component analysis (PCA) method [17–19] to identify all patterns of variance; the variance can be intrinsic to the object being imaged, arising from the method of reconstruction, or from noise.
In this paper, we will share the aforementioned experiences and preliminary results with our peers. The remainder of this paper is organized as follows. In the second section, we will introduce the research materials and methods. In the third section, we will demonstrate our preliminary experiment results using the MARS micro-CT, including K-edge analysis, image reconstruction and PCA analysis. In the final section, we will discuss the issues associated with our work and conclude the paper.
2. Materials and Methods
2.1. MARS Micro-CT System
The MARS system is a desk-sized, free-standing machine consisting of a broad spectrum x-ray source and an energy discriminating detector in a fully shielded enclosure, along with supporting computer hardware, peripheral electronics, and viewing software. The system provides a significant, new platform for biomedical imaging research by accurately differentiating atomic and density variation within the imaging tissues. The MARS system employs a Medipix detector which allows up to eight simultaneous energy sampling thresholds (bins) from a single exposure. The Medipix detector is a photon counting system with selectable thresholds, which depends on a threshold equalization mask to adjust each pixel to record different energy photons. The active area of the Medipix detector is 14 × 14 mm, comprising 256×256 pixels with each pixel covering an area of 55×55µm.
2.2. Spectroscopic Experiments
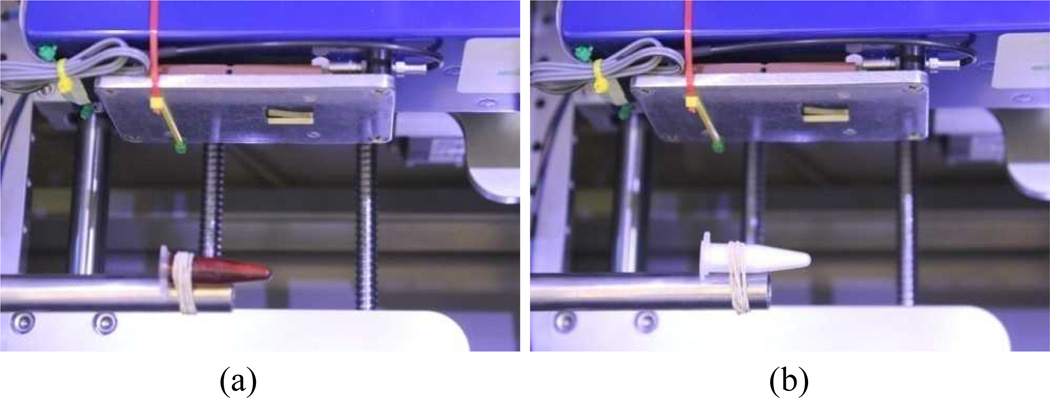
X-ray K-edge imaging involves capturing attenuation characteristics on both sides of the K-edge in the attenuation profile. Typically, materials of a relatively high atomic number are employed, thus we chose two contrast agents: 5% iodine solution (Fig. 1a) and 30% barium sulfate solution (Fig. 1b). First, we adjusted the energy thresholds and exposure times for the Medipix detector, and captured projections at different energy thresholds (ranges). Then, we calculated attenuation coefficient at the various energy thresholds, and generated attenuation-versus-energy plots. The attenuation coefficient projection in one energy level could be described (using Beers law) as:
| (1) |
where IL and IH are the photon counts from the Medipix detector using low and high energy thresholds after passing through the imaging object, respectively. For a given energy threshold, the Medipix detector counts all the incident photons whose energy is above the energy threshold. IL0 and IH0 are the corresponding values without the imaging object.
Fig. 1.
The K-edge test samples. (a) Iodine solution sample, and (b) Barium sulfate solution sample.
2.3. Phantom Experiments
2.3.1. Phantom Design
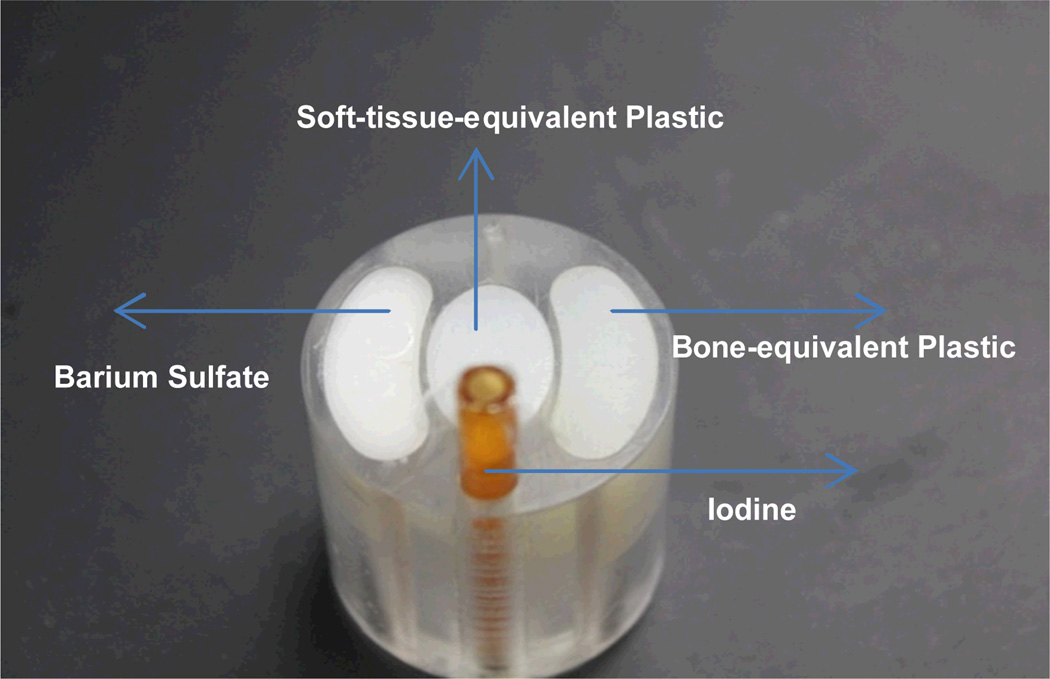
A multi-material phantom was designed as a 3.0 cm diameter cylinder (Fig. 2). The phantom is composed of bone-equivalent plastic, soft-tissue-equivalent plastic (Polymethyl Methacrylate, PMMA) and contrast agents (iodine and barium sulfate). The phantom’s iodine solution (~1.5% concentration) was contained by a plastic tube, and the barium sulfate inside the phantom was mixed into paraffin wax (1:4 barium sulfate to paraffin wax).
Fig. 2.
A picture of the multi-material phantom.
2.3.2. Image Reconstruction
The advanced reconstruction algorithm OS-SART is employed to reconstruct multi-material phantom images. In the following, we present a summary of the OS-SART method [13].
It has been widely accepted in the CT field that the image reconstruction can be modeled as a linear system
| (2) |
where b = (b1 ,⋯,bi ,⋯bI) ∈ RI represents the projection data, f = (f1,⋯,fj,⋯fJ) ∈ RJ denotes the image object, A = (aij) is the measurement matrix, and I and J are integers. The algebraic reconstruction technique (ART) is the first iterative algorithm used for CT image reconstruction, which can be expressed as
| (3) |
where n represents the iterative number, is the Euclidean norm of the ith row of A. The simultaneous ART (SART) is a major refinement to the ART:
| (4) |
where , i = 1,⋯, I, , j = 1,⋯, J. Note that ai+ ≠ 0 means that the measure bi is informative; and a+j ≠ 0 indicates that the unknown xj is observable.
In recent years, some advanced techniques have been developed to accelerate the iterative reconstruction algorithms, among which the ordered-subset (OS) scheme is very attractive. As a result, the SART algorithm can be accelerated by the OS scheme and results in the OS-SART approach. To formulate an OS versions of the SART technique, we assume that the index set B = {1,⋯,I} can be partitioned into T nonempty disjoint subsets such that
| (5) |
where L(t) is the number of indexes for the tth subset. One possible version of the OS-SART formulation can be expressed as
| (6) |
where [n,T] = n mod T + 1. The convergence of the OS-SART algorithm has been demonstrated and well accepted in the CT field [14].
2.4. Principal Component Analysis
The introduction of an energy-discriminating detector allows the production of color CT images. Energy dependent, or spectral, images can be produced using data collected in a particular energy range (with a color linked to a given energy range). The x-ray attenuation of a particular material depends on the energy of the transmitted photons. Images produced using data obtained in a various energy ranges will cause certain materials in the object to become more apparent, depending on the material’s attenuation characteristics.
We hope to extract and quantify this additional information using PCA, which is an algorithmic process that quantifies the importance of, and relationships between, certain features in a data set. In the context of spectral CT image analysis, PCA aims to distinguish the materials which comprise the imaged object. For PCA, we assume that k spectral images x̃1, … , x̃k, ⋯ x̃K (x̃k ∈ RJ) have been reconstructed. The spectral images should be ‘centered’, by subtracting the ‘average’ image as follows,
| (7) |
Now let F = [f1, … , fK]T ∈ RK×J (so that the rows of F correspond to the centered spectral images). The goal of PCA is to find a linear transformation Y=PF to maximize the variance in contrast materials, where P is a transformation matrix and the rows of Y are the transformed images. Initially F is known, but P must be determined before Y can be found. The additional constraint is that the matrix Y should satisfy
| (8) |
Where CY is a diagonal matrix. To construct the matrices Y and CY we consider the covariance matrix corresponding to the centered spectral images
| (9) |
Looking at the eigenvalues of E we can determine the principle components. Using the well-known singular value decomposition method, the matrix P in the diagonalization
| (10) |
gives the approximate matrix Y. The rows of Y can be used to render the color image.
3. Experiment Results
3.1. K-edge Analysis
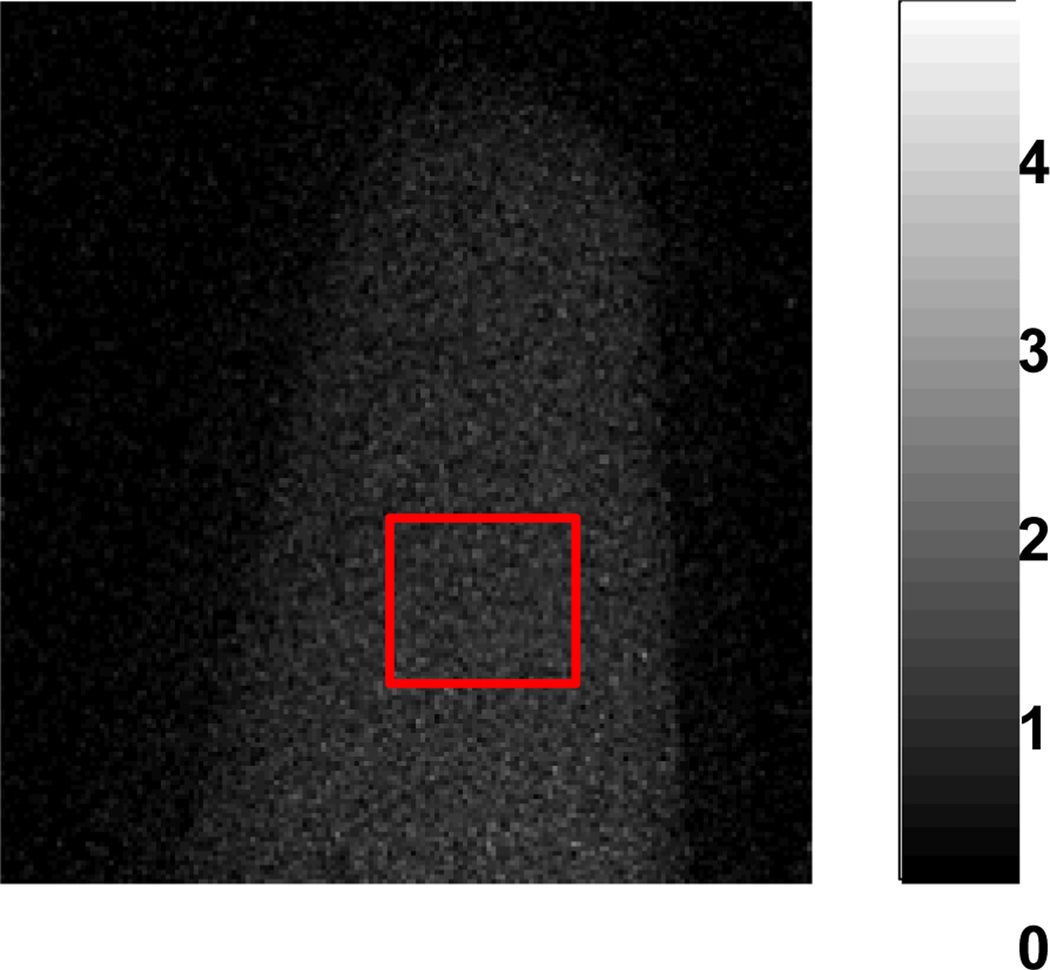
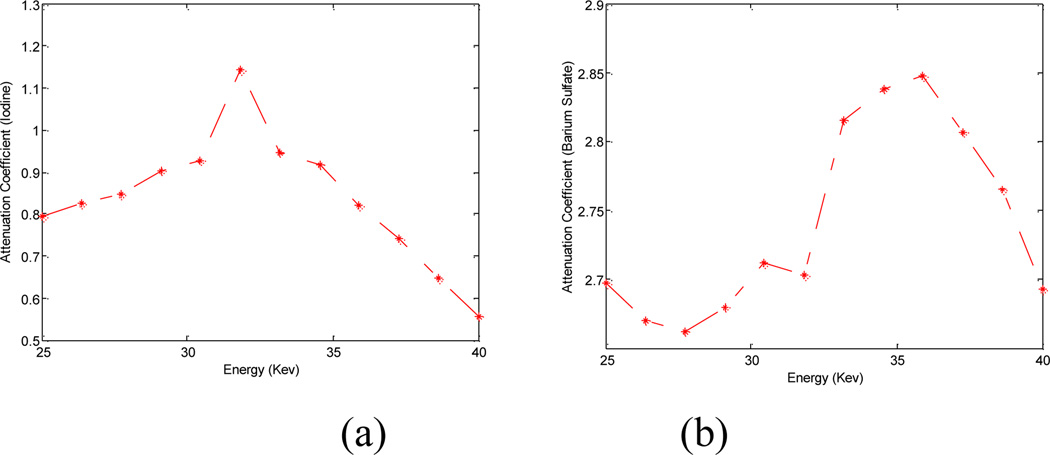
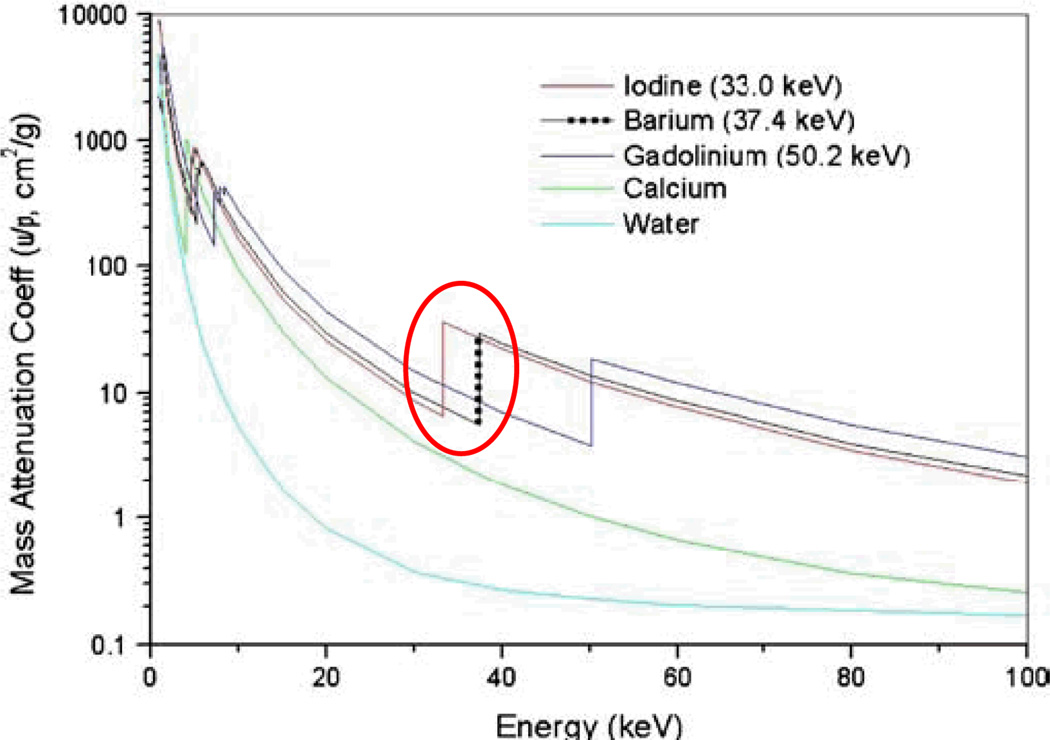
Our preliminary K-edge testing experiments used samples of iodine and barium sulfate imaged at 12 energy windows between 25 keV and 40 keV. Fig. 3 is an example of the iodine tube attenuation coefficient projection in one energy window, using equation (1). An average projection in a square region was calculated, which is proportional to the iodine solution attenuation coefficient in this energy window. The final attenuation-versus-energy plot is shown Fig. 4a. Using the same method, the attenuation-versus-energy plot of barium sulfate shown in Fig. 4b. From Fig. 4, one can see that the attenuation-versus-energy plots are consistent with the theoretical counterparts (Fig. 5). However, one may also notice wider K-edges compared to the theoretical counterparts. This is caused by the finite width of the energy window, the inaccurate relationship between the system threshold and the x-ray energy level. Nevertheless, the MARS micro-CT system provides significant attenuation information at different energy windows for the imaged materials, which can help to distinguish different material components in a way that is impossible using conventional x-ray CT systems.
Fig. 3.
Attenuation coefficient projection of the iodine sample (one energy window).
Fig. 4.
(a) and (b) are the attenuation-versus- energy plots of iodine and barium sulfate sample, respectively.
Fig. 5.
Theoretical attenuation-versus-energy of five representative materials.
3.2. Image Reconstruction
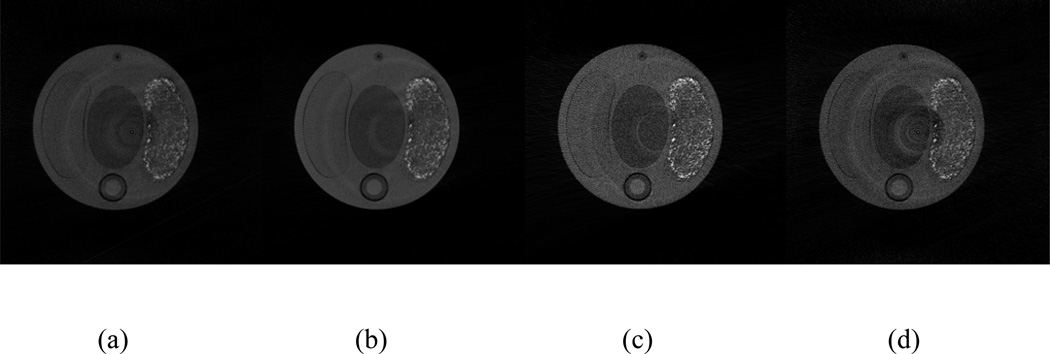
The aforementioned multi-material phantom is scanned at four energy thresholds (25 keV, 30 keV, 35 keV and 40 keV), and reconstructed by the OS-SART method. Recall that the energy threshold counts all incident photons at the defined energy and above. Fig. 6 shows the reconstructed images of the central slice in the four energy thresholds. Figs. 6a and 6b are the slices at 25 keV and 30 keV, respectively, which include the K-edge of iodine and barium. Fig. 6c is the slice above 35 keV, which only includes the K-edge of barium. Fig. 6d is the slice above 40 keV which doesn’t include a K-edge from either material. From Fig. 6, we can visually observe that the grey values of same material sub-regions are different, which reflects the dependency on the spectral detection of the material attenuation coefficients. Hence, it is possible to distinguish different materials despite having similar Hounsfield values.
Fig. 6.
Reconstructed images for one slice corresponding to energy thresholds: (a) 25 keV, (b) 30 keV, (c) 35 keV, and (d) 40 keV. The display window for all the images is [0, 0.015].
3.3. PCA Results
PCA has a better performance in evaluating the spectral dataset, and is applied to extract relevant information from the reconstruction images at four energy levels in Fig.6. The images corresponding to the first three maximum eigenvalues are shown in Figs. 7a–c; these images are linearly mapped into the RGB space to generate the true-color image in Fig. 7d, where there are several distinct material sub-regions in the image.
Fig. 7.
Three eigenimages (a–c) extracted from the four reconstruction images in Fig. 6, and the final true-color image (d).
4. Discussions and Conclusion
The geometry alignment is an indispensable step before the use of any CT system. If the CT geometry is not well aligned, the reconstructed images will suffer severe artifacts. For the geometry alignment of the MARS CT scanner, there are three major issues: (1) the initial detector array center does not coincide with the x-ray beam center; (2) the axis of the imaging sample isn’t the rotation axis of the MARS CT system, which is disassembly to upgrade hardware; (3) the detector size (14 mm×14 mm) is very small, and the detector array usually cannot cover the entire sample. To calibrate the detector array center to the x-ray beam center, we utilized the sinogram center offset to determine the detector array position. To obtain an untruncated sinogram, we combined several detector arrays at different positions to cover the whole imaging sample. The same procedure is repeated to reduce measurement errors.
There were a few defective/bad pixels in the Medipix detector array of the MARS system. These pixels generated salt-pepper noise in the projections, and resulted in artifacts in the reconstructed images. There were mainly two types of noise in our projections, and they appeared as vertical lines and highlights in a sinogram. A vertical line in the sinogram could introduce ring artifacts in the reconstructed images, and highlights in a sinogram could result in linear artifacts. Therefore, it is necessary to remove the noise in the sinograms before image reconstruction. To eliminate highlights in a sinogram, we first identified them according to grey value deviations among their neighboring pixels, and used the mean grey value of the neighboring pixels to replace the highlight pixels. To reduce vertical lines in a sinogram, a frequency filter method is employed [20]. Although this frequency filter could remove the vertical lines efficiently, some additional noise is introduced into the sinogram. To further suppress this noise, we calculated the noise level in a background sub-region, and subtracted it from the sinogram after the frequency filter step. In the spectral dataset analysis, the PCA method was applied to extract the first three eigenimages from the reconstruction images at different energy thresholds. This helped to reduce noise and artifact in the final true-color image (Fig. 7d).
For human vision, objects appear as different colors depending on the wavelength of reflected visible light; variations that are detectable in color images may disappear in corresponding grey images. For instance, it is very difficult to distinguish the autumn and spring leaf hues in grey images. Because the spectral/multi-energy CT can capture x-ray spectral attenuation information, and thus can be used to distinguish between materials that would otherwise be difficult or impossible to differential with conventional CT images. To render the reconstructed images at different energy thresholds, the PCA method was employed to extract the first three eigenimages, and the eignimages were linearly mapped as the R, G and B components in a color space. In the future, we will try more complicated PCA schemes to map the eignimages to the HSV color space based on the chromatology principle, which can adjust the principal component's brightness to help estimate the color information.
In conclusion, the MARS-CT system is an important platform for spectral CT research and development. Because this system can help to distinguish components in complicated substances, it has a great potential for pre-clinical and clinical applications, including but is not limited to tissue characterization and contrast studies. Preliminary experimental results are reported to demonstrate the utility of the MARS-CT system. We hope our experiences will be of utility to our peers, and further enhance the research and development of spectral CT.
Table 1.
Components of the multi-material phantom
| Material | Density(g/cm3) |
|---|---|
| Bone-equivalent Plastic | 1.50 |
| Soft-tissue-equivalent Plastic | 1.18 |
| Iodine Solution | 1.08 |
| Barium Sulfate | 4.50 |
| Paraffin Wax | 0.90 |
Acknowledgements
This work was partially supported by the NIH/NIBIB grant EB011785.
Appendix
Geometrical Alignment
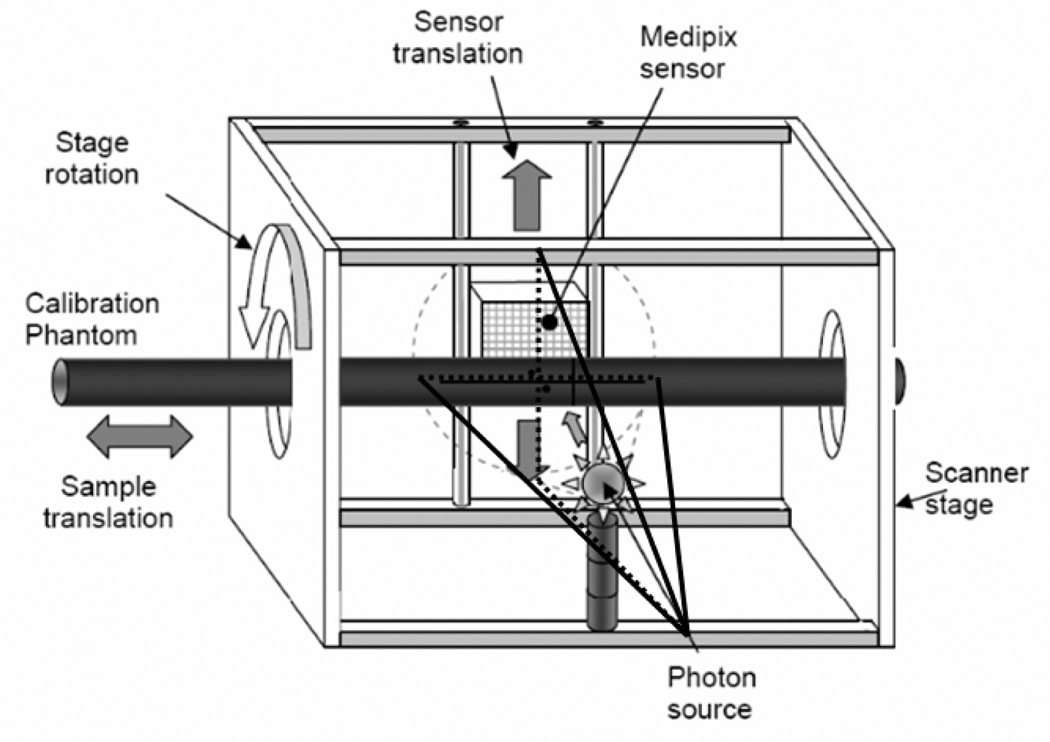
The MARS CT unit consists of a rotating gantry holding an x-ray source and a Medipix detector on two opposite sides of the rotational axis (see Fig. 8). Because the detector covers an area of 14 ×14 mm, the MARS system is in typical cone-beam geometry. Due to the inconsistency between the centers of the detector array and the x-ray beam, it is necessary for us to determine the relative positions among the x-ray source, the imaging object and the detector plane with physical phantoms (e.g. a metallic pin). First, we estimate the axis of rotation in the sinogram and find the horizontal central plane. Then, we calculate the distance from the x-ray source to the system origin and the distance from the system origin to the detector from various projections.
Fig. 8.
Sketch of the MARS CT system with a calibration phantom in place.
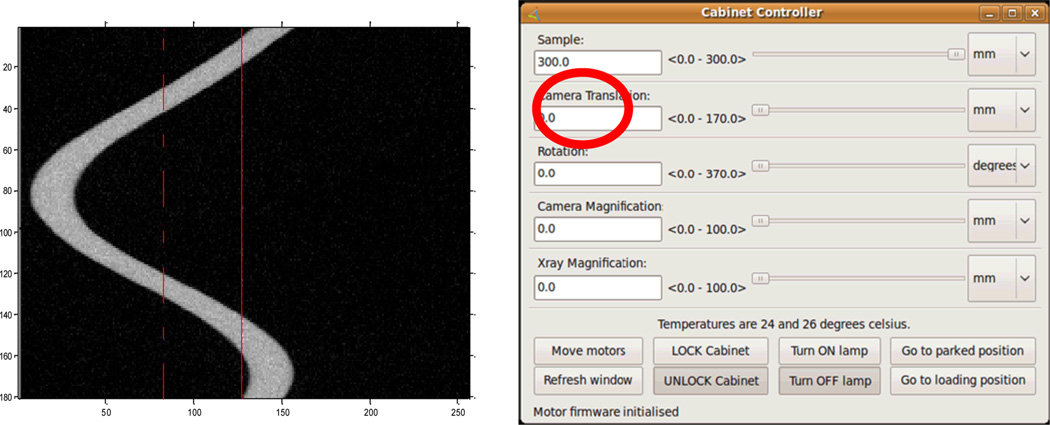
To determine the detector to axis distance and x-ray source to axis distance, we need to find the horizontal central plane and vertical central plane of the cone-beam geometry. Because the x-ray source and detector have been aligned and fixed in the rotating vertical plane, we can consider the vertical detector central plane is the rotating plane and only need to find the horizontal detector central plane. We extract the sinogram of an imaging slice and use it to approximately calibrate the detector position. Fig. 9a is a sinogram example captured by a full circular scan with a step of 2 degrees. While the solid line is the center of detector, the broken line is the center of the sinusoid. If the imaging slice is in the central plane of the cone-beam geometry, the sinusoid center should be the center of the x-ray beam. We can calculate the distance between the centers of sinusoid and the detector to adjust detector position (Camera Translation in Fig. 9b). After we calibrated the detector position, the horizontal center of the detector is the horizontal center of cone-beam geometry, and the Camera Translation in Fig. 9b is approximately 72.4 mm.
Fig. 9.
(a) Sinogram extracted from the circular full scan, and (b) the Cabinet Controller of the MARS system.
After we determined the horizontal central plane of the cone-beam geometry, we put a physical phantom (a metallic pin) in the vertical central plane containing the vertical central line of the detector array. To maintain the pin’s position in the vertical central plane of the cone-beam geometry, we used a wire to keep the pin vertical. Then, we calibrated the central line of the pin projections (Fig. 10) to position the vertical central line of the detector array; we used the detector position,x-ray source position and sample position to determine the detector to axis distance and x-ray source to axis distance. Fig. 11 is the geometry of detector position, x-ray source position and sample position when we fixed the x-ray source position. In Fig. 11, d1 is the distance between the x-ray source and the rotating axis, d2 is the distance from the detector to the rotating axis, h is the length of the pin, h1 and h2 are the lengths of pin in two different projections, and d3 is the distance of detector movement. Because the lengths of h, h1, h2 and d3 are measurable, we were able to use basic trigonometry to calculate d1 and d2 indirectly. To reduce measurement error, we first fixed the x-ray source position and moved the detector to 10 different positions, and calculated 10 groups of lengths of d1 and d2 (Table 2). Second, we fixed the detector position and moved the x-ray source to 10 different positions, and computed another 10 groups of lengths (Table 3).
Fig. 10.
The top and bottom projections of a metallic pin.
Fig. 11.
Geometry of detector position, x-ray source position and sample position when fixing the x-ray source position.
Table 2.
Measurement results when fixing the source position
| Source Position(SP) & Detector Position(DP) |
Source to Rotation Axis Distance |
Detector to Rotation Axis Distance |
|---|---|---|
| SP:0mm;DP:0mm | 114.134mm | 92.208mm |
| SP:0mm;DP:3mm | 114.492mm | 92.116mm |
| SP:0mm;DP:6mm | 115.570mm | 91.679mm |
| SP:0mm;DP:9mm | 115.029mm | 91.707mm |
| SP:0mm;DP:12mm | 114.376mm | 92.254mm |
| SP:0mm;DP:15mm | 113.732mm | 93.054mm |
| SP:0mm;DP:18mm | 114.421mm | 92.379mm |
| SP:0mm;DP:21mm | 113.832mm | 93.123mm |
| SP:0mm;DP:24mm | 115.081mm | 91.790mm |
| SP:0mm;DP:27mm | 114.203mm | 92.348mm |
Table 3.
Measurement results when fixing the source position
| Source Position(SP) & Detector Position(DP) |
Source to Rotation Axis Distance |
Detector to Rotation Axis Distance |
|---|---|---|
| SP:0mm;DP:0mm | 114.321mm | 92.786mm |
| SP:3mm;DP:0mm | 113.577mm | 93.260mm |
| SP:6mm;DP:0mm | 114.175mm | 92.319mm |
| SP:9mm;DP:0mm | 115.062mm | 91.952mm |
| SP:12mm;DP:0mm | 114.247mm | 92.235mm |
| SP:15mm;DP:0mm | 113.896mm | 93.117mm |
| SP:18mm;DP:0mm | 114.484mm | 92.206mm |
| SP:21mm;DP:0mm | 114.296mm | 93.130mm |
| SP:24mm;DP:0mm | 115.143mm | 91.208mm |
| SP:27mm;DP:0mm | 114.249mm | 92.701mm |
In Tables 2 & 3, the source position (SP) is the x-ray magnification and the detector position (DP) is the camera magnification (shown in Fig. 9b). Finally, we calculated the average distances according to Tables 2 & 3, which resulted in a source to axis distance of 114.4mm and a detector to axis distance of 92.4mm.
References
- 1.Alvarez RE, Macovski A. Energy-selective reconstructions in x-ray computerized tomography. Physics in Medicine and Biology. 1976;21(5):733–744. doi: 10.1088/0031-9155/21/5/002. [DOI] [PubMed] [Google Scholar]
- 2.Giersch J, Firsching M, Niederlohner D, Anton G. Material reconstruction with spectroscopic pixel X-ray detectors. Nuclear Instruments and Methods in Physics Research Section A. 2005;546(1–2):125–130. [Google Scholar]
- 3.Firsching M, Butler AP, Scott N, Anderson NG, Michel T, Anton G. Contrast agent recognition in small animal CT using the Medipix2 detector. Nuclear Instruments and Methods in Physics Research Section A. 2009;607(1):179–192. [Google Scholar]
- 4.Kinney JH, Nichols MC. X-ray tomographic microscopy (XTM) using synchrotron radiation. Annual Review of Materials Science. 1992;22:121–152. [Google Scholar]
- 5.Schultke E, Fiedler S, Nemoz C, Ogieglo L, Kelly ME, Crawford P, Esteve F, Brochard T, Renier M, Requardt H, Duc GL, Juurlink B, Meguro K. Synchrotron-based intra-venous K-edge digital subtraction angiography in a pig model: A feasibility study. European Journal of Radiology. 2010;73(3):677–681. doi: 10.1016/j.ejrad.2009.01.019. [DOI] [PubMed] [Google Scholar]
- 6.Ducote JL, Alivov Y, Molloi S. Imaging of nanoparticles with dual-energy computed tomography. Physics in Medicine and Biology. 2011;56(7):2031–2044. doi: 10.1088/0031-9155/56/7/008. [DOI] [PMC free article] [PubMed] [Google Scholar]
- 7.Graser A, Johnson TR, Chandarana H, Macari M. Dual energy CT:preliminary observations and potential clinical applications in the abdomen. European Radiology. 2009;19(1):13–23. doi: 10.1007/s00330-008-1122-7. [DOI] [PubMed] [Google Scholar]
- 8.Llopart X, Campbell M, Segundo DS, Pernigotti E, Dinapoli R. Medipix2: a 64-k pixel readout chip with 55-µm square elements working in single photon counting mode. IEEE Transactions on Nuclear Science. 2002;49(5):2279–2283. [Google Scholar]
- 9.Wang X, Meier D, Mikkelsen S, Maehlum GE, Wagenaar DJ, Tsui BMW, Patt BE, Frey EC. MicroCT with energy-resolved photon-counting Detectors. Physics in Medicine and Biology. 2011;56(9):2791–2816. doi: 10.1088/0031-9155/56/9/011. [DOI] [PMC free article] [PubMed] [Google Scholar]
- 10.Schlomka JP, Roessl E, Dorscheid R, Dill S, Martens G, Istel T, Bäumer C, Herrmann C, Steadman R, Zeitler G, Livne A, Proksa R. Experimental feasibility of multi-energy photon-counting K-edge imaging in pre-clinical computed tomography. Physics in Medicine and Biology. 2008;53(15):4031–4047. doi: 10.1088/0031-9155/53/15/002. [DOI] [PubMed] [Google Scholar]
- 11.Firsching M, Talla PT, Michel T, Anton G. Material resolving X-ray imaging using spectrum reconstruction with Medipix2. Nuclear Instruments and Methods in Physics Research A. 2008;591(1):19–23. [Google Scholar]
- 12.Manuilskiy A, Norlin B, Nilsson H-E, Frojdh C. Spectroscopy applications for the Medipix photon counting X-ray system. Nuclear Instruments and Methods in Physics Research A. 2004;531(1–2):251–257. [Google Scholar]
- 13.Andersen AH, Kak AC. Simultaneous Algebraic Reconstruction Technique (SART): a superior implementation of the ART algorithm. Ultrasonic Imaging. 1984;6(1):81–94. doi: 10.1177/016173468400600107. [DOI] [PubMed] [Google Scholar]
- 14.Wang G, Jiang M. Ordered-Subset Simultaneous Algebraic Reconstruction Techniques (OS-SART) Journal of X-ray Science and Technology. 2004;12(3):169–177. [Google Scholar]
- 15.Jiang M, Wang G. Convergence studies on iterative algorithms for image reconstruction. IEEE Transaction on Medical Imaging. 2003;22(5):569–579. doi: 10.1109/TMI.2003.812253. [DOI] [PubMed] [Google Scholar]
- 16.Yu H, Wang G. A soft-threshold filtering approach for reconstruction from a limited number of projections. Physics in Medicine and Biology. 2010;55(13):3905–3916. doi: 10.1088/0031-9155/55/13/022. [DOI] [PMC free article] [PubMed] [Google Scholar]
- 17.Jolliffe IT. Principal Components Analysis. 2rd edition. Springer-Verlag; 2002. [Google Scholar]
- 18.Kalukin AR, Van Geet M, Swennen R. Principal components analysis of multienergy x-ray computed tomography of mineral samples. IEEE Transaction on Nuclear Science. 2000;47(5):1729–1736. [Google Scholar]
- 19.Butler AP, Butzer J, Schleich N, Cook NJ, Anderson NG, Scott N, Ruiter N, Grasset R, Tlustos L, Butler PH. Processing of spectral X-ray data with principal components analysis. Nuclear Instruments and Methods in Physics Research A. 2011;633(1):140–142. [Google Scholar]
- 20.Raven C. Numerical removal of ring artifacts in microtomography. Review of Scientific Instruments. 1998;69(8):2978–2980. [Google Scholar]


