

Abstract
18F-fluorodeoxyglucose (FDG) positron emission tomography (PET) is often used in clinical routine for diagnosis, staging and response to therapy assessment or prediction. The Standardized Uptake Value (SUV) in the primary or regional area is the most common quantitative measurement derived from PET images used for those purposes. The aim of this study was to propose and evaluate new parameters obtained by textural analysis of baseline PET scans for the prediction of therapy response in esophageal cancer. Methods: 41 patients with a newly diagnosed esophageal cancer treated with combined radio-chemotherapy were included in this study. All patients underwent a pretreatment whole-body 18F-FDG PET scan. Patients were treated with radiotherapy and alkylatin-like agents (5FU-cisplatin or 5FU-carboplatin). Patients were classified as non-responders (NR: progressive or stable disease), partial-responders (PR) or complete-responders (CR) according to RECIST criteria. Different image derived indices obtained from the pretreatment PET tumor images were considered. These included usual indices such as SUVmax, SUVpeak, SUVmean, and a total of 38 features (such as for example entropy, size and magnitude of local and global heterogeneous and homogeneous tumor regions) extracted from the five different textures considered. The capacity of each parameter to classify patients with respect to response to therapy was assessed using the Kruskal-Wallis test (p-value < 0.05). Specificity and sensitivity (including 95% confidence intervals) for each of the studied parameters were derived using Receiver Operating Characteristic (ROC) curves. Results: Relationships between pairs of voxels, characterizing local tumor metabolic non-uniformities, were able to significantly differentiate all three patient groups (p<0.0006). Regional measures of tumor characteristics, such as size of non-uniform metabolic regions and corresponding intensity non-uniformities within these regions, were also significant factors for prediction to therapy (p=0.0002). ROC curve analysis showed that tumor textural analysis can provide NR, PR and CR patient identification with higher sensitivity (76%–92%) than any SUV measurement.
Conclusion
Textural features of tumor metabolic distribution extracted from baseline 18F-FDG PET images allow for the best stratification of esophageal carcinoma patient in the context of therapy response prediction.
Keywords: Aged; Aged, 80 and over; Antineoplastic Combined Chemotherapy Protocols; therapeutic use; Carboplatin; administration & dosage; Cisplatin; administration & dosage; Combined Modality Therapy; Esophageal Neoplasms; radionuclide imaging; therapy; Female; Fluorodeoxyglucose F18; diagnostic use; Fluorouracil; administration & dosage; Humans; Image Enhancement; methods; Image Interpretation, Computer-Assisted; Male; Middle Aged; Positron-Emission Tomography; Prognosis; Radiopharmaceuticals; diagnostic use; Radiotherapy, Conformal; Reproducibility of Results; Sensitivity and Specificity; Treatment Outcome
Keywords: 18F-FDG PET, esophageal cancer, texture analysis, predictive value, response to therapy
Introduction
Esophageal cancer is associated with high mortality. In patients with early stage disease at presentation, esophagectomy is the treatment of choice and is potentially curative. Unfortunately most patients at presentation have already locally advanced esophageal cancer (LAEC) or distant metastases. In LAEC, preoperative chemotherapy or radio-chemotherapy will improve survival in patients who respond to induction therapy (1,2). On the other hand, patients who do not respond to neoadjuvant therapy may be affected unnecessarily by the toxicity of an inefficient therapy. Therefore the development of a diagnostic test capable of predicting non-invasively response to therapy early in the course of treatment is of great interest, potentially allowing personalization of patient management. In patients treated by exclusive conventional combined radio-chemotherapy, assessment of response is equally of great interest, since it could allow an early change in the management of non-responding patients. Such assessment becomes more critical when one considers the availability of new targeted therapies that could be tested with higher efficiency if applied early in diagnosis (3,4).
18F-FDG Positron Emission Tomography (PET) is already well established for the initial staging of esophageal cancer, since it is associated with a better sensitivity and specificity than combined use of CT and echo-endoscopy especially regarding detection of distant metastasis (5).
18F-FDG PET imaging has been also used to assess response to therapy and patient outcome prognosis (4,6). Within this context, few studies have explored the potential prognostic value of a pre-treatment 18F-FDG PET scan, demonstrating that the level of activity concentration on pre-operative PET, although not statistically significant, tends to predict overall survival (7–9).
On the other hand, several studies have evaluated the role of PET in assessing treatment response based on FDG uptake changes between a pre- and a post-treatment PET scan performed during or after the treatment completion. Studies considering a second PET scan after treatment completion have shown that a complete metabolic response is associated with better outcome (10–12). However, since that information is of limited interest in patient management if acquired late, different attempts have been made to determine whether 18F-FDG PET could be used for assessing response to therapy earlier (usually within a few weeks) in the course of treatment (13–15), showing some promising results that need to be confirmed in multicenter trials (4). One of the highlighted issues is that early response prediction during combined chemo-radiotherapy, in contrast to chemotherapy alone, may be compromised by increased FDG tumor uptake resulting from radiotherapy induced inflammatory processes (4).
An alternative to monitoring changes during treatment is the potential of predicting response to therapy from the baseline 18F-FDG PET scan alone, which may allow the best available therapy regime to be chosen for a given patient. However, to date there is only limited evidence that a measure of tumor activity concentration in a baseline PET scan in esophageal cancer can allow differentiating between different groups of patient response (8,9). Within the same context, parameters derived from pre-treatment 18F-FDG PET has shown the potential to differentiate between responders and non-responders in non-Hodgkin lymphoma patients (16).
The PET image index predominantly used in such studies for assessment of metabolic response is the normalized mean tumor activity concentration known as the mean Standardized Uptake Value (SUVmean), within a region of interest (ROI) around the tumor, and/or the maximum standardized uptake value corresponding to the highest activity pixel value (SUVmax). However, FDG tumor uptake has been associated not only with increased metabolism, but also with several other physiological parameters such as perfusion, cell proliferation (17), tumor viability, aggressiveness or hypoxia (18, 19) all of which may in turn be responsible for tumor uptake heterogeneity. Therefore the hypothesis can be made that characterizing tumor FDG distribution, through its relationship to underlying tumor biological characteristics, may be useful in predicting therapy response. FDG tumor activity distribution may be assessed in a global, regional, and/or local fashion allowing in turn assessing corresponding global, regional or local patterns of biological heterogeneity. Although the measurement of such features have been previously explored in anatomical imaging (20–22), they have not to date been widely used in PET imaging. Until now only one study has considered the use of some textural features to predict treatment outcome from baseline 18F-FDG PET images with encouraging results in cervix and head and neck cancer (23), while the assessment of spatial heterogeneity was also shown to be significantly associated with survival in sarcoma patients (24). However, the potential predictive value of tumor heterogeneity characterization on a baseline 18F-FDG PET scan has never been assessed.
The objective of this current study was therefore to assess the predictive value of FDG uptake heterogeneity characterized by textural features extracted from pre-therapy 18F-FDG PET images of patients with esophageal carcinoma by assessing the ability of each parameter to identify different categories of responders. The predictive value of these parameters was compared to the use of standard image activity concentration indices (SUVmax, SUVmean). The potential prognostic value of such image derived parameters for assessing overall patient survival was not assessed in this study.
Materials and Methods
Patients
41 patients with a newly diagnosed esophageal cancer treated with exclusive radio-chemotherapy between 2003 and 2008 were included in this study. The characteristics of the patients are summarized in table 1. The mean age at the time of diagnosis was 66±10 years and 85% of patients were male. Most of the tumors were squamous cell carcinoma (76%) and most of the patients had a well or moderately differentiated tumor (56%). The majority of the tumors originated from the middle and lower esophagus (76%). 26 patients had a T3 or T4 primary lesion, 25 had N1 (61%) lymph node metastases and 17 had distant metastases (see table 1). All patients were treated with external beam radiotherapy and chemotherapy with alkylatin-like agents (5FU-cisplatin or 5FU-carboplatin). A median radiation dose of 60Gy was delivered in 180cGy daily fractions (5 days a week and 6–7 weeks in total). One month after the completion of the treatment, patients were reassessed in order to determine response to therapy using thoraco-abdominal CT and endoscopy. Patients were subsequently classified as complete responders (CR), partial responders (PR), stable disease (SD) or progressive disease (PD). Response was assessed using pre-treatment and post-treatment CT scans by evaluating the increase (or decrease) in the sum of the longest diameters for all target lesions and the appearance, persistence or disappearance of non-target lesions, according to the RECIST criteria (25). Considering the small number of patients in the SD (7) and PD (4) groups, these patients were eventually combined into one non-responders group (NR).
Table 1.
Patients Characteristics
| Characteristics | All patients N=41 (%) |
|---|---|
| Sex | |
| Male | 35 (85) |
| Female | 6 (15) |
| Age at diagnosis | |
| Median | 69 |
| Range | 45–84 |
| Primary Site | |
| Upper esophagus | 10 (24) |
| Middle esophagus | 15 (37) |
| Lower esophagus | 16 (39) |
| Tumor Cell Type | |
| Squamous cell carcinoma | 31 (76) |
| Adenocarcinoma | 10 (24) |
| Histologic grade | |
| Well differentiated | 12 (29) |
| Moderately differentiated | 11(27) |
| Poorly differentiated | 3 (7) |
| Unknown | 15 (37) |
| TNM stage | |
| T1 | 6 (15) |
| T2 | 7 (17) |
| T3 | 21 (51) |
| T4 | 7 (17) |
| N0 | 16 (39) |
| N1 | 25 (61) |
| M0 | 24 (59) |
| M1 | 17 (41) |
| AJCC stage | |
| I | 4 (10) |
| IIa | 6 (15) |
| IIb | 5 (12) |
| III | 12 (29) |
| IVa | 4 (10) |
| IVb | 10 (24) |
| RECIST | |
| CR | 9 (22) |
| PR | 21 (51) |
| SD (NR) | 7 (17) |
| PD (NR) | 4 (10) |
CR: complete responder. PR: partial responder. SD: stable disease. PD: progressive disease. NR: non-responder
All patients underwent a pre-treatment whole-body 18F-FDG PET scan for staging purposes. Patients were instructed to fast for a minimum of six hours before the injection of 18F-FDG. The dose of administered 18F-FDG was 5 MBq/kg, and static emission images were acquired from thigh to head, on average 54 minutes after injection, on a Philips GEMINI PET/CT (Philips Medical Systems, Cleveland, OH USA). In addition to the emission PET scan, a low dose CT scan was acquired for attenuation correction purposes. Images were reconstructed with the RAMLA 3D algorithm using standard clinical protocol parameters (2 iterations, relaxation parameter of 0.05 and a 5mm FWHM 3D Gaussian post-filtering). The current data analysis was carried out after an approval by the institutional review board.
Tumor analysis
For each patient primary tumors were identified on 18F-FDG PET images by an experienced nuclear physician. Tumor delineation was then performed automatically using the previously validated Fuzzy Locally Adaptive Bayesian (FLAB) algorithm (26). All parameters were subsequently extracted from this delineated volume. Only the primary tumors were considered because texture analysis cannot be reliably performed on small lesions (nodal or distant metastases) due to the small number of voxels involved.
SUV analysis
The following SUV parameters were extracted from each patient’s baseline PET images: maximum SUV (SUVmax), peak SUV (SUVpeak) defined as the mean of the voxel of maximum value and its 26 neighbors (in 3D), and mean SUV within the delineated tumor (SUVmean). The SUVpeak was considered in addition to SUVmax in order to investigate the impact of reducing the potential bias in the SUVmax measurements as a result of its sensitivity to noise.
Texture analysis
We define as texture a spatial arrangement of a predefined number of voxels allowing the extraction of complex image properties, and a textural feature as a measurement computed using a texture matrix. The method used was realized in two steps. First, matrices describing textures on images were extracted from tumors and textural features were subsequently computed using theses matrices. All these parameters characterize in some way tumor heterogeneity at local and regional (using texture matrices) or global scales (using image voxel intensity histograms).
A number of different textures listed on table 2 (left column) were computed. Voxel values within the segmented tumors (see figure 1(A) and 1(B)) were resampled to yield a finite range of values (see figure 1(C)) allowing texture analysis using:
| (1) |
where, 2S represents the number of discrete values (16 to 128), I is the intensity of the original image and Ω is the set of voxels in the delineated volume. This resampling step on the delineated tumor volume, necessary for the computation of the textural analysis, has two effects: it reduces the noise in the image by clustering voxels with similar intensities and it normalizes the tumor voxel intensities across patients, which in turn facilitates the comparison of the textural features. Local and regional features were computed with different resampling considering 16, 32, 64 and 128 discrete values to investigate the potential impact of this resampling parameter.
Table 2.
Texture type and associated features
| Texture | Feature | Scale |
|---|---|---|
| Features based on intensity histogram | Minimum intensity | Global |
| Maximum intensity | ||
| Mean intensity | ||
| Variance | ||
| Standard deviation | ||
| Skewness | ||
| Kurtosis | ||
|
| ||
| Features based on voxels alignment matrix M2 | Short Run Emphasis | Regional |
| Long Run Emphasis | ||
| Intensity Variability | ||
| Run-Length Variability | ||
| Run Percentage | ||
| Low-Intensity Run Emphasis | ||
| High-Intensity Run Emphasis | ||
| Low-Intensity Short-Run Emphasis | ||
| High-Intensity Short-Run Emphasis | ||
| Low-Intensity Long-Run Emphasis | ||
| High-Intensity Long-Run Emphasis | ||
|
| ||
| Features based on Intensity-Size-Zone matrix M4 | Short Zone Emphasis | Regional |
| Large Zone Emphasis | ||
| Intensity Variability | ||
| Size-Zone Variability | ||
| Zone Percentage | ||
| Low-Intensity Zone Emphasis | ||
| High-Intensity Zone Emphasis | ||
| Low-Intensity Short-Zone Emphasis | ||
| High-Intensity Short-Zone Emphasis | ||
| Low-Intensity Large-Zone Emphasis | ||
| High-Intensity Large-Zone Emphasis | ||
|
| ||
| Features based on the co-occurrence matrices M1 | Second angular moment | Local |
| Contrast (Inertia) | ||
| Entropy | ||
| Correlation | ||
| Homogeneity | ||
| Dissimilarity | ||
|
| ||
| Features based on neighborhood Intensity-Difference Matrix M3 | Coarseness | Local |
| Contrast | ||
| Busyness | ||
Figure 1.

(A). Whole-body 18F-FDG PET scan (B). tumor segmentation (C). voxel intensity resampling allowing (D). the extraction of different features by analysis of (a). consecutive voxels in a direction (for co-occurrence matrices), (b). alignment of voxels with same intensity, (c). difference between voxels and its neighbors, and (d). zones of voxels with the same intensity.
All considered textures were originally described for 2D (27–30) and were therefore adapted in this work for 3D. The co-occurrence matrix (M1, figure 1(D)a) describing pair-wise arrangement of voxels, and the matrix describing the alignment of voxels with same intensity (M2, figure 1(D)b) were computed considering 13 different angular directions. Finally, 3D matrices describing differences between each voxel and its neighbors (M3, figure 1(D)c) and characteristics of homogenous zones (M4, figure 1(D)d) were computed considering for each voxel the neighbors in the two adjacent planes adapting the normalizing factors to 3D.
From each of the extracted texture matrices, different features summarized in table 2 (middle column) were computed. Depending on the way the matrix is analyzed, it is possible to extract features of local or regional nature. Six features highlighting local variations of voxel intensities within the image were extracted from the co-occurrence matrices M1 (see figure 2C). For example, using the matrices M1, the local entropy and homogeneity are calculated using equations (2) and (3) respectively:
| (2) |
| (3) |
where, M1 is a co-occurrence matrix, i, j, are the rows and columns index and M1(i,j) is an element of the matrix.
Figure 2.

Examples of features extracted from a tumor resampled on 4 values: three global features computed using the intensity histogram, two regional features computed using the M4 matrix and two local features computed using the M1 texture matrices.
In addition, M3 matrices were used to extract busyness (quantifying sharp intensity variations), as well as contrast and coarseness (quantifying tumor granularity). These features allow extracting measurements describing tumor local heterogeneity proportional to variations of FDG uptake between individual voxels.
On the other hand, the M2 and M4 matrices were used to extract regional tumor uptake characteristics, representing regional heterogeneity such as variation of intensity between regions as well as in the size and alignment of homogeneous areas. For example, the M4 matrix links the homogeneous tumor regions to their intensity (see figure 2B). It was hence used to calculate the variability in the size and the intensity of identified homogenous tumor zones according to equations (4) and (5) respectively:
| (4) |
| (5) |
where, Θ represents the number of homogeneous areas in the resampled tumor, M the number of distinct intensity values within the tumor and N the size of the largest homogeneous area in the matrix M4.
Finally, global features are computed on the original image voxels intensity distribution by analyzing the characteristics of the intensity values histogram within the segmented tumor (see figure 2A).
A total of 38 features were extracted from the four different texture matrices and intensity histograms. Seven characterize the uptake distribution within the entire tumor (using the intensity histogram), while nine describe local voxel arrangements (using matrices M1 and M3), and 22 are related to the organization of voxels at a regional scale (using matrices M2 and M4).
Statistical Analysis
The capacity of each feature to classify patients with respect to therapy response was investigated on the primary tumor using the Kruskal-Wallis test (8). P-values <0.05 were considered statistically significant. Specificity and sensitivity (including 95% confidence intervals, CI) for each of the studied parameters were derived using Receiver Operating Characteristic (ROC) curves measuring associated areas under the ROC curves (AUC). Textures results were compared to those of SUVmax, SUVmean and SUVpeak for their ability to distinguish between responders (PR and CR) and non responders, between CR and non-CR (PR, NR), and between all three groups separately.
Results
Patients were evaluated one month after the completion of combined radio-chemotherapy. 9 patients (22%) had no evidence of disease after treatment and were considered as complete responders. Radio-chemotherapy led to partial response in 21 (51%) patients, while 11 (27%) were stable or progressed under treatment according to the RECIST criteria (25).
Results of the Kruskal-Wallis test show that SUVmax (see figure 3) and SUVmean were capable of only differentiating CR from NR and PR patients. Within this context all SUV measurements were significant predictive factors of response (p=0.034, 0.044 and 0.012 for the SUVmax, SUVmean and SUVpeak respectively). However, only SUVpeak was a significant predictive factor (p=0.045) when considering the differentiation of three patient response groups (i.e. NR, PR and CR), while SUVmax and SUVmean were not (p>0.05).
Figure 3.

Box-plot representation of parameters values in function of patient response (0: non-responder, 1: partial responder, 2: complete responder) for (a). SUVmax (p=0.106), (b). SUVpeak (p=0.045), (c). local entropy (p=0.0006), (d). regional intensity variability (p=0.0002).
Figure 4 shows examples of different extracted features and associated values for tumors of complete, partial and non-responding patients. The Kruskal-Wallis tests revealed no statistically significant differences in the textural parameters derived using different resampling values (16, 32, 64 or 128 discrete values). All subsequent reported results were obtained using 64 discrete values in the resampling normalisation process. This value was chosen as it allows for 0.25 SUV increments which were considered sufficient given the range of SUV values encountered (from ~4 to 20).
Figure 4.

An example of different extracted features and associated values for tumors of complete, partial and non-responding patients (results are normalized in the [0–1] interval using the range of observed values for local and regional parameters).
None of the global features extracted from the intensity histogram within the tumor was a significant predictive factor of response to therapy. However, considering local variation of FDG uptake, a high predictive value (p<0.0007) was found using the co-occurrence features, particularly considering the use of the average feature values computed using M1 matrices (see table 3). All these features offered statistically significant differentiation of non-responders and responders (considering both CR and PR).
Table 3.
Sensitivity and specificity (along with the corresponding 95% CI) of three SUV based measurements, two co-occurrence features and two size-zone features. On the top: evaluation of parameters to distinguish PR or CR, on the bottom: evaluation of parameters to differentiate complete responders
| Parameters | Sensitivity (%) | 95% CI (%) | Specificity (%) | 95% CI (%) | |
|---|---|---|---|---|---|
| NR vs. PR+CR | SUVmax | 53 | [35.1–70.2] | 73 | [39.0–94.0] |
| SUVmean | 71 | [52.5–84.9] | 45 | [16.7–76.6] | |
| SUVpeak | 56 | [37.9–72.8] | 73 | [39.0–94.0] | |
| Local Homogeneity | 88 | [71.8–96.6] | 73 | [39.0–94.0] | |
| Local Entropy | 79 | [61.1–91.0] | 82 | [48.2–97.7] | |
| Size-zone variability | 76 | [58.8–89.8] | 91 | [58.7–99.8] | |
| Intensity variability | 76 | [58.7–89.3] | 91 | [58.7–99.8] | |
|
| |||||
| NR+PR vs. CR | SUVmax | 46 | [19.2–74.9] | 91 | [75.0–98.0] |
| SUVmean | 62 | [31.6–86.1] | 81 | [63.6–92.8] | |
| SUVpeak | 62 | [31.6–86.1] | 81 | [63.6–92.8] | |
| Local Homogeneity | 92 | [61.5–99.8] | 56 | [37.7–73.6] | |
| Local Entropy | 92 | [61.5–99.8] | 69 | [50.0–83.9] | |
| Size-zone variability | 92 | [64.0–99.8] | 69 | [50.0–83.9] | |
| Intensity variability | 85 | [54.6–98.1] | 75 | [56.6–88.5] | |
Regarding local features, the busyness and contrast computed on M3 matrices were not statistically significant predictive factors of response but the coarseness, reflecting the local granularity of the tumor functional image, was found to be significant (p=0.0002). Amongst the local measures of functional tumor characteristics computed using M1 matrices the measure of local entropy was the only one allowing statistically significant differentiation of all three patient groups (p=0.0006, see figure 3).
Since the features computed on M2 and M4 matrices, used to highlight regional variability in the FDG distribution, were strongly correlated (r>0.9), only features based on M4 were used in the subsequent analysis. Regional measures of tumor characteristics extracted from these M4 matrices, such as the variability in the size and the intensity of identified homogenous tumor zones were statistically significant in predicting therapy response (p=0.0002) allowing to differentiate all three patient response groups (see figure 3).
The ROC curve analysis for SUVmax, SUVpeak, local homogeneity, local entropy, and regional tumor characteristics such as the variability in size and intensity of identified homogeneous tumor areas are presented in figure 5. Table 3 summarizes the ROC curve analysis results comparing the performance of the different studied parameters in terms of sensitivity and specificity in identifying on the one hand complete response patients and on the other differentiate responders (PR and CR).
Figure 5.
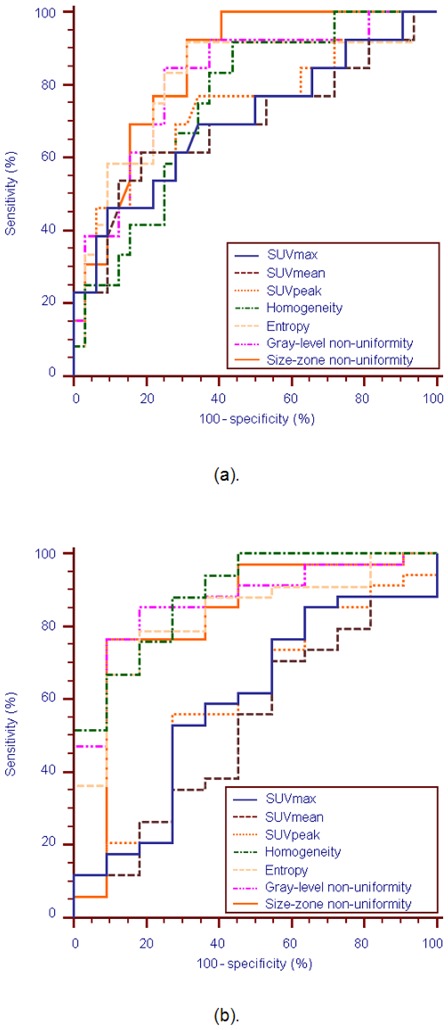
ROC curves for the SUVmax, SUVmean, SUVpeak, local homogeneity, uniform tumor areas intensity variability and size-zone variability, for identification of (a). CR patients, and (b). responders (PR or CR)
Firstly, based on the ROC curve analysis textural parameters can identify CR patients better than the SUV based measurements, as demonstrated by the respective AUCs (figure 5). For example, SUVmax, with an AUC=0.7, allowed indentifying CR with a maximum sensitivity of 46% and specificity of 91% using a threshold of 6. On the other hand, the variability in the size of the uniform tumor zones (AUC=0.85) allowed extracting CR patients with the best accuracy (sensitivity of 92% and specificity of 69%).
Secondly, as figure 5 shows, textural features were most efficient in identifying responders (CR and PR patients), while for the same task the performance of SUV measurements was limited. For the differentiation of the patient responders the AUC was <0.6 for the different SUV parameters considered in comparison to an AUC of >0.82 for the use of the texture parameters. For example, the AUC of the SUVmax was 0.59 allowing a sensitivity of 53% and specificity of 73% in the differentiation of responders using an optimal threshold of 9.1. On the other hand, for the same task the local homogeneity had a specificity and sensitivity of 88% and 73% respectively (AUC=0.89).
Discussion
Assessment of tumor response to therapy plays a central role in drug development as well as in patient clinical management. Currently the response is mainly assessed by measuring anatomical tumor size and classifying tumor shrinkage according to standard criteria. Since metabolic changes often occur before morphological changes, metabolic imaging appears to be a valuable tool for monitoring various treatments in different cancer types. Within this context 18F-FDG PET has shown promising results in assessing response to therapy and prognosis. In esophageal cancer, quantitative changes in FDG uptake two weeks after the start of therapy have been shown to correlate well with subsequent tumor shrinkage and patient survival (4). This approach has still limitations especially if patients undergo radiotherapy treatment. Hautzel et al. have shown that even low irradiation may enhance tumor uptake and inflammatory changes may contribute very early to this increase, yielding inaccurate information about treatment response (31). Within the same context, induced ulceration may also impair response assessment using PET (32).
On the other hand, the prediction of response prior to treatment initiation may be of great interest optimizing patient management. With such an endpoint few authors have studied the predictive value of initial FDG uptake for therapy response. Rizk et al. reported an SUVmax more than 4.5 to be a reliable predictor of pathologic response (9), while Javeri et al. (8) demonstrated in a larger group of patients a trend of greater rate of response obtained after combined chemo-radiotherapy in patients who had an initial SUVmax higher than 10. Similarly in our study, initial SUVmean, SUVmax and SUVpeak were also predictors of complete response. However, in general these indices did not allow differentiating non-responding patients from partial responders, a distinction that could be useful for patient management. For instance, within the patient population of our study the identification of partial responders before any treatment could allow the definition of a subpopulation for which the use of conventional radio-chemotherapy should be directly replaced by another option, such as for example a new targeted therapy.
A few studies have already focused on the link between image analysis and tumor biological parameters. Gillies et al. (33) suggested that imaging can longitudinally characterize spatial variations in the tumor phenotype and its microenvironment so that the system dynamics over time can be quantitatively captured. Segal et al. (22) showed that contrast-enhanced CT image characteristics (such as texture heterogeneity score or estimated percentage of necrosis correlate with most of the liver global gene expression profiles, revealing cell proliferation, liver synthetic function, and patient prognosis. Within the same context, Diehn et al. (34) mapped neuroimaging parameters with gene-expression patterns in glioblastoma, while Strauss et al (35) combined dynamic PET kinetic parameters with gene array techniques. Finally, Eary et al. (20) previously demonstrated that a globally assessed FDG distribution heterogeneity in sarcoma is a potential prognostic factor.
In our study, the value of textural feature analysis was explored on the pre-treatment 18F-FDG PET scans for predicting response to combined chemo-radiotherapy. Global tumor metabolic features based on intensity histogram were computed directly on the original image. As such they were therefore highly correlated with FDG uptake which could explain why these textures could only predict complete responders but could not identify non-responders from partial responders similarly to SUV measurements. The other features evaluated in this study highlight tumor heterogeneity at a local and regional level, characterized in several ways depending on the type of matrix used and the kind of feature computed on this matrix. Consequently, whereas a single feature cannot be directly linked to a specific biological process, one could assume that a combination of textural parameters may be closely related to underlying physiological processes, such as vascularization, perfusion, tumor aggressiveness or hypoxia (18,19). Therefore textural features could be correlated to physiological processes related with response of combined radio-chemotherapy. For example, one could reasonably expect that a tumor exhibiting a heterogeneous, in comparison to a homogeneous, FDG distribution may respond less favorably to a uniformly distributed radiotherapy dose. We could also hypothesize that underlying neoangiogenesis contributes to tumor FDG uptake heterogeneity while it is now widely accepted that neoangiogenesis is associated with reduced effectiveness of conventional chemotherapy. However the exact relationship between the proposed image derived indices and underlying tumor biology can only be established on carefully designed prospective studies.
In this work, the co-occurrences features analyzing inter-relationships between pairs of voxels, corresponding to the characterization of local non-uniformities, were able to significantly differentiate non-responders from other patient groups. The measurement of local homogeneity and entropy gave the best results for this class of textures. Although in most of the cases responders (PR and CR) were associated with greater local heterogeneity than NR, these features were less efficient in discriminating CR from PR.
The two features facilitating the best patient stratification were both associated with regional tumor characterization. Both the intensity and size variability of uniform zones identified within the tumor, representing a measure of regional tumor heterogeneity, were significant predictors of response to therapy. ROC curve analysis showed that these features can identify NR patients with similar performance to co-occurrences features, but they can in addition distinguish between PR and CR with higher sensitivity and specificity than SUV measurements. These results suggest that regional (in terms of intensity and size of homogenous areas) rather than local heterogeneity offers a superior differentiation of esophageal carcinoma patient groups in terms of response to combined chemo-radiotherapy treatment than any other global tumor metabolic activity measurement currently used in routine clinical practice, such as SUVs.
A limitation of the present study is that it is retrospective considering a relatively small patient cohort. Therefore the potential of new image derived indices characterizing tumor FDG distribution for prediction of response to therapy studies demonstrated in this work, need to be validated by a prospective study on a larger patient cohort.
Conclusion
We have demonstrated that textural analysis of the intra-tumor tracer uptake heterogeneity on baseline 18F-FDG PET scans can predict response to combined chemo-radiation treatment in esophageal cancer. Textural features derived from co-occurrence matrices strongly differentiated non-responders from partial responders, providing useful information for personalizing patient management. These results suggest that regional and local characterization of 18F-FDG PET tracer heterogeneity in tumors, exploring processes underlying the FDG uptake and distribution within tumors, are more powerful than global measurements currently employed in clinical practice, holding the potential to revolutionize the predictive role of PET imaging in cancer treatment. Finally, although only FDG images in esophageal cancer have been considered here, clearly the same indices applied in other PET radiotracer studies in the same or different tumor types may help creating even stronger links between imaging and underlying tumor biology.
Acknowledgments
This study was supported by a grant from the Ligue Contre le Cancer (Finistère and Côtes d’Armor Committees), and the IFR148-ScInBioS. One of us (Florent Tixier) is supported by a fellowship from the French Ministry of Education and Research.
References
- 1.Gebski V, Burmeister B, Smithers BM, et al. Survival benefits from neoadjuvant chemoradiotherapy or chemotherapy in oesophageal carcinoma: a meta-analysis. Lancet Oncol. 2007;8:226–234. doi: 10.1016/S1470-2045(07)70039-6. [DOI] [PubMed] [Google Scholar]
- 2.Cunningham D, Allum WH, Stenning SP, et al. MAGIC Trial Participants: Perioperative chemotherapy versus surgery alone for resectable gastroesophageal cancer. N Engl J Med. 2006;355:11–20. doi: 10.1056/NEJMoa055531. [DOI] [PubMed] [Google Scholar]
- 3.Di Fabio F, Pinto C, Rojas Llimpe FL, et al. The predictive value of 18F-FDG PET early evaluation in patients with metastatic gastric adenocarcinoma treated with chemotherapy plus cetuximab. Gastric Cancer. 2007;10:221–227. doi: 10.1007/s10120-007-0438-3. [DOI] [PubMed] [Google Scholar]
- 4.Krause BJ, Herrmann K, Wieder H, zum Büschenfelde CM. 18F-FDG PET and 18F-FDG PET/CT for Assessing Response to Therapy in Esophageal Cancer. J Nucl Med. 2009;50:89S–96S. doi: 10.2967/jnumed.108.057232. [DOI] [PubMed] [Google Scholar]
- 5.van Westreenen H, Westerterp M, Bossuyt P, et al. Systematic Review of the Staging Performance of 18F-Fluorodeoxyglucose Positron Emission Tomography in Esophageal Cancer. J Clin Oncol. 2004;22:3805–3812. doi: 10.1200/JCO.2004.01.083. [DOI] [PubMed] [Google Scholar]
- 6.Ben-Haim S, Ell P. 18F-FDG PET and PET/CT in the Evaluation of Cancer Treatment Response. J Nucl Med. 2009;50:88–99. doi: 10.2967/jnumed.108.054205. [DOI] [PubMed] [Google Scholar]
- 7.Rizk N, Downey RJ, Akhurst T, et al. Preoperative 18FDG positron emission tomography standardized uptake values predict survival after esophageal adenocarcinoma resection. Ann Thorac Surg. 2006;81(3):1076–1081. doi: 10.1016/j.athoracsur.2005.09.063. [DOI] [PubMed] [Google Scholar]
- 8.Javeri H, Xiao L, Rohren E, et al. Influence of the baseline 18FDG positron emission tomography results on survival and pathologic response in patients with gastroesophageal cancer undergoing chemoradiation. Cancer. 2009;115(3):624–630. doi: 10.1002/cncr.24056. [DOI] [PubMed] [Google Scholar]
- 9.Rizk NP, Tang L, Adusumilli PS, et al. Predictive value of initial PET SUVmax in patients with locally advanced esophageal and gastroesophageal junction adenocarcinoma. J Thorac Oncol. 2009;4(7):875–879. doi: 10.1097/JTO.0b013e3181a8cebf. [DOI] [PubMed] [Google Scholar]
- 10.Flamen P, Van Cutsem E, Lerut A, et al. Positron emission tomography for assessment of the response to induction radiochemotherapy in locally advanced oesophageal cancer. Ann Oncol. 2002;13:361–368. doi: 10.1093/annonc/mdf081. [DOI] [PubMed] [Google Scholar]
- 11.Downey RJ, Akhurst T, Ilson D, et al. Whole body 18FDG-PET and the response of esophageal cancer to induction therapy: results of a prospective trial. J Clin Oncol. 2003;21:428–432. doi: 10.1200/JCO.2003.04.013. [DOI] [PubMed] [Google Scholar]
- 12.Kim MK, Ryu JS, Kim SB, et al. Value of complete metabolic response by 18F-fluorodeoxyglucose-positron emission tomography in oesophageal cancer for prediction of pathologic response and survival after preoperative chemoradiotherapy. Eur J Cancer. 2007;43:1385–1391. doi: 10.1016/j.ejca.2007.04.001. [DOI] [PubMed] [Google Scholar]
- 13.Weber WA, Ott K, Becker K, et al. Prediction of response to preoperative chemotherapy in adenocarcinomas of the esophagogastric junction by metabolic imaging. J Clin Oncol. 2001;19:3058–3065. doi: 10.1200/JCO.2001.19.12.3058. [DOI] [PubMed] [Google Scholar]
- 14.Lordick F, Ott K, Krause BJ, et al. PET to assess early metabolic response and to guide treatment of adenocarcinoma of the oesophagogastric junction: the MUNICON phase II trial. Lancet Oncol. 2007;8:797–805. doi: 10.1016/S1470-2045(07)70244-9. [DOI] [PubMed] [Google Scholar]
- 15.Ott K, Weber WA, Lordick F, et al. Metabolic imaging predicts response, survival, and recurrence in adenocarcinomas of the esophagogastric junction. J Clin Oncol. 2006;24:4692–4698. doi: 10.1200/JCO.2006.06.7801. [DOI] [PubMed] [Google Scholar]
- 16.Cazaentre T, Morschhauser F, Vermandel M, et al. Pre-therapy 18F-FDG PET quantitative parameters help in predicting the response to radioimmunotherapy in non-Hodgkin lymphoma. Eur J Nucl Med Mol Imaging. 2010;37:494–504. doi: 10.1007/s00259-009-1275-x. [DOI] [PubMed] [Google Scholar]
- 17.Vesselle H, Schmidt RA, Pugsley JM, et al. Lung cancer proliferation correlates with 18FDG uptake by positron emission tomography. Clin Cancer Res. 2000;6:3837–3844. [PubMed] [Google Scholar]
- 18.Rajendran JG, Schwartz DL, O’Sullivan J, et al. Tumour hypoxia imaging with 18F fluoromisonidazole positron emission tomography in head and neck cancer. Clin Cancer Res. 2006;12:5435–5441. doi: 10.1158/1078-0432.CCR-05-1773. [DOI] [PMC free article] [PubMed] [Google Scholar]
- 19.Kunkel M, Reichert TE, Benz P, et al. Overexpression of Glut-1 and increased glucose metabolism in tumours are associated with a poor prognosis in patients with oral squamous cell carcinoma. Cancer. 2003;97:1015–1024. doi: 10.1002/cncr.11159. [DOI] [PubMed] [Google Scholar]
- 20.Xu Y, Sonka M, McLennan G, Guo J, Hoffman EA. MDCT-based 3-D texture classification of emphysema and early smoking related lung pathologies. IEEE Trans Med Imaging. 2006;25:464–75. doi: 10.1109/TMI.2006.870889. [DOI] [PubMed] [Google Scholar]
- 21.Tesar L, Shimizu A, Smutek D, Kobatake H, Shigeru N. Medical image analysis of 3D CT images based on extension of Haralick texture features. Comput Med Imaging Graph. 2008;32:513–520. doi: 10.1016/j.compmedimag.2008.05.005. [DOI] [PubMed] [Google Scholar]
- 22.Segal E, Sirlin CB, Ooi C, et al. Decoding global gene expression programs in liver cancer by noninvasive imaging. Nat Biotechnol. 2007;25(6):675–680. doi: 10.1038/nbt1306. [DOI] [PubMed] [Google Scholar]
- 23.El Naqa I, Grigsby PW, Aptea A, et al. Exploring feature-based approaches in PET images for predicting cancer treatment outcomes. Pattern Recognition. 2009;42:1162–1171. doi: 10.1016/j.patcog.2008.08.011. [DOI] [PMC free article] [PubMed] [Google Scholar]
- 24.Eary JF, O’Sullivan F, O’Sullivan J, Conrad EU. Spatial Heterogeneity in Sarcoma 18F-FDG Uptake as a Predictor of Patient Outcome. J Nucl Med. 2008;49:1973–1979. doi: 10.2967/jnumed.108.053397. [DOI] [PMC free article] [PubMed] [Google Scholar]
- 25.Therasse P, Arbuck SG, Eisenhauer EA, et al. New guidelines to evaluate the response to treatment in solid tumors. European Organization for Research and Treatment of Cancer, National Cancer Institute of the United States, National Cancer Institute of Canada. J Natl Cancer Inst. 2000;92:205–216. doi: 10.1093/jnci/92.3.205. [DOI] [PubMed] [Google Scholar]
- 26.Hatt M, Cheze le Rest C, Turzo A, Roux C, Visvikis D. A Fuzzy Locally Adaptive Bayesian segmentation Approach for Volume Determination in PET. IEEE Trans Med Imaging. 2009;28:881–93. doi: 10.1109/TMI.2008.2012036. [DOI] [PMC free article] [PubMed] [Google Scholar]
- 27.Amadasun M, King R. Textural features corresponding to textural properties. IEEE Trans Syst Man Cybern. 1989;19:1264–1274. [Google Scholar]
- 28.Haralick RM, Shanmugam K, Dinstein I. Textural Features for Image Classification. IEEE Trans Syst Man Cybern. 1973;3:610–621. [Google Scholar]
- 29.Loh H, Leu J, Luo R. The analysis of natural textures using run length features. IEEE trans ind electron. 1988;35:323–328. [Google Scholar]
- 30.Thibault G, Fertil B, Navarro C, Pereira S. Texture indexes and gray level size zone matrix: application to cell nuclei classification. Pattern Recognition and Information Processing. 2009:140–145. [Google Scholar]
- 31.Hautzel H, Müller-Gärtner HW. Early changes in fluorine-18-FDG uptake during radiotherapy. J Nucl Med. 1997;38:1384–1386. [PubMed] [Google Scholar]
- 32.Erasmus JJ, Munden RF, Truong MT, et al. Preoperative chemo-radiation-induced ulceration in patients with esophageal cancer: a confounding factor in tumor response assessment in integrated computed tomography-positron emission tomography imaging. J Thorac Oncol. 2006;1:478–486. [PubMed] [Google Scholar]
- 33.Gillies RJ, Anderson AR, Gatenby RA, Morse DL. The biology underlying molecular imaging in oncology: from genome to anatome and back again. Clin Radiol. 2010;65:517–521. doi: 10.1016/j.crad.2010.04.005. [DOI] [PMC free article] [PubMed] [Google Scholar]
- 34.Diehn M, Nardini C, Wang DS, et al. Identification of noninvasive imaging surrogates for brain tumor gene-expression modules. PNAS. 2008;105:5213–5218. doi: 10.1073/pnas.0801279105. [DOI] [PMC free article] [PubMed] [Google Scholar]
- 35.Strauss LG, Pan L, Koczan D, et al. Fusion of positron emission tomography (PET) and gene array data: a new approach for the correlative analysis of molecular biological and clinical data. IEEE Trans Med Imaging. 2007;26:804–812. doi: 10.1109/TMI.2007.892645. [DOI] [PubMed] [Google Scholar]