

Abstract
Combined inhibition of ribonucleotide reductase and deoxycytidine kinase (dCK) in multiple cancer cell lines depletes deoxycytidine triphosphate pools leading to DNA replication stress, cell cycle arrest and apoptosis. Evidence implicating dCK in cancer cell proliferation and survival stimulated our interest in developing small molecule dCK inhibitors. Following a high throughput screen of a diverse chemical library, a structure-activity relationship study was carried out. Positron Emission Tomography (PET) using 18F-L-1-(2′-deoxy-2′-FluoroArabinofuranosyl) Cytosine (18F-L-FAC), a dCK-specific substrate, was used to rapidly rank lead compounds based on their ability to inhibit dCK activity in vivo. Evaluation of a subset of the most potent compounds in cell culture (IC50 = ∼1 – 12 nM) using the 18F-L-FAC PET pharmacodynamic assay identified compounds demonstrating superior in vivo efficacy.
Introduction
Mammalian cells rely on two major pathways for the production and maintenance of deoxyribonucleotide triphosphates (dNTPs) for DNA replication and repair: the de novo pathway and the nucleoside salvage pathway.1 The de novo pathway produces dNTPs from glucose and amino acids. The nucleoside salvage pathway produces dNTPs from preformed deoxyribonucleosides present in the extracellular environment.1 The first enzymatic step in the cytosolic deoxyribonucleoside salvage pathway is catalyzed by deoxycytidine kinase (dCK) and by thymidine kinase 1 (TK1).2 dCK catalyzes 5′-phosphorylation of deoxycytidine (dC), deoxyguanosine (dG) and deoxyadenosine (dA) to their monophosphate forms, exhibiting the highest affinity for dC.3 The monophosphate deoxyribonucleotides are subsequently phosphorylated to their corresponding di- and triphosphate forms by other kinases.4,5 We have shown that dCK and TK1 play important roles in hematopoiesis by regulating dNTP biosynthesis in lymphoid and erythroid progenitors.6,7 In addition to its physiological role in nucleotide metabolism, dCK phosphorylates several clinically important antiviral and anticancer nucleoside analog prodrugs (e.g. gemcitabine, decitabine, fludarabine, cytarabine, clofarabine); phosphorylation by dCK is critically required for the activation of these prodrugs.8 Recently, dCK was implicated in the regulation of the G2/M checkpoint in cancer cells in response to DNA damage.9 The role of dCK in hematopoiesis and cancer has led to our interest in developing a small molecule inhibitor of this kinase. Such dCK inhibitors could represent new therapeutic agents for malignancies and immune disorders. To our knowledge, few dCK inhibitors have been reported,10,11,12 and only one13 has been demonstrated to inhibit dCK activity in vivo.
Positron emission tomography (PET) is a non-invasive in vivo imaging technique widely used for diagnosing, staging, restaging and therapy monitoring of various diseases.14,15 While PET using the radiotracer 2-18F-fluoro-2-deoxy-D-glucose (18F-FDG)16,17 has become an important diagnostic and treatment monitoring tool in cancer18,19,20,21, another emerging application of PET concerns its use in drug discovery and development. Thus, by facilitating faster and more effective decision-making early in the drug discovery/development process, PET could accelerate the advancement of promising candidates and reduce failures.22,23,24 For instance, PET can be used to demonstrate the need to modify lead candidates early in the drug discovery process by enabling non-invasive evaluations of drug pharmacodynamic (PD) and/or pharmacokinetic (PK) properties. In the specific context of our drug discovery and development program centered on dCK, PET could play a particularly important role given the availability of validated PET biomarkers to assess dCK activity in vivo. These PET PD biomarkers of dCK activity include a series of 18F-Fluoro-arabinofuranosylcytosine analogs substrates of dCK developed by our group25 which include 18F-1-(2′-deoxy-2′-FluoroArabinofuranosyl) Cytosine (18F-FAC)26 and 18F-L-1-(2′-deoxy-2′-FluoroArabinofuranosyl) Cytosine (18F-L-FAC)27. Herein we describe the development of potent dCK inhibitors and demonstrate their in vivo efficacy using 18F-L-FAC PET as a non-invasive and clinically applicable PD biomarker.
Results and Discussion
Identification of Lead Compound 15c
To identify new small molecule inhibitors of dCK, we performed a high throughput screen (HTS) of a set of selected chemical libraries totaling ∼90,000 small molecules. We screened the library for dCK inhibitory function using a Firefly luciferase-coupled assay with recombinant human dCK enzyme.28 In this assay, inhibition of dCK prevents ATP depletion by dCK, thus resulting in higher luminescent signals in positive wells. The screen yielded two hit compounds, 1 and 2, which were validated to inhibit the uptake of tritiated deoxycytidine (3H-dC) with micromolar potency in the L1210 murine leukemia cell line (Figure 1).
Figure 1.

Structures and IC50 values determined using the 3H-dC uptake assay in L1210 cells for the initial HTS hits (1 and 2) and for commercially available compounds containing similar structural scaffolds (3-7).
Based on these results, five commercially available compounds containing similar structural scaffolds were tested; their IC50 values against L1210 cells were determined by measuring inhibition of 3H-dC uptake (Figure 1). Strikingly, compounds 6 and 7 were inactive, suggesting that the bis-amino functionality on the pyrimidine ring is crucial for dCK inhibition. Based on these results, we initiated a structure-activity relationship (SAR) study to develop a lead structure, which could be further optimized to compounds with potent in vivo activity.
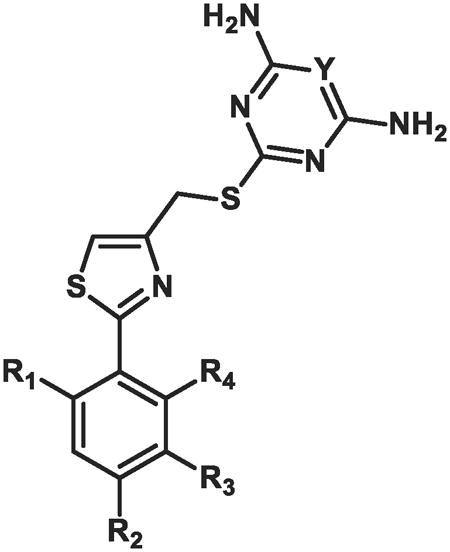
We initially studied two main structural classes of compounds, pyrimidines and 1,3,5-triazines (Table 1). Two cell lines were used to determine the IC50 values: the L1210 murine leukemia cells and the CCRF-CEM human acute T-lymophoblastic leukemia cells. In nearly all cases, substitution of the pyrimidine ring with the 1,3,5-triazine motif reduced dCK inhibitory activity; in some instances an approximate 2-fold reduction in potency was observed. Consequently, the pyrimidine motif was utilized as the preferred scaffold to advance. At this stage of the SAR, the presence of a fluoroethoxy side-chain on the phenyl ring was considered for eventual 18-Fradiolabeling purposes. Substitutions around the phenyl ring with respect to the position of the fluoroethoxy side-chain were also examined. Moving the fluoroethoxy side-chain from the para position in 8a to the meta position in 9a increased the inhibitory activity approximately 2-fold. It was also apparent that alkoxy substituents in the para position were better than alkyl moieties, since compound 11a had substantially lower activity than either the methoxy 9a or ethoxy 10a analogs. Compound 12a, which contains a side-chain that was extended by one carbon to give a fluoropropoxy group at the meta position, gave slightly greater inhibitory activity, albeit not a significant increase from compounds 9a and 10a. Substitution at the ortho position of the phenyl ring, e.g. in compounds 13a and 14a, resulted in substantially lower dCK inhibitory activity, an approximate 10-fold decrease in potency was observed for compound 14a when compared to 9a. A general synthetic scheme for compounds in Table 1 can be found in the supporting information (Scheme S2).
Table 1.
In vitro biological data in l1210 and cem cells for compounds 8-14.a
| ||||||||
|---|---|---|---|---|---|---|---|---|
|
| ||||||||
| Compound | R1 | R2 | R3 | R4 | IC50 (μM) L1210 cells | IC50 (μM) CEM cells | ||
|
|
||||||||
| a Y = CH | b Y = N | a Y = CH | b Y = N | |||||
| 8 | H | OCH2CH2F | OCH3 | H | 0.808 (± 0.406) | 1.612 (± 0.543) | 0.421 (± 0.075) | 0.534 (± 0.012) |
| 9 | H | OCH3 | OCH2CH2F | H | 0.538 (± 0.014) | 0.528 (± 0.015) | 0.230 (± 0.042) | 0.506 (± 0.138) |
| 10 | H | OCH2CH3 | OCH2CH2F | H | 0.513 (± 0.100) | 1.226 (± 0.450) | 0.251 (± 0.020) | 0.512 (± 0.409) |
| 11 | H | CH3 | OCH2CH2F | H | 2.381 (± 0.042) | 3.201 (± 0.566) | 1.960 (± 1.001) | 1.922 (± 0.573) |
| 12 | H | OCH3 | OCH2CH2CH2F | H | 0.330 (± 0.160) | 0.603 (± 0.140) | 0.197 (± 0.109) | 0.297 (± 0.020) |
| 13 | OCH3 | H | OCH2CH2F | H | 1.445 (± 0.060) | 2.649 (± 0.902) | 1.041 (± 0.084) | 0.849 (± 0.183) |
| 14 | H | OCH2CH2F | H | OCH3 | 5.469 (± 1.336) | NDb | 2.367 (± 0.238) | NDb |
lnhibitory activity measured by 3H-deoxycytidine (3H-dC) uptake in murine L1210 cells and in CCRF-CEM human cells. Values reported are the mean ± SD of at least n = 2 independent experiments.
ND = not determined (compound was not synthesized).
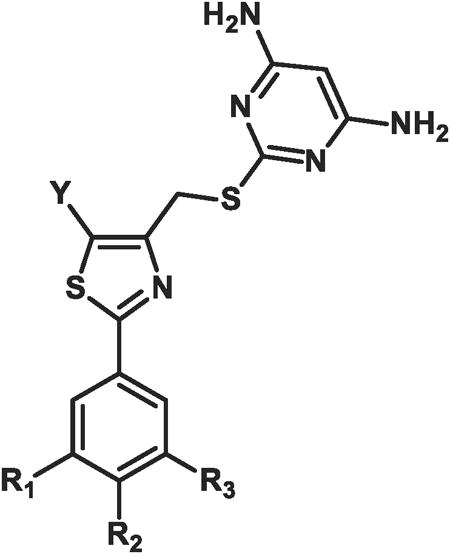
While the presence of fluorine in the small molecule may eventually enable the synthesis of an 18F-isotopolog of the dCK inhibitor, fluorine introduction also affects nearly all the physical and ADME (adsorption, distribution, metabolism, and excretion) properties of a compound.29 The capacity of fluorine to enhance metabolic stability has become increasingly apparent in recent years.30 Thus, a series of compounds were synthesized which contained fluorine attached directly on the aromatic ring of the inhibitors rather than linked by an ethoxy side-chain (compounds 16-18, Table 2). For each compound in this series, a set of three derivatives (a-c) were synthesized; in each case the group on the 5-position of the thiazole was either a methyl, ethyl or propyl substituent. For compounds 15a-c the fluoroethoxy side-chain was retained at the meta position of the phenyl ring, as was a methoxy group at the para position due to the favorable inhibitory results from the initial SAR in Table 1.
Table 2. In vitro biological data in l1210 and cem cells for compounds 15-18a.
| |||||||||
|---|---|---|---|---|---|---|---|---|---|
|
| |||||||||
| Compound | R1 | R2 | R3 | IC50 (μM) L1210 cells | IC50 (μM) CEM cells | ||||
|
|
|||||||||
| a Y = Me | b Y = Et | c Y = Pr | a Y = Me | b Y = Et | c Y = Pr | ||||
| 15 | H | OCH3 | OCH2CH2F | 0.035 (± 0.015) | 0.030 (± 0.077) | 0.003 (± 0.000) | 0.018 (± 0.012) | 0.007 (± 0.002) | 0.003 (± 0.000) |
| 16 | F | H | F | 0.595 (± 0.163) | 0.620 (± 0.170) | 0.385 (± 0.262) | 0.150 (± 0.099) | 0.162 (± 0.019) | 0.173 (± 0.157) |
| 17 | H | F | H | 0.395 (± 0.134) | 0.265 (± 0.163) | 0.170 (± 0.099) | 0.230 (± 0.134) | 0.083 (± 0.043) | 0.037 (± 0.020) |
| 18 | H | H | F | 0.255 (± 0.021) | 0.510 (± 0.014) | 0.175 (± 0.007) | 0.092 (± 0.048) | 0.011 (± 0.038) | 0.031 (± 0.024) |
lnhibitory activity measured by 3H-deoxycytidine (3H-dC) uptake in murine L1210 and in CCRF-CEM human cells. Values reported are the mean ± SD of at least n = 2 independent experiments.
Increasing non-polar functionality at the 5-position of the thiazole resulted in increasing inhibitory activity (Table 2). The IC50 values in CCRF-CEM cells illustrate the same trend in potency as observed in L1210 cells with one exception; set 16 shows little difference between the methyl, ethyl or propyl substituents. However, for all compounds tested against L1210 cells, the propyl substituent yielded better inhibitory activity than the corresponding methyl derivatives. The best example in L1210 cells was the 12-fold increase in activity when comparing compound 15c to compound 15a. In addition, comparisons between the propyl substituents against their respective methyl derivatives in CCRF-CEM cells also showed an increasing inhibitory trend in activity: 6-fold (compare 17c to 17a) or 3-fold (compare 18c to 18a). The most drastic effect from modifications at the 5-position of the thiazole ring was the change exhibited from 9a in Table 1 to 15c in Table 2, where the substitution of a hydrogen for a propyl moiety resulted in a 180-fold increase in potency in L1210 cells. In addition, removal of the fluoroethoxy side-chain (e.g. compound series 16-18) resulted in a significant decrease in potency in both cell lines. Compound 15c, the most potent compound in this series, contains both the fluoroethoxy side-chain at the meta position on the phenyl ring and also a propyl group at the 5-position of the thiazole ring.
Synthesis
Compounds 15a-c were synthesized in six steps (Scheme 1). The commercially available 3-hydroxy-4-methoxybenzonitrile 19 was functionalized via alkylation with 1-bromo-2-fluoroethane in DMF with cesium carbonate as the base to obtain the nitrile 20 in 99% yield. Subjection of 20 to an aqueous ammonium sulfide solution under basic conditions afforded the thioamide 21 in excellent yield.31 Cyclization to form the thiazole core of 15a-c was achieved via condensation of thioamide 21 with the respective ethyl 3-bromo-2-oxoalkanoate32 in refluxing ethanol.33 Reduction of the resulting compounds with diisobutylaluminum hydride afforded the respective alcohols 23a-c in 88-99% yield. The alcohols 23a-c were converted to the respective bromides 24a-c under mild conditions34 in 74-80% yield. Finally, nucleophilic displacement of the bromide with 4,6-diamino-2-mercaptopyrimidine35 generated the desired products 15a-c in 71-87% yield.
Scheme 1. Synthesis of compounds 15a – ca.

aReagents and conditions: (a) 1-bromo-2-fluoroethane, Cs2CO3, DMF, 99%; (b) (NH4)2S (20% in H2O), pyridine, Et3N, quantitative; (c) ethyl 3-bromo-2-oxobutanoate, EtOH; (d) ethyl 3-bromo-2-oxopentanoate, EtOH; (e) ethyl 3-bromo-2-oxohexanoate, EtOH; (f) DIBAL-H, CH2Cl2; (g) 1,1,1,3,3,3-hexabromoacetone, PPh3, CH3CN; (h) 4,6-diamino-2-mercaptopyrimidine, NaOH, EtOH.
X-ray Crystal Structure of Compound 15a Bound to Human dCK
X-ray crystallographic studies of compound 15a were initiated to obtain information about its binding to dCK. Detailed analysis of the dCK-inhibitor interactions for this series of compounds was performed (Nomme, unpublished results). In short, the crystal structure of the dCK:15a complex was solved at 1.9 Å resolution (Figure 2). Human dCK, a dimer of two identical subunits with a molecular weight of ∼30 kDa per monomer, can bind either ATP or UTP as the phosphoryl donor for catalysis; in addition, dCK can adopt an open or closed conformation.36,37,3 In complex with 15a, the enzyme adopts the open conformation. We observed two 15a molecules in each protomer of the dimeric enzyme (shown in blue (15a-I) and cyan (15a-II), Figure 2A). Note that binding of 15a to dCK does not preclude nucleotide binding (UDP is shown in red, Figure 2A). The parallel orientation between 15a-I and 15a-II allows for optimal π-π stacking interactions between the phenyl and thiazole rings of each molecule.
Figure 2. Binding of 15a to human dCK.

(A) Ribbon diagram of a dCK monomer (light blue) with the two observed molecules of 15a bound (blue and cyan spheres, respectively) at the active site. The nucleotide UDP (red) was also present in the complex. (B) The interactions between 15a and dCK. Polar interactions are indicated as broken black lines. The two phosphate groups of UDP (top right) demonstrate the relative orientation of 15a-I (blue) and 15a-II (cyan) to the nucleotide. (C) The methyl group of the 15a-I and 15a-II thiazole ring (red arrows) stack against each other, occupying a hydrophobic pocket.
While two molecules of 15a bind in the active site, it appears that 15a-I forms more key interactions and shorter hydrogen bond distances than 15a-II (Figure 2B). The extensive hydrogen-bond network that exists between the pyrimidine moiety of 15a-I and residues E53, Q97 and D133 in the dCK nucleoside binding site are illustrated in Figure 2B. Figure 2C illustrates the hydrophobic pocket that exists, via V55, L82 and F96, around the methyl group of compound 15a. This figure demonstrates that the pocket will accept larger substituents, explaining the increased trend in potency obtained for compounds 15b and 15c.
Monte Carlo-based Computational Modeling
A Monte Carlo38 (MC)-based computational modeling approach using the free energy perturbation (FEP) method39,40 was used to further investigate the inhibitory effects of alkyl chain lengthening at the 5-position of the thiazole. FEP allows calculation of the difference in binding energy of two molecules. The perturbation of molecule A into molecule B in a complex with a protein [ΔGprotein(A → B) ] and in solution alone [ΔGwater(A → B) ] is part of a complete thermodynamic cycle (Figure 3A). Because the sum of all components in such a cycle must equal zero, the binding energy difference may be calculated as the difference in free energies:
Figure 3.

(A) The complete thermodynamic cycle relating the binding energies to the perturbation of molecule A into molecule B. ΔGprotein(A → B) denotes the change in free energy upon perturbation of A into B in the solvated inhibitor-protein complex, while Δ Gwater(A → B) denotes the free energy change when the perturbation takes place in water alone. The difference in free energies of binding, Δ Δ Gbinding, is equal to the change in free energy when molecule A binds with the protein [Δ Gbinding(A)] subtracted from the change in free energy when molecule B binds [ΔGbinding(B)]. Because the sum of all components in a complete thermodynamic cycle must equal zero, Δ Δ Gbinding is therefore also equivalent to Δ Gprotein(A → B)-ΔGwater(A → B). (B) Computational model of compound 15c (orange) in complex with dCK. Binding pocket residues Glu 53, Gln 97, Arg 114, and Asp 133 are shown explicitly, while the remainder of the protein is illustrated as a ribbon structure. (C) Free energy changes (kcal/mol) associated with the perturbation of the alkyl chain at the 5-position of the thiazole. ΔGprotein is the change in free energy for the solvated inhibitor-protein complex. Δ Gwater is the free energy change for the inhibitor in water alone. The change in free energy upon binding is denoted as ΔΔGbinding.
Models of structures 15b and 15c (Figure 3B) each in a monomeric complex with dCK and in solution alone were equilibrated using MC. The equilibrated structure of 15c was subsequently perturbed into the structure of 15b (“shrinking” the propyl chain into an ethyl) and vice versa (“growing” the ethyl chain into a propyl) using FEP. These calculations were performed using the MCPRO 2.0 software package. The free energy changes for these perturbations are illustrated in Figure 3C. Averaging the Δ ΔGbinding obtained from the two simulations indicates that the propyl chain of 15c confers a 1.210 kcal/mol more favorable free energy of binding in comparison to the ethyl chain of 15b; this favorable effect is due to desolvation. The change in free energy upon extension of the alkyl chain is unfavorable both in the complex with the protein and in water alone (positive ΔG for chain lengthening, negative ΔG for chain shortening); however, the magnitude of the unfavorable ΔG is larger in solvent. The fact that this produces an overall favorable Δ ΔG of binding suggests that the propyl chain is better able to exclude water from the interior cavity of the protein, allowing a greater association between the protein and the inhibitor.
Lead Optimization and SAR
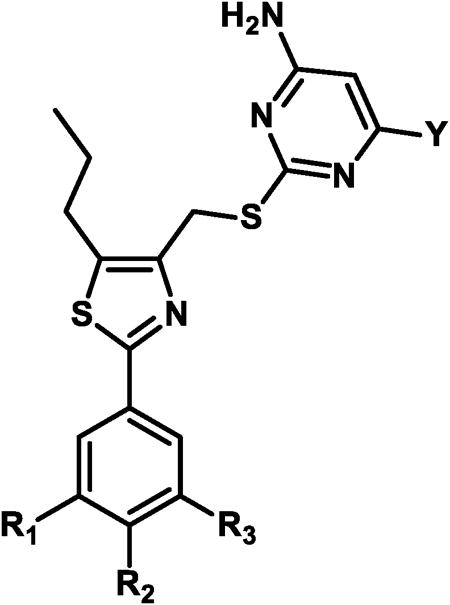
Based on the potency trend in Table 2 and the existence of a hydrophobic pocket around the 5-position of the thiazole ring of 15a, all further compounds in the SAR were made with the propyl chain installed at that position, to increase non-polar interactions between the dCK enzyme pocket and the inhibitors. The fluorine atom terminating the ethoxy side-chain was substituted for a hydroxyl or sulfonamide group, with the goal of improving the molecule's solubility properties as well as potential hydrogen bonding interactions that might exist in the active site. Moreover, since inhibitory activity in L1210 and CCRF-CEM cells demonstrated the same trend in potency, the SAR for all subsequently synthesized compounds were examined only in CCRF-CEM cells. The results are summarized in Table 3.
Table 3. In vitro biological data in cem cells for compounds 25- 37a.
| |||||
|---|---|---|---|---|---|
|
| |||||
| Compound | R1 | R2 | R3 | Y | IC50(nM) CEM cells |
| 25 | H | H | OCH2CH2OH | NH2 | 2.45 (± 0.778) |
| 26 | H | F | OCH2CH2OH | NH2 | 1.07 (± 0.230) |
| 27 | F | H | OCH2CH2OH | NH2 | 2.83 (± 1.628) |
| 28 | H | H | OCH2CH2NHSO2CH3 | NH2 | 11.58 (± 3.353) |
| 29 | F | H | OCH2CH2NHSO2CH3 | NH2 | 8.01 (± 0.230) |
| 30 | H | OCH2CH2OH | OCH2CH2OH | NH2 | 2.59 (± 1.146) |
| 31 | H | OCH3 | OH | NH2 | 18.62b |
| 32 | H | OCH3 | OCH2CH2CH2OH | NH2 | 1.55 (± 0.354) |
| 33 | H | OCH3 | OCH2CH2OH | NH2 | 1.15 (± 0.762) |
| 34 | H | OCH3 | OCH2CH2OH | H | 2.90 (± 0.300) |
| 35 | H | OCH3 | OCH2CH(CH3)OH | NH2 | 2.85 (± 0.071) |
| 36 | H | OCH3 | OCH2C(CH3)2OH | NH2 | 1.44 (± 0.538) |
| 37 | H | OCH3 | OCH2CH2NHSO2CH3 | NH2 | 4.89 (± 2.014) |
lnhibitory activity measured by 3H-deoxycytidine (3H-dC) uptake in CCRF-CEM human cells. Values reported are the mean ± SD of at least n = 2 independent experiments.
Value reported for n = 1.
Compounds 25-27 showed excellent (1-2 nM) potency against CCRFCEM cells (Table 3). Substitution of the end-chain hydroxyl for a methyl sulfonamide resulted in a decrease in inhibitory activity of about 3-fold (compare 27 to 29) or 5-fold (compare 25 to 28). The initial SAR in Table 1 indicated that the presence of an alkoxy substituent at the para position led to increased inhibitory activity; therefore, the methoxy group was reinstalled at the para position. As expected, removal of the ethoxy side-chain (e.g. compound 31) resulted in a substantially lower inhibitory activity, reinforcing the data observed for compounds 16-18 (Table 2). The presence of the methoxy moiety at the para position, in addition to the hydroxylethoxy side chain at the meta position, generated compound 33, which has an inhibitory potency of 1 nM. To our surprise, removal of one of the amino groups from the pyrimidine ring led to a mere 2.5-fold decrease in inhibitory activity (compare 33 to 34). Initially, we observed that removal of both amino groups from the pyrimidine ring resulted in complete loss of inhibitory activity (compounds 6 and 7, Figure 1); however, the presence of one amino group can provide suitable key hydrogen bonding interactions to inhibit the enzyme. Compound 32, which contains a sidechain that has been extended by one carbon to give a hydroxylpropoxy group, was also synthesized. However, this modification resulted in slightly decreased inhibitory activity in comparison with the hydroxylethoxy group. While compound 33 was a potent compound in cell culture, the presence of a primary hydroxyl group in the molecule raised concerns of a metabolic liability as a consequence of potential oxidation or glucuronidation.42 Thus, compounds 35-37 were synthesized to decrease the possibility of metabolic degradation of 33. Eight of these compounds in Table 3, whose IC50 values were lower than 15a and whose structural properties suggested that they would have the best in vivo efficacy, were selected for further investigation.
Steady-state Kinetic Analysis of Selected dCK Inhibitors
In order to confirm that the cell-based values truly reflect the potency of the compounds we also determined the Kiapp values for select compounds using steady state kinetic assays. The cell-based assays indicated that compound 15a was 6-12 fold (depending on the cell line used for the assay) less potent than compound 15c (Table 2). Correspondingly, the steady state data showed a 6-fold higher Kiapp value for compound 15a (Table 4). Likewise, the low nanomolar IC50 observed in CEM cells for compounds 36 and 37 (Table 3) was recapitulated in the steadystate kinetics derived Kiapp values for these compounds (Table 4). Hence, we conclude that our cell-based assays are providing us with relatively accurate data as to the strength of the interactions between the compounds and dCK.
Table 4. Steady state kinetics of selected dCK inhibitors.
| Compound | KiaPP (nM) | Error (nM) | R2 |
|---|---|---|---|
| 15a* | 9.5 | 2.3 | 0.974 |
| 15c* | 1.5 | 0.3 | 0.998 |
| 36 | 0.8 | 0.7 | 0.982 |
| 37 | 0.5 | 0.5 | 0.988 |
Data from Nomme et al.
Evaluation of In Vivo Inhibition of dCK Activity Via a New PET PD Assay
The nucleoside analog PET probe 18F-L-FAC is a high affinity substrate for dCK, which can be used to non-invasively estimate dCK enzymatic activity in vivo.27 A schematic depicting the mechanism by which 18F-L-FAC accumulates in cells in a dCK-specific manner is shown in Figure 4A. We reasoned that 18F-L-FAC PET could be used to rapidly identify the most potent dCK inhibitors based on their effectiveness at inhibiting the accumulation of the 18F-Labeled dCK substrate PET tracer in various tissues. For the in vivo PET PD assay we selected dCK inhibitors that demonstrated 1 – 12 nM inhibitory activity in the cell culture 3H-dC uptake assay (Table 3). Mice were treated with a single dose (50 mg/Kg) of a given dCK inhibitor administered by intraperitoneal injection. Control mice received vehicle (40% Captisol in water) injections. Four hours later, treated mice were injected intravenously with 18F-L-FAC; one hour after probe injection, mice were imaged by mPET/CT. The readout for the PET PD assay was the reduction in the accumulation of 18F-L-FAC in dCK-positive tissues in dCK inhibitor versus vehicle treated mice. Previously, we showed that 18F-L-FAC accumulates in a dCK-dependent manner into various tissues such as the thymus, spleen, bone marrow and liver.27 Accumulation in the bladder is a result of non-enzymatic renal clearance of the unmetabolized probe. Since the reproducibility in the dCK-dependent tissue retention of 18F-L-FAC was most consistent in the liver27, we chose to quantify 18F-L-FAC liver retention in order to compare the in vivo efficacy of the various dCK inhibitors. Optimal conditions for the PET PD assay were determined by performing a dose escalation and time course study using compound 33 (Supporting Figure S4).
Figure 4. In vivo evaluation of dCK inhibitors via PET analysis.

(A) Schematic of the mechanism by which 18F-L-FAC accumulates in dCK expressing cells. (B) Representative transverse images of 18F-L-FAC PET/CT liver scans of C57Bl/6 mice treated with compounds 15a, 36, and 37. (C) Quantification of 18F-L-FAC uptake in the liver for a sample of inhibitors with low nanomolar in vitro potency. Data are mean values ± SEM for at least n = 3 mice/group. *, P < 0.03. (D) Representative images and quantification of 18F-L-FAC PET/CT scans of CCRF-CEM tumor bearing NSG mice that were treated with vehicle, or compound 36. Data are displayed as box and whisker plots for at least n = 4 mice/group. *, P < 0.0012.
Results from the 18F-L-FAC mPET/CT scans are summarized in Figure 4. Transverse PET images of the 18F-L-FAC liver scans for mice treated with either vehicle or compounds 15a, 36 or 37 are shown in Figure 4B. Figure 4C illustrates the uptake of 18F-L-FAC in the livers of mice treated dCK inhibitors. The more efficacious compounds induced a greater reduction in the 18F-L-FAC uptake relative to vehicle treatment, as a result of their greater inhibition of dCK-mediated phosphorylation of its 18F-Labeled substrate. Note the approximate 30% decrease in 18F-L-FAC signal compared to vehicle control induced by compounds 28, 29, 36 and 37, indicating their superior in vivo efficacy relative to the other dCK inhibitor candidates. In addition, compounds 30 and 32 show about a 20% decrease in probe uptake. Compound 33, one of the most potent dCK inhibitors in the cell culture assay (Table 3) showed poor in vivo efficacy in the 18F-L-FAC liver PET assay, presumably due to its poor PK properties. As hypothesized, substitution of the hydroxyl group at the end of the ethoxy chain (e.g. compound 33) for the metabolically stable methylsulfonamide (compounds 28, 29 and 37) or hindering the hydroxyl group (compound 36) proved advantageous for in vivo efficacy. Compounds 36 and 37 have the lowest IC50 values amongst all the efficacious compounds and were chosen for further study. Here we focus on compound 36 while compound 37 will be described in a subsequent publication (Nathanson, unpublished results).
Next we determined the efficacy of compound 36 at inhibiting dCK activity in tumor tissues in vivo. Mice bearing CCRF-CEM tumor xenografts were treated with compound 36 four hours prior to injection of 18F-L-FAC (Figure 4D). One hour after the 18F-L-FAC injection, mice were imaged by mPET/CT. The retention of 18F-L-FAC in tumor xenografts from mice treated with compound 36 was reduced by about 30% compared to the retention of 18F-L-FAC in tumors from vehicle treated mice (Figure 4D). To complement the PET assay, the pharmacokinetics of compound 36 was determined using standard analytical techniques and the approximated values are reported in Figure 5.
Figure 5. Pharmacokinetic profile of compound 36.

C57Bl/6 female mice were dosed with compound 37 via intraperitoneal injection. Dose formulation: 10% DMSO and 40% Captisol in water. Data are mean values ± SEM for n = 4 mice/time point.
X-ray Crystal Structure of Compound 36 Bound to Human dCK
X-ray crystallographic studies of compound 36 were initiated to obtain information about its binding to dCK. The crystal structure of the dCK:36 complex was solved at 1.94 Å resolution (Figure 6 and Table 5). Similar to our observations for compound 15a (Figure 2), in the case of 36, the enzyme also adopts the open conformation. We observed one 36 molecule (green) in each protomer of the dimeric enzyme (Figure 6A). This is contrast to the observation of two molecules bound per active site when the substituent at the 5-position is smaller than the propyl present in 36 (Figure 2, determinants of single versus double molecule binding to the dCK active site was analyzed by Nomme, unpublished results). Note that binding of 36 to dCK does not preclude nucleotide binding (UDP is shown in red, Figure 6A). The specific dCK:36 interactions are shown in Figure 6B. These include an extensive hydrogen-bond network between the pyrimidine moiety of 36 and residues E53, Q97 and D133 in the dCK nucleoside binding site, as well as several hydrophobic interactions.
Figure 6. Crystal structure of dCK:36 complex.

(A) Ribbon diagram of a dCK monomer (light blue) with the single observed molecule of 36 bound (green spheres) at the active site. The nucleotide UDP (red spheres) was also present in the complex. (B) Detail of the interactions between 36 and dCK. dCK residues involved in polar and hydrophobic interactions with 36 are colored in light blue and gray, respectively. Polar interactions are indicated as broken black lines.
Table 5. Data collection and refinement statistics.
| Complex | 36 + UDP |
| PDB codes | 4L5B |
| Data collection statistics | |
| X-ray source and detector | LS-CAT ID-G |
| MARCCD 300 | |
| Wavelength (Å) | 0.97856 |
| Temperature (K) | 100 |
| Resolutiona (Å) | 1.94 (1.94 – 2.05) |
| Number of Reflections | |
| Observed | 206005 |
| Unique | 40954 |
| Completeness (%) | 99.2 (98.1) |
| Rsym (%) | 4.5 (71.8) |
| Average I/σ(I) | 17.05 (2.05) |
| Space group | P 41 |
| Unit cell (Å) | |
| a = b | 68.67 |
| c | 120.02 |
| Refinement statistics | |
| Refinement program | REFMAC5 |
| Twinning fraction | 0.5 |
| Rcryst (%) | 18.8 |
| Rfree (%) | 23.3 |
| Resolution range (Å) | 30 – 1.94 |
| Protein molecules per a.u. | 2 |
| Number of atoms | |
| Protein (ProtA, ProtB) | 1932, 1925 |
| Inhibitor | 32 × 2 |
| UDP | 25 × 2 |
| Water | 75 |
| R.m.s. deviation from ideal | |
| Bond length (Å) | 0.011 |
| Bond angles (°) | 1.647 |
| Average B-factors (Å2)/chain | |
| Protein (ProtA, ProtB) | 47.1, 47.3 |
| Inhibitor (ProtA, ProtB) | 45.1, 43.4 |
| UDP (ProtA, ProtB) | 47.8, 44.7 |
| Waters | 42.9 |
| Ramachandran plot (%) | |
| most favored regions | 89.1 |
| additionally allowed | 10.5 |
| regions | |
| generously allowed | 0.5 |
| regions | |
| disallowed regions | 0.0 |
Last shell in parenthesis
Conclusion
The identification of potent small molecule human dCK inhibitors that demonstrate in vivo target inhibition is reported. Optimization of inhibitory activity was achieved by extending an alkyl chain from the 5-position of the thiazole ring. In vivo efficacy was improved by manipulation of the ethoxy side-chain present at the meta position of the phenyl ring. The utility of PET as a powerful tool for non-invasive measure of target inhibition and, consequently, as a measure of lack of target inhibition (most likely due to substrate metabolism in vivo), is also presented. Although the major clinical applications of PET are primarily for central nervous system (CNS) and oncology-based diagnostics/therapeutics, PET is playing an increasingly important role in drug development, given the capability of this molecular imaging platform to address key challenges that include evaluation of biodistribution, absorption, target affinity, plasma binding, metabolism, and dosing.43 Here we used the radiotracer 18F-L-FAC as a PET PD biomarker to compare the in vivo efficacies of candidate dCK inhibitors, first identified and characterized by potency in cell culture assays. Moreover, we used PET to provide estimates of in vivo target inhibition in CCRF-CEM xenograft mouse models by one of our most promising compounds, 36. The ability of another promising compound, 37, to elicit a significant pharmacological response against CCRF-CEM tumors with minimal toxicity to normal tissues was evaluated by our group and is described in a separate publication. Further optimization offering improvements to the PK and solubility properties of our best dCK inhibitors will be addressed in subsequent studies. In addition, the presence of fluorine on the aromatic ring of one of our most promising dCK inhibitors, 29, makes it amenable to 18F radiolabeling. Synthesizing a small molecule dCK inhibitor with an 18F radioisotope could generate a positron-emitting version of the therapeutic candidate that can be detected and quantified non-invasively throughout the body of living individuals by PET imaging. This work will be the subject of a future communication.
Experimental Section
High-throughput Screen
Recombinant human dCK at a concentration of 1 μM was incubated with 10 μM of drug, 10 μM of dC and 0.5 μM ATP with 50 mM Tris (pH 7.6), 5 mM MgCl2, 2 mM DTT. The reaction was incubated at 37°C for 4 hours before adding CellTiter-Glo (Promega): Briefly, 40 μL dCK enzyme were dispensed into 384 well plates (Greiner, Bahlingen, Germany) using a multidrop 384 (Thermo, Turku, Finnland) at concentration of 12.5 μg/ml; compounds were added using a Beckman-Coulter Biomek FX (Beckman Coulter, Brea, CA) equipped with a 500 nL custom pin tool (V&P Scientific, San Diego, CA). Columns 1, 2, 23 and 24 received only DMSO instead of any drugs. In addition, no dCK was added to column 23 and 24 as these columns served as additional controls (see below). After 30 min incubation at 37°C, dC and ATP were added to a final concentration of 10 μM and 0.5 μM, respectively for columns 1-22 using the multidrop in a volume of 10 μL. For column 23 and 24 the following controls were used: 10 μl of a 2.5 μM ATP solution containing the following additional controls was added: for wells A-D23, 1 μM dCTP, for wells E-H23 10 μM dCTP, for wells I-L23 10 μM L-FAC, for wells F-P23: 10 μM FAC, for wells A-D24: 0.5 μM ATP standard, for wells E-H24: 0.1 μM ATP standard, for wells I-L24 1 μM DCK only and for wells F-P24 10 μM UTP was added, respectively. These controls were included on each plate to exclude equipment failure. This was followed by a 4 hour incubation at 37°C and addition of 25 μL Cell titer glo reagent (Promega, Fitchburg, WI) by multidrop followed by reading on an Acquest plate reader (Molecular Devices, Sunnyvale, CA). The libraries used were custom sets of compounds from the compound manufacturers Asinex (Winston-Salem, NC) and Enamine (Monmouth Jct., NJ). These sets consisted of compounds selected extensively for drug-likeness using the Lipinski rule of five, rotatable bonds and maximal diversity using custom clustering algorithms.
Chemistry
General Procedures
Unless otherwise noted, reactions were carried out in ovendried glassware under an atmosphere of nitrogen using commercially available anhydrous solvents. Solvents used for extractions and chromatography were not anhydrous. 4,6-Diamino-2-mercapto-pyrimidine was obtained from drying the hydrate over dynamic vacuum at 110 °C for 20 hours. All other reagents obtained from commercial suppliers were reagent grade and used without further purification unless specified. Reactions and chromatography fractions were analyzed by thin-layer chromatography (TLC) using Merck precoated silica gel 60 F254 glass plates (250 μm). Visualization was carried out with ultraviolet light, vanillin stain, permanganate stain, or p-anisaldehyde stain. Flash column chromatography was performed using E. Merck silica gel 60 (230-400 mesh) with compressed air. 1H and 13C NMR spectra were recorded on ARX500 (500 MHz) or Avance500 (500 MHz) spectrometers. Chemical shifts are reported in parts per million (ppm, δ) using the residual solvent peak as the reference. DMSO-d6 (δ 2.50 ppm for 1H; δ 39.5 ppm for 13C) was used as the solvent and reference standards unless otherwise noted. The coupling constants, J, are reported in Hertz (Hz) and the resonance patterns are reported with notations as the following: br (broad), s (singlet), d (doublet), t (triplet), q (quartet), and m (multiplet). Electrospray mass spectrometry data were collected with a Waters LCT Premier XE time of flight instrument controlled by MassLynx 4.1 software. Samples were dissolved in methanol and infused using direct loop injection from a Waters Acquity UPLC into the Multi-Mode Ionization source. The purity of all final compounds was determined to be >95%. Analytical HPLC analysis was performed on a Knauer Smartline HPLC system with a Phenomenex reverse-phase Luna column (5 μm, 4.6 × 250 mm) with inline Knauer UV (254 nm) detector.Mobile phase: A: 0.1% TFA in H2O, B: 0.1% TFA in MeCN. Eluent gradient is specified for each described compound in the supporting information. All chromatograms were collected by a GinaStar (raytest USA, Inc.; Wilmington, NC, USA) analog to digital converter and GinaStar software (raytest USA, Inc.).
General Procedure for the Synthesis of Compounds 15a – c. 3-(2-fluoroethoxy)-4-methoxybenzonitrile (20)
To a solution of 3-hydroxy-4methoxybenzonitrile 19 (3.0 g, 20.1 mmol) in DMF (100 mL) was added Cs2CO3 (10.5 g, 32.2 mmol) and 1-bromo-2-fluoroethane (5.1 g, 40.2 mmol). The mixture was stirred for 18 h at 50 °C. After concentration to remove residual solvent, the resulting residue was washed with brine and extracted with ethyl acetate. The organic layer was washed with water three times, dried over anhydrous MgSO4 and concentrated in vacuo to yield crude 20 (3.91 g, 20.03 mmol, 99%) as an cream-colored solid. 1H NMR (500 MHz, CDCl3) δ: 7.28 (dd, J = 8.5, 2.0 Hz, 1H), 7.10 (d, J = 2.0 Hz, 1H), 6.90 (d, J = 8.5 Hz, 1H), 4.83 – 4.81 (m, 1H), 4.73 – 4.71 (m, 1H), 4.28 – 4.26 (m, 1H), 4.23 – 4.21 (m, 1H), 3.89 (s, 3H); 13C NMR (125 MHz, CDCl3) δ: 153.6, 148.1, 127.3, 119.1, 116.5, 111.9, 103.8, 82.3 (d, JCF = 170.5 Hz), 68.7 (d, JCF = 20.3 Hz), 56.1.
3-(2-fluoroethoxy)-4-methoxybenzothioamide (21)
To a mixture of 20 (3.86 g, 19.8 mmol) in pyridine (41 mL) and triethylamine (3 mL) was added ammonium sulfide solution (20% wt. in H2O, 13.52 mL, 39.6 mmol). The mixture was stirred for 18 h at 60 °C. The reaction mixture was cooled and concentrated in vacuo to remove residual solvent. The resulting residue was washed with brine and extracted with ethyl acetate. The organic layer was dried over anhydrous MgSO4 and concentrated in vacuo to yield 21 (4.5 g, 19.8 mmol, quantitative) as a yelloworange solid. 1H NMR (500 MHz, acetone-d6) δ: 8.81 (brs, 1H), 8.74 (brs, 1H), 7.73 (s, 1H), 7.72 (dd, J = 8.5, 2.0 Hz, 1H), 7.00 (d, J = 8.0 Hz, 1H), 4.79 (dt, J = 48.0, 4.0 Hz, 2H), 4.32 (dt, J = 29.5, 4.0 Hz, 2H), 3.89 (s, 3H); 13C NMR (125 MHz, acetone-d6) δ: 200.4, 152.9, 147.2, 131.8, 121.5, 113.6, 110.8, 82.7 (d, JCF = 167.3 Hz), 68.5 (d, JCF = 19.6 Hz), 55.4.
Ethyl 2-(3-(2-fluoroethoxy)-4-methoxyphenyl)-5-methylthiazole-4-carboxylate (22a)
A mixture of thioamide 21 (1.50 g, 6.5 mmol) and ethyl 3-bromo-2-oxobutanoate (2.72 g, 13.0 mmol) in ethanol (32 mL) was stirred under refluxing conditions for 2.5 h. The resulting mixture was cooled and concentrated in vacuo to remove residual solvent. The crude residue was purified by flash column chromatography over silica gel (10:3 hexanes:ethyl acetate) to yield the desired thiazole intermediate 22a (1.45 g, 4.3 mmol, 65%) as a light brown solid. 1H NMR (500 MHz, DMSO-d6) δ: 7.40 (dd, J = 8.5, 2.0 Hz, 1H), 7.37 (d, J = 2.0 Hz, 1H), 7.04 (d, J = 8.5 Hz, 1H), 4.72 (dt, J = 48.0, 4.0 Hz, 2H), 4.31 – 4.22 (m, 2H), 4.28 (q, J = 7.0 Hz, 2H), 3.81 (s, 3H), 2.67 (s, 3H), 1.28 (t, J = 7.0 Hz, 3H); 13C NMR (125 MHz, DMSO-d6) δ: 162.9, 162.1, 151.4, 148.2, 143.9, 141.9, 125.5, 120.5, 112.6, 110.8, 83.1 (d, JCF = 165.9 Hz), 68.3 (d, JCF = 19.0 Hz), 60.8, 56.0, 14.5, 13.3.
(2-(3-(2-fluoroethoxy)-4-methoxyphenyl)-5-methylthiazol-4-yl)methanol (23a)
To a stirred solution of intermediate 22a (860 mg, 2.5 mmol) in CH2Cl2 (30 mL) cooled to 0 °C was added slowly diisobutylaluminum hydride (1.0M in THF, 10 mmol, 10 mL). The reaction was allowed to warm to 23 °C and stirred for 1 h. The mixture was cooled to 0 °C and slowly quenched with a saturated aqueous solution of Rochelle's salt. The cloudy solution was stirred for 1 h at 23 °C until the solution became clear again. The resulting solution was extracted with ethyl acetate, washed with brine, dried over anhydrous magnesium sulfate and concentrated in vacuo to give the desired alcohol 23a (654 mg, 2.2 mmol, 88%) as a pale yellow solid. 1H NMR (500 MHz, DMSO-d6) δ: 7.39 (d, J = 2.0 Hz, 1H), 7.36 (dd, J = 8.5, 2.0 Hz, 1H), 7.02 (d, J = 8.5 Hz, 1H), 5.04 (t, J = 5.5 Hz, 1H), 4.73 (dt, J = 48.0, 3.5 Hz, 2H), 4.46 (d, J = 5.5 Hz, 2H), 4.25 (dt, J = 30.0, 3.5 Hz, 2H), 3.79 (s, 3H), 2.41 (s, 3H); 13C NMR (125 MHz, DMSO-d6) δ: 162.7, 153.2, 150.8, 148.2, 129.5, 126.5, 119.8, 112.5, 110.4, 83.1 (d, JCF = 165.9 Hz), 68.4 (d, JCF = 18.5 Hz), 57.3, 55.9, 11.2.
4-(bromomethyl)-2-(3-(2-fluoroethoxy)-4-methoxyphenyl)-5-methylthiazole (24a)
To a solution of 23a (1.90 g, 6.4 mmol) in acetonitrile (30 mL) was added PPh3 (2.5 g, 9.6 mmol) followed by hexabromoacetone (1.70 g, 3.2 mmol) at 23 °C. The mixture was stirred for 1 h at 40 °C when, by TLC analysis, all starting material had been consumed. The solvent was removed in vacuo and the crude residue was purified by flash column chromatography over silica gel (10:3 hexanes:ethyl acetate) to give the desired bromide 24a (1.84 g, 5.1 mmol, 80%) as a light brown solid. 1H NMR (500 MHz, CDCl3) δ: 7.50 (d, J = 2.0 Hz, 1H), 7.40 (dd, J = 8.5, 2.0 Hz, 1H), 6.88 (d, J = 8.0 Hz, 1H), 4.81 (dt, J = 47.0, 4.0 Hz, 2H), 4.59 (s, 2H), 4.36 (dt, J = 27.5, 4.0 Hz, 2H), 3.90 (s, 3H), 2.46 (s, 3H); 13C NMR (125 MHz, CDCl3) δ: 164.1, 151.2, 148.1, 148.0, 131.7, 126.4, 120.4, 111.6, 111.5, 82.4 (d, JCF = 169.9 Hz), 68.4 (d, JCF = 20.5 Hz), 55.9, 25.8, 11.4.
2-(((2-(3-(2-fluoroethoxy)-4-methoxyphenyl)-5-methylthiazol-4-yl)methyl)thio)pyrimidine-4,6-diamine (15a)
4,6-diamino-2-mercaptopyrimidine (336 mg, 2.36 mmol) and NaOH (94 mg, 2.36 mmol) were stirred in ethanol (20 mL) for 10 min at 23 °C. To the reaction mixture was added a solution of bromide 24a (710 mg, 1.97 mmol) in hot ethanol (16 mL) and the resulting mixture was stirred for 3 h at 70 °C. The solution was cooled, concentrated in vacuo and purified by flash column chromatography over silica gel (100:5 dichloromethane:methanol) to give the desired product 15a (590 mg, 1.40 mmol, 71%) as a pale yellow solid. 1H NMR (500 MHz, DMSO-d6) δ: 7.36 (s, 1H), 7.34 (d, J = 8.0 Hz, 1H), 7.02 (d, J = 8.5 Hz, 1H), 6.09 (brs, 4H), 5.12 (s, 1H), 4.72 (dt, J = 48.0, 3.5 Hz, 2H), 4.32 (s, 2H), 4.25 (dt, J = 30.5, 3.5 Hz, 2H), 3.78 (s, 3H), 2.43 (s, 3H); 13C NMR (125 MHz, DMSO-d6) δ: 168.3, 163.9 (2), 163.3, 150.9, 149.5, 148.3, 129.1, 126.4, 119.9, 112.7, 110.5, 83.2 (d, JCF = 165.9 Hz), 79.5, 68.5 (d, JCF = 18.7 Hz), 56.1, 27.9, 11.7; HRMS-ESI (m/z) [M + H]+ calcd for C18H20FN5O2S2 H, 422.1121; found 422.1136.
2-(((5-ethyl-2-(3-(2-fluoroethoxy)-4-methoxyphenyl)thiazol-4-yl)methyl)thio)pyrimidine-4,6-diamine (15b)
1H NMR (500 MHz, DMSO-d6) δ: 7.37 (dd, J = 8.0, 2.0 Hz, 1H), 7.36 (s, 1H), 7.02 (d, J = 8.5 Hz, 1H), 6.13 (brs, 4H), 5.13 (s, 1H), 4.72 (dt, J = 47.5, 4.0 Hz, 2H), 4.34 (s, 1H), 4.25 (dt, J = 30.5, 4.0 Hz, 2H), 3.79 (s, 3H), 2.87 (q, J = 7.5 Hz, 2H), 1.17 (t, J = 7.5 Hz, 3H); 13C NMR (125 MHz, DMSO-d6) δ: 168.2, 163.8 (2), 163.5, 151.0, 148.4, 148.3, 136.9, 126.5, 119.9, 112.7, 110.5, 83.3 (d, JCF = 165.9 Hz), 79.5, 68.5 (d, JCF = 18.8 Hz), 56.1, 28.0, 19.9, 17.1; HRMS-ESI (m/z) [M + H]+ calcd for C19H22FN5O2S2 H, 436.1277; found 436.1263.
2-(((2-(3-(2-fluoroethoxy)-4-methoxyphenyl)-5-propylthiazol-4-yl)methyl)thio)pyrimidine-4,6-diamine (15c)
1H NMR (500 MHz, acetone-d6) δ: 7.53 (d, J = 2.0 Hz, 1H), 7.46 (dd, J = 8.5, 2.0 Hz, 1H), 7.03 (d, J = 8.5 Hz, 1H), 5.63 (brs, 4H), 5.38 (s, 1H), 4.80 (dt, J = 48.0, 4.0 Hz, 2H), 4.45 (s, 2H), 4.34 (dt, J = 29.5, 4.0 Hz, 2H), 3.87 (s, 3H), 2.91 (t, J = 7.5 Hz, 1H), 1.66 (qt, J = 7.5, 7.5 Hz, 2H), 0.97 (t, J = 7.5 Hz, 3H); 13C NMR (125 MHz, acetone-d6) δ: 169.2, 164.0 (2), 163.9, 163.6, 151.4, 149.0, 148.5, 134.6, 126.9, 119.8, 112.1, 111.1, 82.8 (d, JCF = 167.5 Hz), 79.5, 68.6 (d, JCF = 19.5 Hz), 55.3, 28.1, 25.2, 13.0; HRMS-ESI (m/z) [M + H]+ calcd for C20H24FN5O2S2 H, 450.1434; found 450.1432.
1-(5-(4-(((4,6-diaminopyrimidin-2-yl)thio)methyl)-5-propylthiazol-2-yl)-2-methoxyphenoxy)-2-methylpropan-2-ol (36)
1H NMR (500 MHz, MeOD) δ: 7.51 (d, J = 2.0 Hz, 1H), 7.39 (dd, J = 8.5, 2.0 Hz, 1H), 7.00 (d, J = 8.5 Hz, 1H), 5.48 (s, 1H), 5.32 (s, 1H), 4.48 (s, 2H), 3.89 (s, 3H), 3.86 (s, 2H), 2.88 (t, J = 7.5 Hz, 2H), 1.67 (qt, J = 7.5, 7.5 Hz, 2H), 1.33 (s, 6H), 0.98 (t, J = 7.5 Hz, 3H); 13C NMR (125 MHz, MeOD) δ: 168.8, 165.2, 163.8 (2), 151.2, 148.9, 148.0, 135.4, 126.4, 119.7, 111.8, 110.7, 79.2, 77.0, 69.6, 55.2, 48.4, 27.9, 27.8, 25.0, 24.9, 12.6; HRMS-ESI (m/z) [M + H]+ calcd for C22H29N5O3S2 H, 476.1790; found 476.1772.
N-(2-(5-(4-(((4,6-diaminopyrimidin-2-yl)thio)methyl)-5-propylthiazol-2-yl)-2-methoxyphenoxy)ethyl)methanesulfonamide (37)
1H NMR (500 MHz, DMSO-d6) δ: 7.41 (dd, J = 7.5, 2.0 Hz, 1H), 7.39 (s, 1H), 7.25 (t, J = 6.0 Hz, 1H), 7.05 (d, J = 8.5 Hz, 1H), 6.13 (brs, 4H), 5.15 (s, 1H), 4.39 (s, 2H), 4.07 (t, J = 5.5 Hz, 2H), 3.80 (s, 3H), 3.36 (dt, J = 5.5, 5.5 Hz, 2H), 3.15 (d, J = 5.5 Hz, 1H), 2.98 (s, 3H), 2.84 (t, J = 7.5 Hz, 2H), 1.58 (qt, J = 7.5, 7.5 Hz, 2H), 0.91 (t, J = 7.5 Hz, 3H); 13C NMR (125 MHz, DMSO-d6) δ: 168.3, 163.9 (2), 163.7, 151.1,149.1, 148.3, 135.0, 126.5, 119.9, 112.7, 110.6, 79.5, 68.3, 60.2, 42.4, 31.2, 28.2, 28.0, 25.4, 13.9; HRMS-ESI (m/z) [M + H]+ calcd for C21H28N6O4S3 H, 525.1412; found 525.1404.
dCK Uptake Assay Performed in Cell Culture
The murine leukemic line L1210 was a gift from Charles Dumontet (Université Claude Bernard Lyon I, Lyon, France). The human lymphoma line CCRF-CEM was provided by Margaret Black (Washington State University). All L1210 and CCRF-CEM cell lines were cultured in RPMI medium 1640, supplemented with 5% FCS in a 5% CO2 37 °C incubator. For the uptake assays cells were seeded at a density of 50,000 cells/well in Millipore MultiScreen GV 96 well plates. 0.25 μCi of 3H-dC (Moravek Biochemicals) were added to the cells simultaneously with concentrations of dCK inhibitor at a final volume of 100 μL/well. After 1 h at 37 °C, cells were washed four times with ice cold phosphate-buffered saline (PBS) using the Millipore Vacuum Manifold. The amount of incorporated probe was measured by scintillation counting with the PerkinElmer Microbeta.
Protein expression and purification
Details on C4S S74E dCK variant expression and purification are detailed in Nomme et al.
Crystallization, X-ray Data Collection, and Refinement
Crystallization, data collection and structure determination of dCK in complex with 15a and 36 were performed following the general procedure as detailed in Nomme et al. Specifically for compound 36, crystals of dCK in complex with UDP, MgCl2 and a 2.5-fold excess of the 36 inhibitor were grown using the hanging drop vapor diffusion method at 12 °C. The reservoir solution contained 0.9-1.5 M trisodium citrate dehydrate and 25 mM HEPES (pH 7.5). Diffraction data were collected at the Advanced Photon Source, Argonne National Laboratory on Life Sciences-Collaborative Access Team (LS-CAT) beamlines 21 ID-G.
Kinetic assay
Steady state kinetic assay and data fitting were performed as described in Nomme et al.
Computational Modeling
All simulations were performed using the MCPRO 2.0 package.41 Initial coordinates were obtained from the X-ray structure of dCK in complex with compound 15c. The protein was solvated in a 30 Å water cap, represented by the TIP4P44 classical water model. Solute atoms were represented by the OPLS-AA force field45 was used. Equilibrations were performed using Metropolis Monte Carlo (MC) in the NPT ensemble at 25 °C and 1 atm. The backbone of the protein and all bond lengths within the protein were fixed; angles and torsions within 11 Å from the center of the bound molecule were sampled. All degrees of freedom of the inhibitor compound were sampled during equilibration simulations. Equilibration consisted of 5 × 10⁶ configurations of sampling in which only solvent moves were allowed, and of 10 × 106 subsequent configurations for the protein-inhibitor complex and for the lone inhibitor in solution. The equilibrated systems were then subject to free energy perturbation (FEP)/MC simulations. These simulations consisted of 14 perturbing steps of double-wide sampling. During FEP, the system underwent 5 × 10⁶ configurations of solvent equilibration, followed by 10 × 106 configurations of full equilibration, and 25 × 106 configurations of data collection. All degrees of freedom of the inhibitor were sampled except those bonds undergoing perturbation. The perturbed bond lengths were systematically varied from the original to the final length.
In Vivo MicroPET/CT Imaging Studies
Animal studies were approved by the UCLA Animal Research Committee and were carried out according to the guidelines of the Department of Laboratory Animal Medicine at UCLA. For the PET liver assay, C57BL/6 mice were intraperitoneally (i.p.) injected with the indicated amounts of dCK inhibitor (resuspended in 40% Captisol) 4 hours prior to intravenous injection of 70 μCi of 18F-L-FAC. For the tumor xenograft assay, NOD scid IL-2 receptor gamma chain knockout (NSG) bearing subcutaneous CCRF-CEM tumor xenografts were injected with 50 mg/kg of compound 36 or vehicle. Four hours posttreatment mice were injected intravenously with 70 μCi of 18F-L-FAC. For all mPET/CT studies, a 1 h interval was allowed between probe administration and mPET/CT scanning (Inveon, Siemens Medical Solutions USA Inc.; microCAT, Imtek Inc.). Static mPET images were acquired for 600s. Images were analyzed using OsiriX Imaging Software Version 3.8.
Pharmacokinetic Studies
C57Bl/6 female mice, 8 weeks of age, were injected with a single dose of indicated compounds (50 mg/kg, i.p.). Blood samples (approximately 70 μL) were collected through retro-orbital bleeding into heparinized tubes at 5 min, 15 min, 30 min, 35 min, 40 min, 45 min, 1 h, 2 h, 4 h, and 6 h. The blood samples were centrifuged at 20,000 × g for 5 min to isolate plasma. 1 mL of acetonitrile was added to 30 μL of plasma. The supernatant was transferred to new tubes and was evaporated using a SpeedVac. Samples were then resuspended in 50 μL of neat DMSO and supernatant was transferred to LC/MS sample vials. Samples were then run on an Agilent 6460 Triple Quad LC/MS.
Statistical analyses
All statistics presented as means of biological replicates with standard error of the mean (± SEM), standard deviation (± SD), or box plots with max and min whiskers. Pvalue significances were calculated using one sample Student's t test function in GraphPad Prism 5 (GraphPad Software).
Supplementary Material
Acknowledgments
We are extremely grateful to Dr. Nagichettiar Satyamurthy for his expert chemistry advice and support in designing the synthetic schemes, without his help this project would not have been possible. We thank Larry Pang and Michelle Tom for their assistance with PET/CT imaging studies, the UCLA Biomedical Cyclotron crew for producing 18F-L-FAC, and Radha Bathala for her assistance in synthesizing compound intermediates. We would also like to acknowledge Jong Lee at the UCLA Molecular Screening Shared Resource for assistance with the high-throughput screening. J.M.M. and D.N. thank the Scholars in Oncologic Molecular Imaging program for postdoctoral fellowships. This work was funded by In Vivo Cellular and Molecular Imaging Centers Developmental Project Award National Institutes of Health P50 CA86306 (C.G. Radu, H.R. Herschman, and W.R. Austin), and the US National Cancer Institute grant 5U54 CA119347 (C.G. Radu). RD would like to acknowledge support for the Molecular Screening Shared Resource from the National Cancer Center Support grant P3016042-35 (J. Gasson).
Abreviations Used
- ADA
adenosine deaminase
- dCK
deoxycytidine kinase
- dNTP
deoxyribonucleotide triphosphate
- 18F-FAC
18F-1-(2′-deoxy-2′-FluoroArabinofuranosyl) Cytosine
- TK1
thymidine kinase 1
- HTS
high throughput screen
- dC
deoxycytidine
- dG
deoxyguanosine
- dA
deoxyadenosine
- 18F-FDG
2-18F-fluoro-2-deoxy-D-glucose
- 18F-L-FAC
18F-L-1-(2′-deoxy-2′-FluoroArabinofuranosyl) Cytosine
- 3H-dC
3H-deoxycytidine
- ATP
adenosine triphosphate
- UTP
uridine triphosphate
- UDP
uridine diphosphate
- E53
glutamic acid 53
- D133
aspartic acid 133
- Q97
glutamine 97
- V55
valine 55
- L82
leucine 82
- F96
phenylalanine 96
- mPET/CT
micro positron emission tomography/computed tomography
- PK
pharmacokinetic
- PD
pharmacodynamic
- DMF
dimethylformamide
- DIBAL-H
diisobutylaluminum hydride
- EtOH
ethanol
- Rochelle's Salt
sodium potassium tartrate
- DMSO
dimethylsulfoxide
- PBS
phosphatebuffered saline
- FCS
fetal calf serum
Footnotes
Notes: The authors declare the following competing financial interest(s): C.G.R., J.C. and M.E.P. are co-founders of Sofie Biosciences, a molecular diagnostic company. They hold equity in Sofie Biosciences. The University of California also holds equity in Sofie Biosciences. Intellectual property that C.G.R. and J.C. invented and which was patented by the University of California has been licensed to Sofie Biosciences. The University of California has patented additional intellectual property invented by C.G.R., J.C., H.L., D.N., J.M.M., A.L.A., M.E.J., and A.L.
Supporting Information: Experimental details and spectroscopic data for compounds 8 – 14, 16 – 18, 25 – 36; synthetic schemes for 8a, 8b and 37; dose escalation/time course for PET assay. This material is available free of charge via the Internet at http://pubs.acs.org.
References
- 1.Reichard P. Interactions between deoxyribonucleotide and DNA synthesis. Annu Rev Biochem. 1988;57:349–374. doi: 10.1146/annurev.bi.57.070188.002025. [DOI] [PubMed] [Google Scholar]
- 2.Arner ESJ, Eriksson S. Mammalian Deoxyribonucleoside Kinases. Pharmac Ther. 1995;67:155–186. doi: 10.1016/0163-7258(95)00015-9. [DOI] [PubMed] [Google Scholar]
- 3.Sabini E, Hazra S, Ort S, Konrad M, Lavie A. Structural Basis for Substrate Promiscuity of dCK. J Mol Biol. 2008;378:607–621. doi: 10.1016/j.jmb.2008.02.061. [DOI] [PMC free article] [PubMed] [Google Scholar]
- 4.Pasti C, Gallois-Montbrun S, Munier-Lehmann H, Vernon M, Gilles AM, Deville-Bonne D. Reaction of Human UMP-CMP Kinase with Natural and Analog Substrates. Eur J Biochem. 2003;270:1784–1790. doi: 10.1046/j.1432-1033.2003.03537.x. [DOI] [PubMed] [Google Scholar]
- 5.Krishnan P, Gullen EA, Lam W, Dutschman GE, Grill SP, Cheng YC. Novel Role of 3-Phosphoglycerate Kinase, a Glycolytic Enzyme, in the Activation of L-Nucleoside Analogs, a new class of Anticancer and Antiviral Agents. J Biol Chem. 2003;278:36726–36732. doi: 10.1074/jbc.M307052200. [DOI] [PubMed] [Google Scholar]
- 6.Toy G, Austin WR, Liao HI, Cheng D, Singh A, Campbell DO, Ishikawa To, Lehmann LW, Satyamurthy N, Phelps ME, Herschman HR, Czernin J, Witte ON, Radu CG. Requirement for Deoxycytidine Kinase in T and B Lymphocyte Development. Proc Natl Acad Sci U S A. 2010;107:5551–5556. doi: 10.1073/pnas.0913900107. [DOI] [PMC free article] [PubMed] [Google Scholar]
- 7.Austin WR, Armijo AL, Campbell DO, Singh AS, Hsieh T, Nathanson D, Herschman HR, Phelps ME, Witte ON, Czernin J, Radu CG. Nucleoside Salvage Pathway Kinases Regulate Hematopoiesis by Linking Nucleotide Metabolism with Replication Stress. J Exp Med. 2012;209:2215–2228. doi: 10.1084/jem.20121061. [DOI] [PMC free article] [PubMed] [Google Scholar]
- 8.Van Rompay AR, Johansson M, Karlsson A. Substrate Specificity and Phosphorylation of Antiviral and Anticancer Nucleoside Analogs by Human Deoxyribonucleoside Kinases and Ribonucleoside Kinases. Pharmacol Ther. 2003;100:119–139. doi: 10.1016/j.pharmthera.2003.07.001. [DOI] [PMC free article] [PubMed] [Google Scholar]
- 9.Yang C, Lee M, Hao J, Cui X, Guo X, Smal C, Bontemps F, Ma S, Liu X, Engler D, Parker WB, Xu B. Deoxycytidine kinase regulates the G2/M checkpoint through interaction with cyclin-dependent kinase 1 in response to DNA damage. Nucleic Acids Res. 2012;40(19):9621–32. doi: 10.1093/nar/gks707. [DOI] [PMC free article] [PubMed] [Google Scholar]
- 10.Tarver JE, Jessop TC, Carlsen M, Augeri DJ, Fu Q, Healy JP, Heim-Riether A, Xu A, Taylor JA, Shen M, Keyes PE, Kimball SD, Yu XC, Miranda M, Liu Q, Swaffield JC, Nouraldeen A, Wilson AGE, Rinch R, Jhaver K, Foushee AMD, Anderson S, Oravecz T, Carson KG. 5-Fluorocytosine Derivatives as Inhibitors of Deoxycytidine Kinase. Bioorg Med Chem Lett. 2009;19:6780–6783. doi: 10.1016/j.bmcl.2009.09.082. [DOI] [PubMed] [Google Scholar]
- 11.Yu XC, Miranda M, Liu Z, Patel S, Nguyen N, Carson K, Liu Q, Swaffield JC. Novel Potent Inhibitors of Deoxycytidine Kinase Identified and Compared by Multiple Assays. J Biomol Screening. 2010;15:72–79. doi: 10.1177/1087057109353604. [DOI] [PubMed] [Google Scholar]
- 12.Ward AD, Baker BR. Irreversible Enzyme Inhibitors: Active-Site-Directed Inhibitors of Deoxycytidine Kinase. J Med Chem. 1977;20:88–92. doi: 10.1021/jm00211a018. [DOI] [PubMed] [Google Scholar]
- 13.Jessop TC, Tarver JE, Carlsen M, Xu A, Healy JP, Heim-Riether A, Fu Q, Taylor JA, Augeri DJ, Shen M, Stouch TR, Swanson RV, Tari LW, Hunger M, Hoffman I, Keyes PE, Yu XC, Miranda M, Liu Q, Swaffield JC, Kimball SD, Nouraldeen A, Wilson AGE, Foushee AMD, Jhaver K, Finch R, Anderson S, Oravecz T, Carson KG. Lead Optimization and Structure-based Design of Potent and Bioavailable Deoxycytidine Kinase Inhibitors. Bioorg Med Chem Lett. 2009;19:6784–6787. doi: 10.1016/j.bmcl.2009.09.081. [DOI] [PubMed] [Google Scholar]
- 14.Weber WA, Grosu AL, Czernin J. Technology Insight: Advances in Molecular Imaging and an Appraisal of PET/CT Scanning. Nat Clin Prac Oncol. 2008;5:160–170. doi: 10.1038/ncponc1041. [DOI] [PubMed] [Google Scholar]
- 15.Czernin J, Benz MR, Allen-Auerbach MS. PET/CT Imaging: The Incremental Value of Assessing the Glucose Metabolic Phenotype and the Structure of Cancers in a Single Examination. Eur J Radiol. 2010;73:470–480. doi: 10.1016/j.ejrad.2009.12.023. [DOI] [PubMed] [Google Scholar]
- 16.Gambhir SS. Molecular Imaging of Cancer with Positron Emission Tomography. Nat Rev Cancer. 2002;2:683–693. doi: 10.1038/nrc882. [DOI] [PubMed] [Google Scholar]
- 17.Rigo P, Paulus P, Kaschten BJ, Hustinx R, Bury T, Jerusalem G, Benoit T, Foidart Willems J. Oncological Application of Positron Emission Tomography with Fluorine-18. Eur J Nucl Med. 1996;23:1641–1674. doi: 10.1007/BF01249629. [DOI] [PubMed] [Google Scholar]
- 18.Wood KA, Hoskin PJ, Saunders MI. Positron Emission Tomography in Oncology: A Review. Clin Oncol. 2007;19:237–255. doi: 10.1016/j.clon.2007.02.001. [DOI] [PubMed] [Google Scholar]
- 19.Weber WA. Positron Emission Tomography as an Imaging Biomarker. J Clin Oncol. 2006;24:3282–3292. doi: 10.1200/JCO.2006.06.6068. [DOI] [PubMed] [Google Scholar]
- 20.Oriuchi N, Higuchi T, Ishikita T, Miyakubo M, Hanaoka H, Iida Y, Endo K. Present Role and Future Prospects of Positron Emission Tomography in Clinical Oncology. Cancer Sci. 2006;97:1291–1297. doi: 10.1111/j.1349-7006.2006.00341.x. [DOI] [PMC free article] [PubMed] [Google Scholar]
- 21.Jadvar H, Alavi A, Gambhir SS. 18F-FDG Uptake in Lung, Breast, and Colon Cancers: Molecular Biology Correlates and Disease Characterization. J Nucl Med. 2009;50:1820–1827. doi: 10.2967/jnumed.108.054098. [DOI] [PMC free article] [PubMed] [Google Scholar]
- 22.Hargreaves RJ. The Role of Molecular Imaging in Drug Discovery and Development. Clin Pharmacol Ther. 2008;83:349–353. doi: 10.1038/sj.clpt.6100467. [DOI] [PubMed] [Google Scholar]
- 23.Wang JL, Maurer L. Positron Emission Tomography: Applications in Drug Discovery and Drug Development. Curr Top Med Chem. 2005;5:1053–1075. doi: 10.2174/156802605774297056. [DOI] [PubMed] [Google Scholar]
- 24.Wagner CC, Muller M, Lappin G, Langer O. Positron Emission Tomography for Use in Microdosing Studies. Curr Opin Drug Discov Devel. 2008;11:104–110. [PubMed] [Google Scholar]
- 25.Laing RE, Walter MA, Campbell DO, Herschman HR, Satyamurthy N, Phelps ME, Czernin J, Witte ON, Radu CR. Noninvasive Prediction of Tumor Responses to Gemcitabine using Positron Emission Tomography. Proc Natl Acad Sci U S A. 2009;106:2847–2852. doi: 10.1073/pnas.0812890106. [DOI] [PMC free article] [PubMed] [Google Scholar]
- 26.Radu CG, Shu CJ, Nair-Gill E, Shelly SM, Barrio JR, Satyamurthy N, Phelps ME, Witte ON. Molecular Imaging of Lymphoid Organs and Immune Activation by Positron Emission Tomography with a new [18F]-labeled 2′-deoxycytidine Analog. Nat Med. 2008;14:783–788. doi: 10.1038/nm1724. [DOI] [PMC free article] [PubMed] [Google Scholar]
- 27.Shu CJ, Campbell DO, Lee JT, Tran AQ, Wengrod JC, Witte ON, Phelps ME, Satyamurthy N, Czernin J, Radu CR. Novel PET Probes Specific for Deoxycytidine Kinase. J Nucl Med. 2010;51:1092–1098. doi: 10.2967/jnumed.109.073361. [DOI] [PMC free article] [PubMed] [Google Scholar]
- 28.Fan F, Wood KV. Bioluminescent assays for high-throughput screening. Assay Drug Dev Technol. 2007;5:127–136. doi: 10.1089/adt.2006.053. [DOI] [PubMed] [Google Scholar]
- 29.Müller K, Faeh C, Diederich F. Fluorine in Pharmaceuticals: Looking Beyond Intuition. Science. 2007;317:1881–1886. doi: 10.1126/science.1131943. [DOI] [PubMed] [Google Scholar]
- 30.Park BK, Kitteringham NR, O'Neill PM. Metabolsim of Fluorine-containing Drugs. Annu Rev Pharmacol Toxicol. 2001;41:443–470. doi: 10.1146/annurev.pharmtox.41.1.443. [DOI] [PubMed] [Google Scholar]
- 31.Crane LJ, Anastassiadou M, Stigliani JL, Baziard-Mouysset G, Payard M. Reactions of Some Ortho and Para Halogenated Aromatic Nitriles with Ethylenediamine: Selective Synthesis of Imidazolines. Tetrahedron. 2004;60:5325–5330. [Google Scholar]
- 32.Okonya JF, Hoffman RV, Johnson MC. Synthesis of 2-Oxazolone-4-Carboxylates from 3-Nosyloxy- and 3-Bromo-2-ketoesters. J Org Chem. 2002;67:1102–1108. doi: 10.1021/jo010630z. [DOI] [PubMed] [Google Scholar]
- 33.Trullinger TK, Hunter R, Garizi N, Yap MCH, Buysse AM, Pernich D, Johnson TC, Bryan K, Deamicis C, Zhang Y, Niyaz NM, McLeod CL, Ross R, Zhu Y, Johnson PL, Eckelbarger JD, Parker MH. Patent application US 2010/0292253 A1 Pesticidal Compositions.
- 34.Joseph KM, Larraza-Sanchez I. Synthesis of Benzyl Bromides with Hexabromoacetone: an Alternative Path to Drug Intermediates. Tetrahedron Lett. 2011;52:13–16. [Google Scholar]
- 35.Laxer A, Major DT, Gottlieb HE, Fischer B. (15N5)-Labeled Adenine Derivatives: Synthesis and Studies of Tautomerism by 15N NMR Spectroscopy and Theoretical Calculations. J Org Chem. 2001;66:5463–5481. doi: 10.1021/jo010344n. [DOI] [PubMed] [Google Scholar]
- 36.Chottiner EG, Shewach DS, Datta NS, Ashcraft E, Gribbin D, Ginsburg D, Fox IH, Mitchell BS. Cloning and Expression of Human Deoxycytidine Kinase cDNA. Proc Natl Acad Sci U S A. 1991;88:1531–1535. doi: 10.1073/pnas.88.4.1531. [DOI] [PMC free article] [PubMed] [Google Scholar]
- 37.Shewach DS, Reynolds KK, Hertel L. Nucleotide Specificity of Human Deoxycytidine Kinase. Mol Pharmacol. 1992;42:518–524. [PubMed] [Google Scholar]
- 38.Metropolis N, Ulam S. The Monte Carlo Method. J Am Statistical Assn. 1949;44:335–341. doi: 10.1080/01621459.1949.10483310. [DOI] [PubMed] [Google Scholar]
- 39.Zwanzig RW. High-Temperature Equation of State by a Perturbation Method. J Chem Phys. 1954;22:1420–1426. [Google Scholar]
- 40.Jorgensen WL, Thomas LL. Perspective on Free-Energy Perturbation Calculations for Chemical Equilibria. J Chem Theory Comput. 2008;4:869–876. doi: 10.1021/ct800011m. [DOI] [PMC free article] [PubMed] [Google Scholar]
- 41.Jorgensen WL, Tirado-Rives J. Molecular Modeling of Organic and Biomolecular Systems Using BOSS and MCPRO. J Comput Chem. 2005;26:1689–1700. doi: 10.1002/jcc.20297. [DOI] [PubMed] [Google Scholar]
- 42.Shu YZ, Johnson BM, Yang TJ. Role of biotransformation studies in minimizing metabolism-related liabilities in drug discovery. AAPS. 2008;10:178–192. doi: 10.1208/s12248-008-9016-9. [DOI] [PMC free article] [PubMed] [Google Scholar]
- 43.Bhattacharyya S. Application of Positron Emission Tomography in Drug Development. Biochem Pharmacol. 2012;1:1000e128. doi: 10.4172/2167-0501.1000e128. [DOI] [PMC free article] [PubMed] [Google Scholar]
- 44.Jorgensen WL, Chandrasekhar J, Madura JD, Impey RW, Klein ML. Comparison of Simple Potential Functions for Simulating Liquid Water. J Chem Phys. 1983;79:926–935. [Google Scholar]
- 45.Jorgensen WL, Maxwell DS, Tirado-Rives J. Development and Testing of the OPLS All-Atom Force Field on Conformational Energetics and Properties of Organic Liquids. J Am Chem Soc. 1996;118:11225–11236. [Google Scholar]
Associated Data
This section collects any data citations, data availability statements, or supplementary materials included in this article.