Abstract
Collagen's success as the principal structural element in load-bearing, connective tissue has motivated the development of numerous engineering approaches designed to recapitulate native fibril morphology and strength. It has been shown recently that collagen fibers can be drawn from monomeric solution through a fiber forming buffer (FFB), followed by numerous additional treatments in a complex serial process. However, internal fibril alignment, packing and resultant mechanical behavior of the fibers have not been optimized and remain inferior to native tissue. Further, no system has been developed which permits simultaneous application of molecular crowding, measurement of applied load, and direct observation of polymerization dynamics during fiber printing. The ability to perform well-controlled investigations early in the process of fiber formation, which vary single input parameters (i.e. collagen concentration, crowding agent concentration, draw rate, flow rate, temperature, pH, etc.) should substantially improve fiber morphology and strength. We have thus designed, built, and tested a versatile, in situ, optically-based, micromechanical assay and fiber printing system which permits the correlation of parameter changes with mechanical properties of fibers immediately after deposition into an FFB. We demonstrate the sensitivity of the assay by detecting changes in the fiber mechanics in response to draw rate, collagen type, small changes in the molecular crowding agent concentration and to variations in pH. In addition we found the ability to observe fiber polymerization dynamics leads to intriguing new insights into collagen assembly behavior.
Keywords: Collagen, Polyethylene glycol, Tissue engineering, Fiber extrusion, Biomimetic
1. Introduction
1.1. Role of collagen
Load-bearing, connective tissues sustain tremendous forces during joint activation and stabilization of the mechanically disadvantaged human musculoskeletal system. This often results in a high rate of injury and is exacerbated by the fact that such tissues are generally refractory to both healing and repair due to their low vascularity, cell population, and cellular metabolisms [1–3]. Their high loading, poor healing, and essential role in mobility have led to over eighty years of investigation [4]. For tensile strength, connective tissues depend on fibril forming collagens, which comprise 75–85% of their dry weight [5–7]. Tissues such as tendons and ligaments are capable of enduring the extreme loading regimes primarily due to the packing, alignment, and cross-linking of the collagen. Successful engineering of replacement connective tissue using natural collagen will be highly dependent on the ability to control nanoscale collagen fibrillar organization.
Monomeric collagen is unique in that it comprises three left-handed helical alpha chains [8] which intertwine to form a right-handed, 300 nm long and 1.5 nm diameter [9] coiled supramolecular assembly. Each alpha chain has a repeating sequence of Gly– X–Y [10–12], where X and Y are frequently proline (28%) and hydroxyproline (38%), respectively [13]. The triple-helical region persists for 1014 residues and is capped by an amino (16 α1, 9 α2 residues) and carboxyl (26 α1, 25 α2 residues) telopeptide extension [14]. While more than 28 distinct collagen gene sequences have been identified [15,16], the majority of attention has been placed on fibril forming types (I, II, III, V, and XI).
Collagen monomers are assembled into native fibrils which are the most basic, continuous structural element in connective tissues. An immense amount of effort has been spent to fully characterize the complexity of the molecular positioning within fibrils. In 1942 Richard Bear, using low-angle X-ray diffraction, and Hall et al., using electron microscopy, made a significant contribution in determining that type I collagen fibrils from multiple species all share a common D-periodic banding pattern of 64–67 nm [17,18]. In later work Hulmes et al. correctly posited that the triple helices are arranged quasi-hexagonally with respect to each other within the fibril [19]. Most recently, Orgel et al. has shown a new layer of hierarchical structure comprising five neighboring monomers which form their own right-handed microfibril [20]. This higher-ordered supramolecular structure is helical in nature and interdigitates with neighboring microfibrils to form the basis of the fibril [21]. It is not yet understood why these different levels of organization appear to be essential for development of load-bearing material. However, with a more complete understanding of the substructures, we gain rubrics by which we can measure our own success in replicating native tissue.
1.2. In vivo collagen organization theory
In addition to the work done to characterize collagen fibril structure, efforts have also been made to understand how cells might secrete an organized collagen matrix in vivo. One leading theory suggests that cells are directly responsible for the placement of each collagen fibril. According to Canty et al., collagen propeptides are internally cleaved and trafficked to a plasma membrane invagination, termed a fibripositor [22,23]. It is here that the collagen is arranged into fibrils to be deposited into the extracellular matrix, aligned longitudinally along the tendon axis. However, Canty et al. state that this fibripositor structure only exists during an early period of embryonic development, requiring at least one more method to explain continual growth and development [22]. A second theory postulates that cells utilize the liquid crystalline behavior of high aspect ratio molecules, such as collagen, to produce self-aligned fibrils. Hukins et al. first recognized the smectic A and smectic C behavior of native tissue and theorized that this property could provide insight into tissue formation [24,25]. Many different laboratories have attempted to organize collagen in a manner mimetic of these two postulates.
1.2.1. Liquid crystal based approach
Giraud-Guille et al. demonstrated that monomeric solutions of collagen held at an acidic pH would display cholesteric, liquid crystal behavior once the concentration reached approximately 100 mg/ml [26,27]. Following this work, Martin et al. asked the question whether this behavior had the potential to occur under native conditions [28]. Indeed, nematic, pre-cholesteric, and cholesteric characteristics were observed as the concentrations increased from 5 to 30 mg/ml, when using procollagen at physiological pH and ionic strength [28].
1.2.2. Fibripositor based approach
Twenty years ago, the work performed by Kato et al. introduced a model design for extruding collagen into a fibril forming buffer (FFB) [29,30]. Collagen was injected through tubing into an aqueous bath, which was held at physiological temperature, pH, and ionic strength. The fiber was transported via a conveyor belt to an isopropyl dehydration stage, next to a distilled water wash station, then allowed to air dry, and finally collected on a spool. Following this model, Kato et al. and Dunn et al. characterized the extruded collagen with mechanical testing of fibers produced from different size tubing as well as those exposed to various cross-linking techniques [30,31]. In 1993, Cavallaro et al. made a significant modification by using polyethylene glycol (PEG) as the FFB. This hypertonic environment causes molecular crowding of the monomers, generating a denser collagen fiber which may be continuously extruded without fractures [32]. Since this work, numerous investigators have continued using variations of the model design in combination with the PEG FFB [33–40].
1.2.3. Limitations to FFB fiber printing
While mechanical properties, biocompatibility, and production rates have improved greatly over the past two decades, experiments have still failed to attain complete control over fibril organization. In 2009, Caves et al. were able to print at 60 m/h, however they state that their collagen alignment was not uniform [34] and their fibers were not comparable in strength to native tendon. In spite of significant gains in throughput and mass production and moderate gains in mechanical properties, achieving native collagen fiber strength remains a significant challenge [41]. Although the fiber modulus can be improved via numerous available cross-linking techniques, they are typically associated with cytotoxicity, integration, and degradative issues [42–44]. Furthermore, cross-linking does not address what we believe is the fundamental problem underlying the inadequate mechanical performance of FFB derived fibers: poor molecular/fibrillar alignment within the fibers. Thus, there remains a need to develop methods which exert control over the nanoarchitecture of the fibers, preferably at the time of drawing, when the collagen molecular kinetics maybe more readily controlled. Failing to address this issue and simply using disorganized scaffolds may improperly template the cellular patterning via contact guidance [45]. As stated in 2011 by Caliari et al., “ …a range of studies have suggested that successful regeneration templates for natively aligned tissues such as peripheral nerves, the myocardium, and tendon must provide tissue specific aligned contact guidance cues that recapitulate aspects of the tissue anisotropy [46].”
1.2.4. Addressing the limitations
To increase collagen alignment in printed fibers, we consider how this might be achieved in vivo. The coordination required for cells to communicate and orchestrate the handling and placement of every collagen monomer and fibril appears excessively complex. We have proposed a simpler hypothesis, where, in place of direct cellular control there exist guiding cues which make it energetically favorable for the collagen molecules and microfibrils to shift into alignment. We believe that this signal is potentially tensile strain and that it may be coupled with molecular crowding to produce organization. However, no system currently exists in which this hypothesis may be effectively tested. We have therefore designed an optically-based micromechanical testing and fiber printing device. While previous methods perform the mechanical testing after significant post-processing (fiber relocation through the surface tension of fluids, dehydrating, rehydrating, and pre-straining [29–40]), our device is located on an optical microscope for magnified, real-time imaging and for in situ mechanical testing. One additional benefit is that it scales down the use of consumables and size of the system (previously a fifteen foot long FFB setup [34], nowa one inch long chamber). With this configuration, we can perform parameter manipulations and mechanical testing to infer how the fibril structure was affected by parameter manipulation, coupled with qualitative and quantitative information gathered through light microscopy.
2. Material and methods
2.1. Collagen sources
The collagen printing and mechanical testing protocol were developed using bovine type I atelo-collagen in the form of monomeric solution (5005-B, Advanced Biomatrix, San Diego, CA) purchased at 3 mg/ml concentration in 0.01 m HCL. Because this collagen source was pepsin extracted, the monomers lack intact native telopeptides [47]. For comparison, some experiments were performed using acetic acid extracted, type I tropocollagen from 1 year old bovine sclera (Research 87, Boylston, MA). Acetic acid extraction of collagen retains the telopeptides which can influence the assembly kinetics and morphology of the assembled fibrils [48,49].
2.2. Isolation and purification of tropocollagen
To isolate the bovine scleral collagen, the scleral bulbs were separated from the cornea, fat, muscle, optic nerve, and retina. The sclera was thoroughly washed with deionized water, diced, and placed in 0.4 m acetic acid for extraction at 4 °C for 3 days. The solution was passed through a polystyrene 0.5 cm sieve and then through a 0.3 mm mesh to separate out the solid, cross-linked tissue. To further separate out the finer tissue material, the solution was centrifuged at 8000 rpm at 6 °C for 45 min and the supernatant was collected. Upon achieving a transparent solution, the acidic collagen solution was subjected to a sodium chloride precipitation at 3.5% wt./vol at 4 °C for 12 h. The precipitated collagen was then centrifuged at 8000 rpm at 6 °C, the supernatant was discarded, and the pellet was resuspended in 0.01 m HCl. This step was repeated to separate out the precipitated collagen that would not fully dissolve. The solution was concentrated through reverse-dialysis in 3500 molecular weight cut-off tubing (133198, Spectrum Labs, Rancho Dominguez, CA) against 20% wt./sol. wt. PEG (Sigma Aldrich, St. Louis, MO), in 0.01 m HCl. The solution of collagen was then dialyzed in 50,000 molecular weight cut-off tubing (132129, Spectrum Labs, Rancho Dominguez, CA) against 0.01 m HCl to ensure that the solution was free of PEG and collagen fragments. Finally, the monomeric solution was passed through a 0.45 μm filter (09-719-007, Fisher Scientific, Waltham, MA). Solution purity was verified through an SDS PAGE (456-9036, Bio-rad, Hercules, CA), shown in Supplementary Fig. 1. Supplementary Fig. 1A displays the molecular weights found in commercially available PureCol collagen, while Supplementary Fig. 1B provides the molecular weight ladder associated with the gel. Supplementary Fig. 1C displays the extracted scleral collagen, demonstrating successful removal of impurities and partially digested protein. Both collagen sources were brought to a final concentration of 1.8 mg/ml in 0.01 m HCl for all testing, verified through a Sircol assay (S1005, Biocolor, United Kingdom).
2.3. Assembly kinetics assay
It is well documented that the intactness of the telopeptides has a significant impact on fibrillogenesis kinetics [48,50,51]. Thus, to investigate the success of the acetic acid extraction on preserving the telopeptides, a turbidity assay was performed using a Powerwave XS Spectrophotometer (BioTek, Winooski, VT). Performed at 37 °C, 200 μl of neutralized 0.5 mg/ml tropocollagen and atelo-collagen, n = 3 for each, was scanned for absorbance using a wavelength of 313 nm.
2.4. Collagen fiber printing
Prior to printing collagen fibers, a 0.4 ml supply of collagen solution was seeded with 0.15 μl of 3 μm polystyrene bead suspension (09850, Polysciences, Warrington, PA), purchased at a concentration of 1.68 × 10⁹ particles/ml. These beads served as markers, embedded along the fiber length, to allow for the measurement of local strain. A custom printing apparatus, operated on a TE-2000E inverted microscope (Nikon, Melville, NY), facilitated the production of collagen fibers, as shown in Supplementary Fig. 2. The chamber was filled with 750 μl of 30 or 35% wt./sol. wt. PEG in 1 × PBS at a pH of 7.3. The PEG served as a molecular crowding agent to “force” molecular association of the collagen monomers. The PEG concentration was chosen based on the 30% PEG concentration used by Girard-Guille et al. to produce liquid crystalline collagen with high local alignment [52,53]. Our intent was to extend the tested range to 35% and then to 40% (approaching the maximum solubility limit); however evaporation during time required to run an experiment caused the 40% PEG to precipitate.
A calibrated glass micro-needle was lowered into the chamber to serve as an anchor point for the collagen printing. To deliver precise volumes and flow rates of the collagen solution, the printer assembly utilized a syringe pump (PHD 2000, Harvard Apparatus, Holliston, MA) with a stiff transmission line comprising 1) a glass syringe (81320, Hamilton Company, Reno, NV); 2) relatively inextensible polyether ether ketone (PEEK) tubing; 3) a steel extension tube (held in a micro-manipulator) and 4) a 100 μm ID stainless steel needle (9990448, Integrated Dispensing Solutions, Agoura Hills, CA).
This printer assembly was primed with collagen solution and then lowered into the chamber, approximately 20 μm away from the calibrated micro-needle. Once in position, the flow was started and 1–2 s were allotted for the collagen solution to encompass the calibrated micro-needle. Next, the printer assembly began moving away at 1750 μm/s for a distance of 12.5 mm, at which point the syringe pump was manually turned off. Seconds after completing the print, the collagen solidified within and around the printer needle, as well as around the calibrated micro-needle. The syringe pump was operated under one of three flow rates depending on the experiment. The flow rate was termed 100% when the average fluid velocity out of the printer needle was equal and opposite to the velocity of the printer assembly moving away from the calibrated micro-needle. The flow was termed 75% or 50% when the average fluid velocity was set to the respective percentage of the velocity of the printer assembly. These values would be analogous to draw ratios of 1:1, 1:0.75 and 1:0.50.
2.5. Pipette stiffness calibration
A 1 mm diameter, borosilicate glass rod was pulled into a finely tipped microneedle using a custom program on a P-97 Micropipette Puller (BR-100-10, Sutter Instruments, Novato, CA). Micro-needle stiffness was determined by following the protocol described by Flynn et al. [54]. Briefly, the profile of the micro-needle was imaged using a 20× objective on a TE-2000E inverted microscope. The moment equation for beam bending was numerically integrated over the length of the microneedle, and a bending stiffness in terms of nN/μm of deflection was calculated for every χ-location along the length. A finite element non-linear analysis (SolidWorks, Waltham, MA) was performed to determine at which magnitude of tip displacement the stiffness would shift by 5%. The micro-needle stiffness reduced to 95% original stiffness at approximately 450 μm tip displacement. During testing, micro-needles were pulled with an appropriate stiffness to allow for a 10% collagen fiber strain, while having tip displacements less than 300 μm.
2.6. Analysis of cross-sectional area
The fiber printing process consistently yielded fibers of visually uniform diameter along the 12.5 mm length, with increased dimensions at either attachment point. Observed by z-scanning with differential interference contrast light microscopy, the cross-sectional geometry initially appeared circular, as expected due to the uniform hypertonic PEG environment acting on the printed column of collagen solution. However, shortly after printing, the structure had taken on folds, ridges, and crevices. To normalize for water content in the printed fiber and to facilitate comparison to well-packed tendons, the cross-sectional area was defined as the total cross-sectional area of the collagen molecules in the fiber cross-section, which is independent of the PEG concentration. The number of collagen molecules was calculated from the initial collagen concentration, flow rate, and printing velocity. Every 300 nm, approximately 6.74e6, 5.06e6, and 3.37e6 monomers were deposited into the fiber for 100%, 75%, and 50% flow rate, respectively. From this, the total collagen monomer cross-sectional area could be determined, using a monomer diameter of 1.5 nm. This approach resulted in an effective cross-sectional area of 11.92, 8.94, and 5.96 μm2 for 100%, 75%, and 50% flow rate, respectively.
2.7. Mechanical testing
2.7.1. Stepped, static mechanical testing protocol
Fibers printed into the PEG visually reached their final structural geometry within the first few minutes; however, each fiber was given 15 min to equilibrate with the PEG before mechanical testing. The mechanical testing was a three step process, automated through custom code written in the microscope software, NIS Elements (Nikon, NY). First, a region of the fiber containing two marker beads separated by 150–350 μm was identified, imaged, and measured using edge detection algorithms. The algorithm required the recognized image of the bead to have a minimum diameter of 2.5 μm. This led to a maximum positional error of 0.25 μm in locating the center of each bead, or equivalently, a total 0.50 μm error in estimating the length separating the two beads. Second, an image of the calibrated micro-needle was captured with respect to a constant position, which permitted tracking of the micro-needle displacement throughout testing. The point of applied load on the micro-needle was designated as where the long axis of the fiber intersected with the micro-needle. Third, the printer assembly generated strain by moving 100 μm away at a rate of 10 μm/s. Once the 100 μm displacement was complete, the fiber was given 35 s before the position of the calibrated micro-needle was captured and another 35 s for the microscope stage to return to the region of fiber with the two marker beads. This process continued until the fiber had reached a 10% strain, as calculated by NIS Elements. Stress–strain testing was performed predominantly on the purchased atelo-collagen, PureCol, due to its high purity and commercial availability. A baseline stress–strain curve was produced using 30% PEG and 100% flow rate. Tropocollagen was printed under the same conditions to ensure no unexpected behavioral changes.
2.7.2. Stress relaxation testing protocol
Stress relaxation testing was implemented to determine whether the time invariant modulus or the viscoelastic behavior was primarily responsible for the change in stress–strain curves. The two conditions tested were those which yielded the shallowest and steepest stress–strain curve. Each fiber was printed under its respective conditions and given 15 min to polymerize. An initial positioning of two marker beads was taken prior to testing, such that the strain could be measured as described in the mechanical testing section. The printer needle was used to increase the length of the fiber by 250 μm, at a rate of 10 μm/s, and the calibrated microneedle was imaged every 5 s for 300 s. At 300 s, the microscope stage shifted to the location of the marker beads and an image was taken to calculate strain. The process was repeated five times such that six stress relaxation curves were produced from each printed fiber.
The experimental data was fitted to a Generalized Maxwell–Weichert model, commonly used for modeling the viscoelastic behavior of collagen [55,56]. The model serves as an adaptation of Fung's quasi-linear viscoelastic model [57], which comprises a variable amount of Maxwell elements (a spring in series with a dashpot) in parallel with an additional spring. The multiple Maxwell–Weichert elements are used to account for different relaxation time scales resulting from different physical sources. The data was modeled using one through four elements and curve fit using a Levenberg–Marquardt approach. The model that produced the fewest coefficient sets with a R2 above 0.90 was selected as the optimum fit.
2.8. Scanning electron microscopy
Fibers produced for scanning electron microscopy (SEM) were printed, fixed, and dehydrated directly in the custom flow chamber at room temperature. Prior to using the flow chamber, we attempted to raise the fiber out of the PEG solution and place it into primary fixative. During extraction we noticed severe plastic elongation of the fiber as it exited the surface of the PEG. This technique was discontinued to prevent artificial, strain-induced alignment [58]. Instead, the fiber was fixed directly in the chamber via a series of fluid exchanges prior to extraction for SEM imaging. All fluid exchanges comprised a volume of 5 ml, transferred at 4 ml/h. During exchanges the calibrated micro-needle was observed to ensure there was minimal loading produced by the flow. The tip displacement from the fluid flow was always less than 10 μm, resulting in insignificant strain for a 12.5 mm fiber.
The first fluid exchange was with the same concentration of PEG and the addition of 4% glutaraldehyde at 7.3 pH. The fixative was given 45 min to cross-link the collagen fiber, after the full 5 ml were flowed into the chamber. This was followed by a second fluid exchange to 35% ethanol, a third fluid exchange to 70% ethanol, and a fourth fluid exchange to 100% ethanol. Finally, the fiber was raised from the chamber at 10 μm/s, placed on a glass cover slip, sputter coated in gold-palladium, and captured for examination under the S-4800 scanning electron microscope (Hitachi, Japan).
2.9. Fast Fourier transform (FFT) analysis
FFT is a powerful mathematical tool for image analysis. It converts an image from the spatial domain to the frequency domain to reveal edge alignment and repeating patterns. In our case, the FFT method was used to quantify the orientation of collagen fibrils from an SEM of a printed fiber. All SEM images were imported into NIH – ImageJ software for histogram stretching to enhance edge clarity. Custom coding was written and tested in MATLAB to perform FFT on our SEM images. A plot of the frequency domain was generated to qualitatively display the fibril alignment within the collagen fiber, as well as a polar plot of the angular distribution of fibrils for quantitative analysis. Histogram bin size was set to 1°, and angular orientations were considered between 0 and 180°. The smallest range of orientations containing 70% of the fibril edges was reported, with a smaller range indicating a higher degree of organization.
2.10. Statistical analysis
Statistical analysis was performed in Excel using the Student's t-test to determine if two groups of data were significantly different. A two-tailed distribution and two-sample equal variance t-test was selected. Data was considered statistically different for p-values below 0.05. With respect to the mechanical testing, statistical analysis was performed at each strain value when comparing two distinct collagen printing conditions and the highest p-value was reported.
3. Results
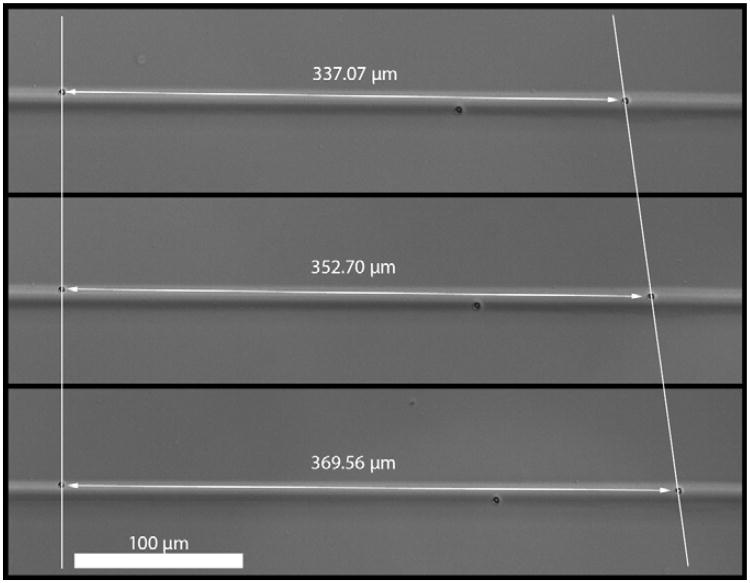
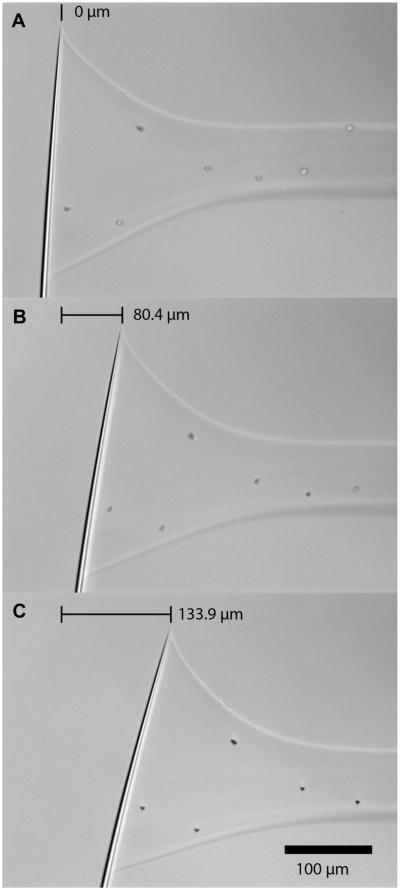
The collagen printing setup, which was designed for mechanical testing and fluid exchange, is depicted in Supplementary Fig. 2. A strained fiber with marker beads and typical micro-needle displacements are shown in Figs. 1 and 2, respectively. All test conditions explored and physical/mechanical parameters found are presented in Table 1.
Fig. 1.
Typical collagen fiber with two marker beads used for strain measurement. The upper image is the fiber after printing. The middle image is the fiber at ∼5% strain. The bottom image is the fiber at ∼10% strain.
Fig. 2.
Calibrated micro-needle tip displacement during a stress-strain test. A) 0% strain. B) ∼5% strain. C) ∼10% strain.
Table 1.
Summarizes the results of the stepped, static mechanical testing.
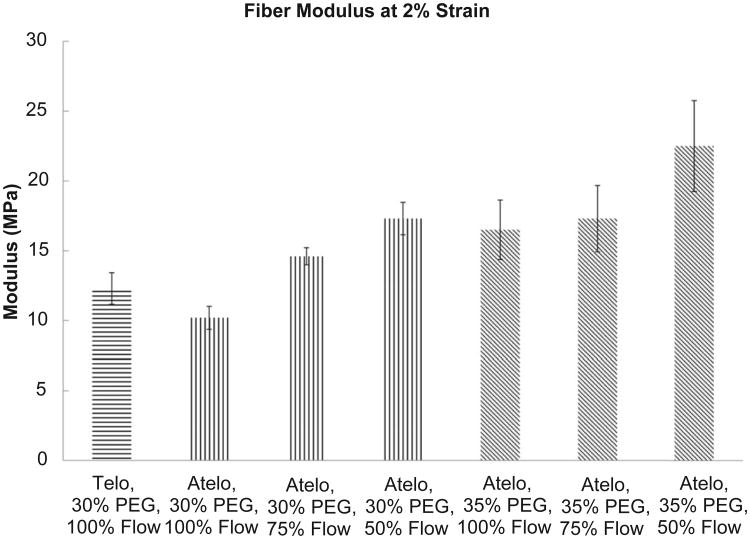
| Collagen type | Starting concentration (mg/ml) | Samples tested | Flow rate | Polyethylene glycol concentration (wt/wt%) | Average # of monomers per 300 nm | Single monomer cross-sectional area (μm2) | Total collagen cross-sectional area (μm2) | Modulus at 2% strain (MPa) |
|---|---|---|---|---|---|---|---|---|
| Telo | 1.8 pH 2.0 | 6 | 100% | 30% pH 7.3 | 6.74E+06 | 1.77E-06 | 11.92 | 12.3 ± 1.13 |
| Atelo | 6 | 10.2 ± 0.82 | ||||||
| 6 | 75% | 5.06E+06 | 8.94 | 14.6 ± 0.61 | ||||
| 6 | 50% | 3.37E+06 | 5.96 | 17.3 ± 1.16 | ||||
| 7 | 100% | 35% pH 7.3 | 6.74E+06 | 11.92 | 16.5 ± 2.12 | |||
| 6 | 75% | 5.06E+06 | 8.94 | 17.3 ± 2.37 | ||||
| 6 | 50% | 3.37E+06 | 5.96 | 22.5 ± 3.25 |
3.1. Assembly kinetics
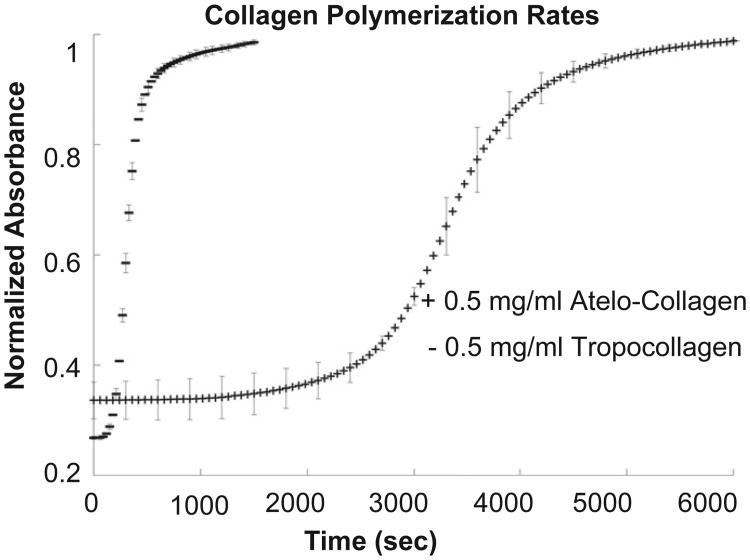
Shown in Fig. 3, the tropocollagen reaches 50% of maximum absorbance approximately six times faster than the atelo-collagen. The parameters tested for significance were the time to reach 50% maximum absorbance, linear growth rate, and lag time. Linear growth rate was defined as the slope of the linear regression line during the growth portion of the curve, which was observed between the one-quarter and three-quarter times. Lag time was defined according to Silver et al., as the intersection of the linear growth phase regression line with the χ-axis [59]. Using a two-sample equal variance t-test, 0.014 was the highest p-value calculated, indicating that there are substantially different assembly kinetics between the purchased atelo-collagen and the extracted tropocollagen, as expected.
Fig. 3.
Turbidity assay of collagen polymerization. Solutions made from refrigerated constituents were adjusted to pH 7.3 and scanned at 313 nm in a plate reader at 37 °C.
3.2. Biomechanical analysis
3.2.1. Tropocollagen vs. atelo-collagen
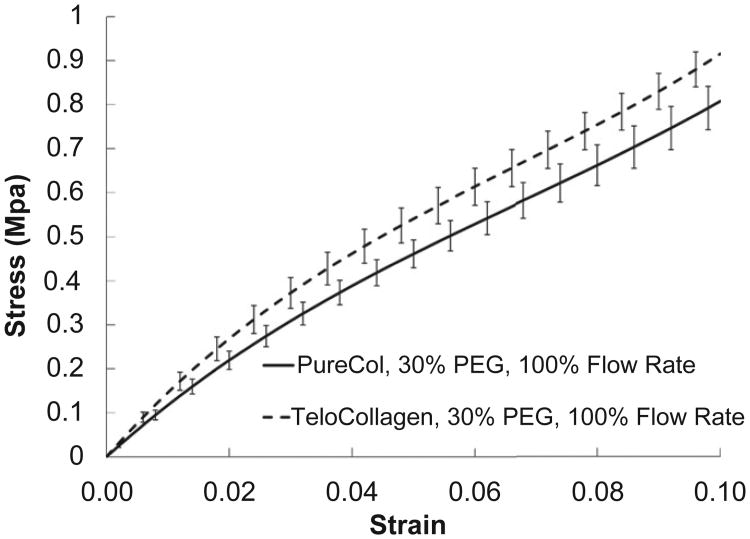
While atelo-collagen is capable of forming normal cross-striated fibrils [60,61], the telopeptides have additional benefits that may be essential for forming replacement tissues for biological applications. The telopeptides play a pivotal role in intermolecular covalent bonding [62,63], as well as enzymatic resistance [64,65]. However, this work focuses primarily on enhancing uniaxial alignment and molecular packing. Fig. 4 compares the mechanical behavior of tropocollagen fibers with atelo-collagen fibers printed at the same conditions. The stepped, static mechanical behavior of printed atelo-collagen and tropocollagen indicates the tropocolla-gen produces a slightly stiffer fiber (for the condition tested). The two curves are statistically different but share the same curve shape. This is indicative that the impact of parameter changes on the commercially available atelo-collagen may be cautiously extended to the tropocollagen.
Fig. 4.
Stepped, static stress–strain curves for printed collagen fibers as a function of collagen type (atelo-collagen vs. tropocollagen). The tropocollagen appears to yield a stiffer fiber.
3.2.2. Static, stepped mechanical testing
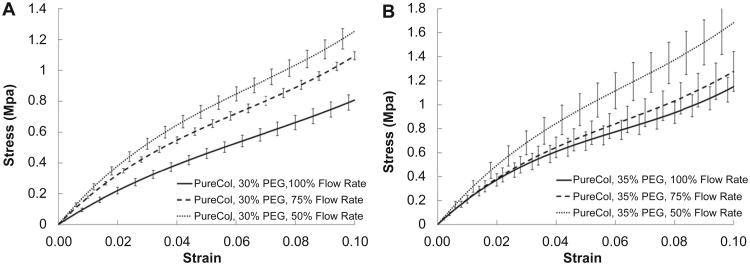
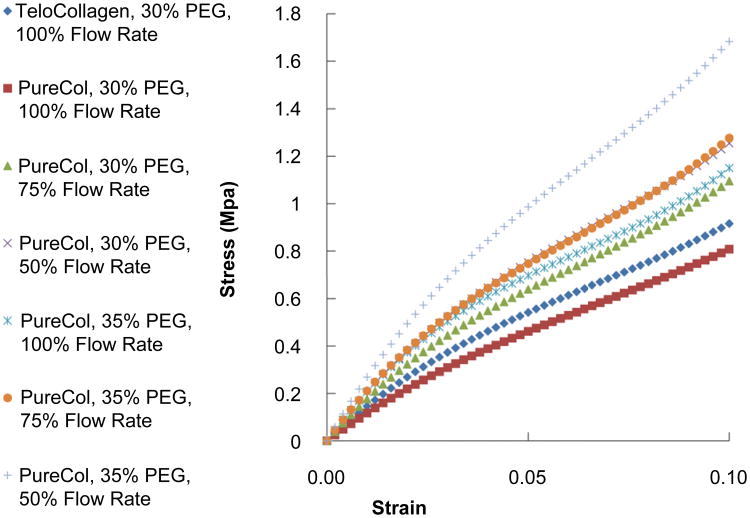
Fig. 5 shows the static, stepped stress–strain curves as a function of varying draw ratio (flow rate). In Fig. 5A, the condition of 30% PEG is shown while Fig. 5B shows the results for fibers printed in 35% PEG. The trend clearly shows an increasing modulus as the draw ratio increases (flow rate decreases). In Fig. 6 all of the stepped, static mechanical tests are plotted together. The trend of the curves reveals the influence of PEG concentration and draw ratio on the printed fiber mechanical properties. It can be readily observed that increased draw ratio and increased PEG concentration lead to stiffer fibers as expected. The strongest fiber was produced at 35% PEG and 50% flow rate (draw ratio of 2:1) while the weakest fiber was generated at 100% flow rate and 30% PEG (for atelo-collagen). Fig. 7 compares the tensile modulus at 2% strain for the all of the conditions tested and Table 1 summarizes the results of Fig. 7. Statistically significant differences in the moduli were reached between many of the conditions and are summarized in Table 2.
Fig. 5.
Stepped, static stress–strain curves for printed atelo-collagen fibers as a function of flow rate (draw ratio). A) Fibers printed in 30% PEG and B) fibers printed in 35% PEG. The data suggest that increasing the draw ratio leads to stronger fibers.
Fig. 6.
Stepped, static stress–strain curves for printed collagen fibers at all conditions. Generally, increasing the PEG concentration and lowering the flow rate (increasing the draw ratio) led to stiffer fibers.
Fig. 7.
Comparison of the fiber modulus at 2% for the various conditions.
Table 2.
Summarizes relevant statistically significant differences found between conditions.
| Telo 30% PEG 100% flow | Atelo 30% PEG 100% flow | Atelo 30% PEG 75% flow | Atelo 30% PEG 50% flow | Atelo 35% PEG 100% flow | Atelo 35% PEG 75% flow | Atelo 35% PEG 50% flow | |
|---|---|---|---|---|---|---|---|
| Telo, 30% PEG, 100% flow | – | Yes | Yes | Yes | Yes | Yes | Yes |
| Atelo, 30% PEG, 100% flow | – | Yes | Yes | Yes | Yes | Yes | |
| Atelo, 30% PEG, 75% flow | – | Yes | No | Yes | Yes | ||
| Atelo, 30% PEG, 50% flow | – | No | No | Yes | |||
| Atelo, 35% PEG, 100% flow | – | No | Yes | ||||
| Atelo, 35% PEG, 75% flow | – | Yes | |||||
| Atelo, 35% PEG, 50% flow | – |
3.2.3. Relaxation testing
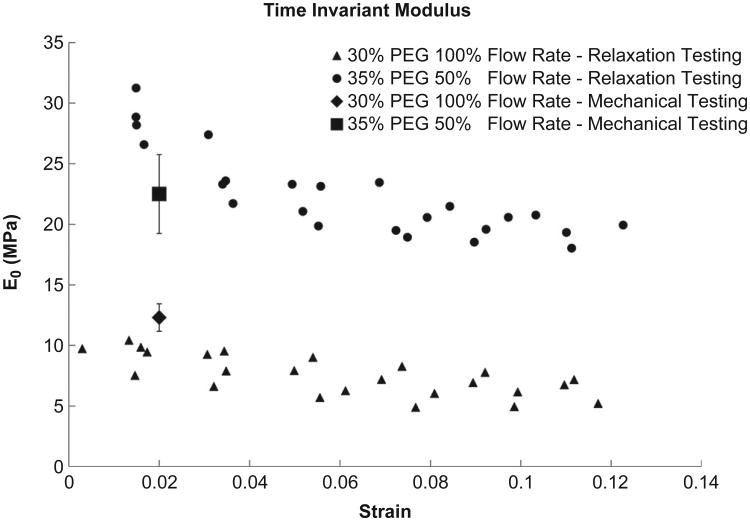
Mechanical relaxation testing was performed under conditions which generated the stiffest and the softest fibers (35% PEG/50% flow rate and 30% PEG/100% flow rate). Supplementary Fig. 3 shows a typical relaxation test performed under the conditions which produce the stiffest fibers. Data from the tests similar to that shown in Supplementary Fig. 3 were analyzed to extract the relaxation time constant, τ, the equilibrium modulus, E0 and the dynamic modulus, E1. In Fig. 8 we can see that the extracted equilibrium modulus decays with increasing strain for both conditions. It should be noted that the equilibrium modulus found at 2% strain matches our static data very well. For the stiffer fiber we found an average equilibrium modulus of 22.45 ± 3.60 MPa, τ of 100.69 ± 31.48 s and a dynamic modulus of 6.20 ± 2.04 MPa. While there was a significant difference in the aggregate E0 and E1 (p ≪ 0.01), we found no difference between the fibers for the time constant (p = 0.84). Supplementary Fig. 4 shows the results of a typical Levenberg–Marquadt extraction analysis where the parameters which result in a high correlation coefficient (>0.90) are clustered for a single experiment.
Fig. 8.
Comparison of the equilibrium tensile modulus, E0, at increasing strain for conditions which produced the stiffest and the softest fibers. The modulus found in the stepped, static mechanical testing has been inserted for comparison at 2% strain. Four fibers were examined at each condition.
3.3. Fiber morphology
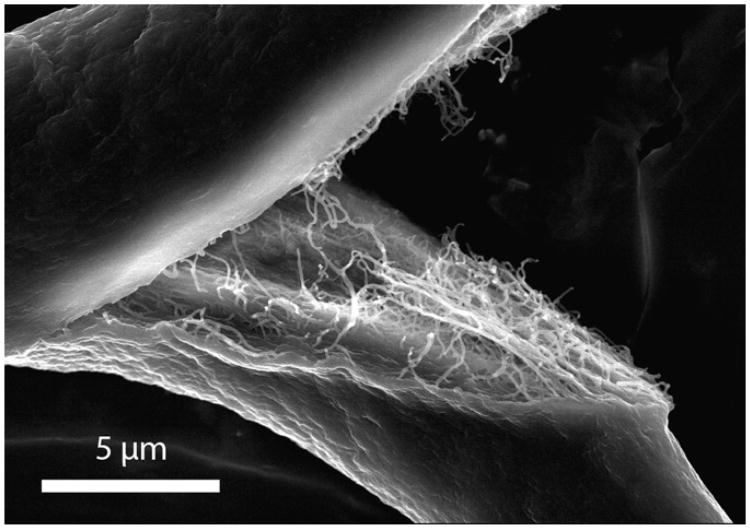
Many attempts have been made in the literature to resolve the surface fibrillar structure of extruded fibers. Unfortunately, most imaging attempts have shown a uniform, relatively featureless shell with macro-scale ridges and crevices [32,33,36–40,66]. Fig. 9 is a representative atelo-collagen fiber, printed into 30% PEG with 100% flow, which has been split and imaged by SEM. The outer surface structure was concealed by the external shell-like feature seen by others, but the fracture revealed the inner fiber structure to some degree. While the organization and orientation of the inner fibers were disrupted by the intentional fracturing of the sample, the relative uniformity in the diameter of the inner fibrils was apparent. In addition, there appears to be some degree of alignment of the collagen fibrils within the printed fiber.
Fig. 9.
SEM of fractured fiber printed in 30% PEG at 100% flow. Note the external featureless “shell” and the internal fibrillar structure.
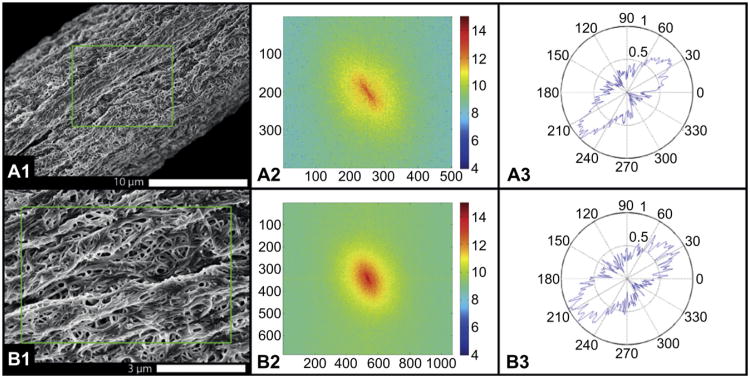
Fig. 10 shows another atelo-collagen fiber, printed into 30% PEG with 100% flow. In this case, the external shell was not evident and the structure of the smaller collagen fibrils packed into to the printed fiber is readily seen. The FFT algorithm was applied to the SEM images to describe the anisotropy of the fibrils within the collagen fiber. Fig. 10A shows the majority (greater than 70%) of macro-scale features are aligned within ±15° of the long axis of the fiber. Fig. 10B shows the individual fibrils have a higher level of local disorder, with alignment to the long axis ranging ±25°. The image suggests that fibril alignment is being positively influenced by the printing process, but there is opportunity for significant improvement.
Fig. 10.
Imaging and analysis of the orientation of the fibrils within the printed fiber at 30% PEG and 100% flow. In this case the external “shell” did not interfere with SEM imaging and the fibrillar structure within the fiber surface could be readily appreciated. A) Low magnification; B) higher magnification. A1 and B1) SEMs of fiber; A2 and B2) FFT transform of the image; A3 and B3) polar plot of the orientation of the structures within the image. Note that as magnification is increased, the orientation of the fibrils becomes more random. This type of alignment analysis could be used to tie fiber mechanics to the internal fibrillar structure.
Because it was difficult to optically measure the diameter of the fibers due to flattening or other shape changes in the cross-section, we only qualitatively report that increasing PEG concentration and decreasing flow rates visibly reduced the observable width of the final printed fiber. Supplementary Fig. 5 compares fibers for the conditions producing the stiffest and softest fibers, as seen via differential interference contrast light microscopy during live experiments.
4. Discussion
In this paper, we have demonstrated a new optically-based micromechanical measurement system which permits the in situ mechanical investigation of newly-assembled microfibers. The device allows both static and dynamic testing and utilizes calibrated glass micro-needles for optical force measurement in combination with optical strain measurements based on the location of embedded micro-beads. The device can reliably detect forces as low as 20 nN with local strain accuracy in the range of 99% for a fiber region with marker beads 200 μm apart. We have coupled the measurement chamber to a precision microfluidic delivery system which deposits collagen monomeric solutions within the chamber. The device was used to measure the micromechanical behavior of collagen fibers produced via molecular crowding in open solution with PEG. We used the system to examine the effect of atelo-collagen vs. telo-collagen, increasing draw ratio (decreasing flow rate) and increasing crowding force (increasing PEG concentration) on the resultant mechanics of printed collagen microfibers. The results indicate that stiffer, smaller fibers are produced as the draw ratio and the PEG concentration is increased. In addition the fibers did not show substantially different dynamic material properties indicating similar viscoelastic behavior. While the data were consistent with our expectations, there were other significant observations made during the process of fiber printing which deserve noting.
4.1. Collagen binding to micro-needle
The binding of the collagen to the calibrated micro-needle is an interesting effect and quite fortuitous as an anchor point for the fibers. We noticed that the structure which formed between the collagen and the micro-needle could bear load nearly immediately (See Fig. 2 for structure image). The structure is produced by first depositing a spherical bead of collagen around the micro-needle and then moving the collagen source away. This process can be seen in Supplementary Movie 1. While we are not sure how the structure comes about or why it forms so reliably, we believe it is due to a natural affinity of the collagen to glass and to the formation of a rapidly polymerized “shell” of collagen on the outside of the initial sphere. When the collagen depositor moves away, the polymerized collagen shell is pulled with it but catches on the micro-needle. The rapid polymerization of the monomer in the crowded solution then solidifies the micro-needle/collagen interface making it structurally robust.
Supplementary video related to this article can be found at http://dx.doi.org/10.1016/j.biomaterials.2012.12.028.
4.2. Kinetics of polymerization of the deposited collagen Fiber
While it was not our main goal to examine the kinetics of polymerization of collagen in the crowding solution, we were somewhat surprised at the speed with which structure is formed. The collagen, once in the PEG, was capable of rapidly morphing into a load-bearing solid structure, which began at the calibrated micro-needle and propagated through the PEG solution toward the moving printing needle. This could happen before the printing needle completed its deposition run if it was moved slowly enough. Once the polymerization front reached the printing needle, the new collagen being dispensed was no longer incorporated into the fiber and a large force was transferred to the micro-needle, displacing it off the computer screen and either breaking the collagen attachment or the fiber itself. Printing at a higher velocity and accordingly a higher flow rate was necessary to eliminate the problem. We chose, for this series of experiments to print at a high enough flow rate and at a high enough deposition needle speed to produce near-zero displacement of the anchoring glass micro-needle. Supplementary Fig. 6 demonstrates why this problem may arise. Even a small amount of PEG mixed with the collagen solution can reduce the polymerization lag time to nearly zero. This reduction in lag time is most likely due to a combination of the molecular crowding and co-nonsolvency effects produced by the PEG.
4.3. Low pH printing
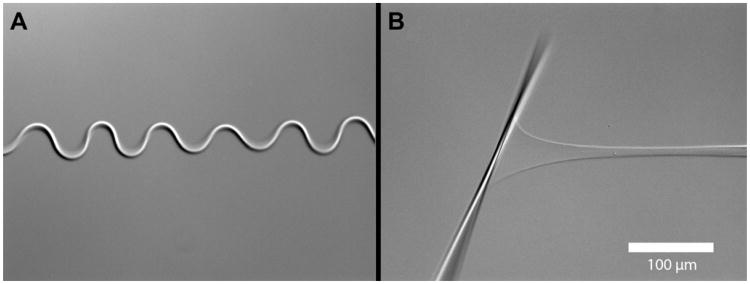
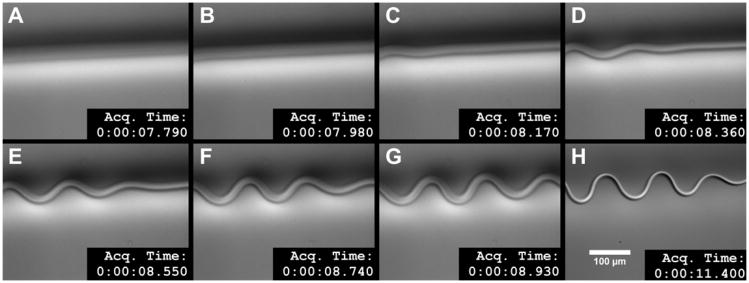
To isolate the effect of crowding from polymerization, we printed our collagen solution into PEG at a low pH (2.3). Our expectation was to generate a column of unpolymerized crowded collagen in the solution. The results (shown in Fig. 11) were quite surprising. The column of collagen was deposited in a straight line, but then quickly buckled into a sinusoidal pattern. Measurements of the fibril length suggest that following buckling, the fiber was 1.4 times as long as a fiber printed into pH 7.3. The buckled fiber was weakly stable, being able to hold a small amount mechanical tensile force without appreciable straightening. The fiber, once straightened, was able to hold a substantial amount of load in the pH 2.3 environment. In Fig. 12 (and Supplementary Movie 2), the kinetics of the effect can be readily seen. The buckling wave proceeds from the anchor point towards the deposition needle at a fairly rapid pace. The kinetics suggests that charge shielding by excess protons produces a shift in organization of the collagen molecules. Thus, manipulation of pH to isolate molecular crowding from polymerization was not a viable approach. Perhaps a better method is to print procollagen into the FFB at neutral pH and then trigger polymerization with propeptidases after the procollagen reaches organizational equilibrium. Because our micromechanical assay uses ∼100 nl of collagen solution to form a 12.5 mm fiber, the usual difficulty associated with obtaining adequate amounts of procollagen and propeptidases can be greatly alleviated.
Fig. 11.
Buckling of printed collagen microfiber. (A) The collagen fiber, deposited into the molecular crowding solution (30% PEG) at low pH (pH 2.3) buckled into a fairly regular sinusoidal pattern. Surprisingly, the fiber was able to hold a substantial force (B) in spite of the buckling pattern and the low pH of the solution.
Fig. 12.
Kinetics of the buckling wave seen in collagen fiber printed at low pH. The series of images shows the progression of the buckling immediately after the printing needle passes the observation point at 7.79 s. The buckling wave appears within 0.38 s and is essentially stable within 1.5 s. The last frame shows the stable buckled collagen fiber (in focus). Because of the difficulty of capturing this effect, the first seven frames are slight out of focus which is why the fiber looks more diffuse. See Supplementary Movie 2 to appreciate the dynamics of this event.
Supplementary video related to this article can be found at http://dx.doi.org/10.1016/j.biomaterials.2012.12.028.
5. Conclusion
We designed, built, and demonstrated the capabilities of a custom, optically-based micromechanical assay and fiber printing system which captures both the mechanical properties of deposited fibers and the kinetics of their assembly. The system readily detects the effect of increasing draw ratio and changes in FFB/PEG concentration on the mechanics of the printed collagen fibers. Using this device, we tested the limits of the adjustable parameters used in the printing of collagen in FFBs (e.g. maximum PEG solubility and maximum draw rate without breaking the fiber). While we found modest improvements in mechanical properties, the fibers produced remained inferior to native tissue with respect to packing, alignment, and strength. Our findings suggest that simultaneous molecular crowding and polymerization may be a limited fiber forming procedure because fibrillogenesis is occurring while the collagen concentration is changing from dilute to highly-concentrated. The rapid polymerization potentially locks disorganization into the fiber because it occurs before the collagen can properly align and during dynamic changes in water, electrolyte, and proton concentration. In addition, there is the potential for PEG molecules to be incorporated into the collapsing fiber, further distorting the fiber structure. A better approach will likely arise if one can separate the crowding from the polymerization events, thereby permitting organization before polymerization locks in the structure. Regardless of the approach, the device we have demonstrated should permit detailed optical and in situ mechanical investigation of collagen microfibers which are directly printed into any fibril forming buffer.
Supplementary Material
Acknowledgments
The first author, J. Paten, received support as a Charles Stark Draper Laboratory Fellow. The study was supported by R01 NEI EY015500. The authors thank Dr. Nima Saeidi for the exploratory experiments with collagen in PEG solution and invaluable advice.
Footnotes
Appendix A. Supplementary data: Supplementary data related to this article can be found at http://dx.doi.org/10.1016/j.biomaterials.2012.12.028.
References
- 1.Carr AJ, Norris SH. The blood supply of the calcaneal tendon. J Bone Jt Surg Br. 1989;71(1):100–1. doi: 10.1302/0301-620X.71B1.2914976. [DOI] [PubMed] [Google Scholar]
- 2.Schwarz RI. Modeling tendon morphogenesis in vivo based on cell density signaling in cell culture. J Math Biol. 1996;35(1):97–113. doi: 10.1007/s002850050045. [DOI] [PubMed] [Google Scholar]
- 3.Williams JG. Achilles tendon lesions in sport. Sports Med. 1986;3(2):114–35. doi: 10.2165/00007256-198603020-00003. [DOI] [PubMed] [Google Scholar]
- 4.Nageotte J, Guyon L. Reticulin. Am J Pathol. 1930;6(6):631–54. 5. [PMC free article] [PubMed] [Google Scholar]
- 5.Amiel D, Ishizue KK, Harwood FL, Kitabayashi L, Akeson WH. Injury of the anterior cruciate ligament: the role of collagenase in ligament degeneration. J Orthop Res. 1989;7(4):486–93. doi: 10.1002/jor.1100070405. [DOI] [PubMed] [Google Scholar]
- 6.Elliott DH. Structure and function of mammalian tendon. Biol Rev Camb Philos Soc. 1965;40:392–421. doi: 10.1111/j.1469-185x.1965.tb00808.x. [DOI] [PubMed] [Google Scholar]
- 7.Kjaer M. Role of extracellular matrix in adaptation of tendon and skeletal muscle to mechanical loading. Physiol Rev. 2004;84(2):649–98. doi: 10.1152/physrev.00031.2003. [DOI] [PubMed] [Google Scholar]
- 8.Gross J, Highberger JH, Schmitt FO. Collagen structures considered as states of aggregation of a kinetic unit. The tropocollagen particle. Proc Natl Acad Sci U S A. 1954;40(8):679–88. doi: 10.1073/pnas.40.8.679. [DOI] [PMC free article] [PubMed] [Google Scholar]
- 9.Boedtker H, Doty P. The native and denatured states of soluble collagen. J Am Chem Soc. 1956;78(17):14. [Google Scholar]
- 10.Ramachandran GN, Kartha G. Structure of collagen. Nature. 1954;174(4423):269–70. doi: 10.1038/174269c0. [DOI] [PubMed] [Google Scholar]
- 11.Ramachandran GN, Kartha G. Structure of collagen. Nature. 1955;176(4482):593–5. doi: 10.1038/176593a0. [DOI] [PubMed] [Google Scholar]
- 12.Rich A, Crick FH. The structure of collagen. Nature. 1955;176(4489):915–6. doi: 10.1038/176915a0. [DOI] [PubMed] [Google Scholar]
- 13.Ramshaw JA, Shah NK, Brodsky B. Gly-X-Y tripeptide frequencies in collagen: a context for host-guest triple-helical peptides. J Struct Biol. 1998;122(1-2):86–91. doi: 10.1006/jsbi.1998.3977. [DOI] [PubMed] [Google Scholar]
- 14.Malone JP, George A, Veis A. Type I collagen N-telopeptides adopt an ordered structure when docked to their helix receptor during fibrillogenesis. Proteins. 2004;54(2):206–15. doi: 10.1002/prot.10526. [DOI] [PubMed] [Google Scholar]
- 15.Veit G, Kobbe B, Keene DR, Paulsson M, Koch M, Wagener R. Collagen XXVIII, a novel von Willebrand factor A domain-containing protein with many imperfections in the collagenous domain. J Biol Chem. 2006;281(6):3494–504. doi: 10.1074/jbc.M509333200. [DOI] [PubMed] [Google Scholar]
- 16.Soderhall C, Marenholz I, Kerscher T, Ruschendorf F, Esparza-Gordillo J, Worm M, et al. Variants in a novel epidermal collagen gene (COL29A1) are associated with atopic dermatitis. PLoS Biol. 2007;5(9):e242. doi: 10.1371/journal.pbio.0050242. [DOI] [PMC free article] [PubMed] [Google Scholar]
- 17.Bear RS. Long X-ray diffraction spacings of collagen. J Am Chem Soc. 1942;64(3):1. [Google Scholar]
- 18.Hall CE, Jakus MA, Schmitt FO. Electron microscope observations of collagen. J Am Chem Soc. 1942;64(5):1. [Google Scholar]
- 19.Hulmes DJ, Miller A. Quasi-hexagonal molecular packing in collagen fibrils. Nature. 1979;282(5741):878–80. doi: 10.1038/282878a0. [DOI] [PubMed] [Google Scholar]
- 20.Orgel JP, Miller A, Irving TC, Fischetti RF, Hammersley AP, Wess TJ. The in situ supermolecular structure of type I collagen. Structure. 2001;9(11):1061–9. doi: 10.1016/s0969-2126(01)00669-4. [DOI] [PubMed] [Google Scholar]
- 21.Orgel JP, Irving TC, Miller A, Wess TJ. Microfibrillar structure of type I collagen in situ. Proc Natl Acad Sci U S A. 2006;103(24):9001–5. doi: 10.1073/pnas.0502718103. [DOI] [PMC free article] [PubMed] [Google Scholar]
- 22.Canty EG, Lu Y, Meadows RS, Shaw MK, Holmes DF, Kadler KE. Coalignment of plasma membrane channels and protrusions (fibripositors) specifies the parallelism of tendon. J Cell Biol. 2004;165(4):553–63. doi: 10.1083/jcb.200312071. [DOI] [PMC free article] [PubMed] [Google Scholar]
- 23.Canty EG, Starborg T, Lu Y, Humphries SM, Holmes DF, Meadows RS, et al. Actin filaments are required for fibripositor-mediated collagen fibril alignment in tendon. J Biol Chem. 2006;281(50):38592–8. doi: 10.1074/jbc.M607581200. [DOI] [PubMed] [Google Scholar]
- 24.Hukins DW, Woodhead-Galloway J. Liquid-crystal model for the organization of molecules in collagen fibrils [proceedings] Biochem Soc Trans. 1978;6(1):238–9. doi: 10.1042/bst0060238. [DOI] [PubMed] [Google Scholar]
- 25.Hukins DWL, Woodhead-Galloway J. Collagen fibrils as examples of smectic A biological fibres. Mol Cryst Liq Cryst. 1977;41:7. [Google Scholar]
- 26.Giraud-Guille MM. Liquid crystalline phases of sonicated type I collagen. Biol Cell. 1989;67(1):97–101. doi: 10.1111/j.1768-322x.1989.tb03014.x. [DOI] [PubMed] [Google Scholar]
- 27.Giraud-Guille MM. Liquid crystallinity in condensed type I collagen solutions. A clue to the packing of collagen in extracellular matrices. J Mol Biol. 1992;224(3):861–73. doi: 10.1016/0022-2836(92)90567-4. [DOI] [PubMed] [Google Scholar]
- 28.Martin R, Farjanel J, Eichenberger D, Colige A, Kessler E, Hulmes DJ, et al. Liquid crystalline ordering of procollagen as a determinant of three-dimensional extracellular matrix architecture. J Mol Biol. 2000;301(1):11–7. doi: 10.1006/jmbi.2000.3855. [DOI] [PubMed] [Google Scholar]
- 29.Kato YP, Christiansen DL, Hahn RA, Shieh SJ, Goldstein JD, Silver FH. Mechanical properties of collagen fibres: a comparison of reconstituted and rat tail tendon fibres. Biomaterials. 1989;10(1):38–42. doi: 10.1016/0142-9612(89)90007-0. [DOI] [PubMed] [Google Scholar]
- 30.Kato YP, Silver FH. Formation of continuous collagen fibres: evaluation of bio-compatibility and mechanical properties. Biomaterials. 1990;11(3):169–75. doi: 10.1016/0142-9612(90)90150-o. [DOI] [PubMed] [Google Scholar]
- 31.Dunn MG, Avasarala PN, Zawadsky JP. Optimization of extruded collagen fibers for ACL reconstruction. J Biomed Mater Res. 1993;27(12):1545–52. doi: 10.1002/jbm.820271211. [DOI] [PubMed] [Google Scholar]
- 32.Cavallaro JF, Kemp PD, Kraus KH. Collagen fabrics as biomaterials. Biotechnol Bioeng. 1994;44(1):146. doi: 10.1002/bit.260440121. [DOI] [PubMed] [Google Scholar]
- 33.Caves JM, Kumar VA, Martinez AW, Kim J, Ripberger CM, Haller CA, et al. The use of microfiber composites of elastin-like protein matrix reinforced with synthetic collagen in the design of vascular grafts. Biomaterials. 2010;31(27):7175–82. doi: 10.1016/j.biomaterials.2010.05.014. [DOI] [PMC free article] [PubMed] [Google Scholar]
- 34.Caves JM, Kumar VA, Wen J, Cui W, Martinez A, Apkarian R, et al. Fibrillogenesis in continuously spun synthetic collagen fiber. J Biomed Mater Res B Appl Biomater. 2010;93(1):24–38. doi: 10.1002/jbm.b.31555. [DOI] [PMC free article] [PubMed] [Google Scholar]
- 35.Kemp PD, Cavallaro JF, Hastings DN. Effects of carbodiimide crosslinking and load environment on the remodeling of collagen scaffolds. Tissue Eng. 1995;1(1):71–9. doi: 10.1089/ten.1995.1.71. [DOI] [PubMed] [Google Scholar]
- 36.Pins GD, Silver FH. A self-assembled collagen scaffold suitable for use in soft and hard tissue replacement. Mat Sci Eng C Biomim. 1995;3(2):101–7. [Google Scholar]
- 37.Zeugolis DI, Paul GR, Attenburrow G. Cross-linking of extruded collagen fibers – a biomimetic three-dimensional scaffold for tissue engineering applications. J Biomed Mater Res A. 2009;89(4):895–908. doi: 10.1002/jbm.a.32031. [DOI] [PubMed] [Google Scholar]
- 38.Zeugolis DI, Paul RG, Attenburrow G. Post-self-assembly experimentation on extruded collagen fibres for tissue engineering applications. Acta Biomater. 2008;4(6):1646–56. doi: 10.1016/j.actbio.2008.05.015. [DOI] [PubMed] [Google Scholar]
- 39.Zeugolis DI, Paul RG, Attenburrow G. Extruded collagen-polyethylene glycol fibers for tissue engineering applications. J Biomed Mater Res B Appl Biomater. 2008;85(2):343–52. doi: 10.1002/jbm.b.30952. [DOI] [PubMed] [Google Scholar]
- 40.Zeugolis DI, Paul RG, Attenburrow G. Extruded collagen fibres for tissue-engineering applications: influence of collagen concentration and NaCl amount. J Biomater Sci Polym Ed. 2009;20(2):219–34. doi: 10.1163/156856209X404505. [DOI] [PubMed] [Google Scholar]
- 41.Kew SJ, Gwynne JH, Enea D, Abu-Rub M, Pandit A, Zeugolis D, et al. Regeneration and repair of tendon and ligament tissue using collagen fibre bio-materials. Acta Biomater. 2011;7(9):3237–47. doi: 10.1016/j.actbio.2011.06.002. [DOI] [PubMed] [Google Scholar]
- 42.Allen PR, Amis AA, Jones MM, Heatley FW. Evaluation of preserved bovine tendon xenografts: a histological, biomechanical and clinical study. Bio-materials. 1987;8(2):146–52. doi: 10.1016/0142-9612(87)90105-0. [DOI] [PubMed] [Google Scholar]
- 43.Tezvergil-Mutluay A, Mutluay MM, Agee KA, Seseogullari-Dirihan R, Hoshika T, Cadenaro M, et al. Carbodiimide cross-linking inactivates soluble and matrix-bound MMPs, in vitro. J Dent Res. 2012;91(2):192–6. doi: 10.1177/0022034511427705. [DOI] [PMC free article] [PubMed] [Google Scholar]
- 44.Umashankar PR, Arun T, Kumari TV. Short duration gluteraldehyde cross linking of decellularized bovine pericardium improves biological response. J Biomed Mater Res A. 2011;97(3):311–20. doi: 10.1002/jbm.a.33061. [DOI] [PubMed] [Google Scholar]
- 45.Xie J, Li X, Lipner J, Manning CN, Schwartz AG, Thomopoulos S, et al. “Aligned-to-random” nanofiber scaffolds for mimicking the structure of the tendon-to-bone insertion site. Nanoscale. 2010;2(6):923–6. doi: 10.1039/c0nr00192a. [DOI] [PMC free article] [PubMed] [Google Scholar]
- 46.Caliari SR, Harley BA. The effect of anisotropic collagen-GAG scaffolds and growth factor supplementation on tendon cell recruitment, alignment, and metabolic activity. Biomaterials. 2011;32(23):5330–40. doi: 10.1016/j.biomaterials.2011.04.021. [DOI] [PMC free article] [PubMed] [Google Scholar]
- 47.Capaldi MJ, Chapman JA. The C-terminal extrahelical peptide of type I collagen and its role in fibrillogenesis in vitro. Biopolymers. 1982;21(11):2291–313. doi: 10.1002/bip.360211115. [DOI] [PubMed] [Google Scholar]
- 48.Brennan M, Davison PF. Influence of the telopeptides on type I collagen fibrillogenesis. Biopolymers. 1981;20(10):2195–202. doi: 10.1002/bip.1981.360201012. [DOI] [PubMed] [Google Scholar]
- 49.Chien JC, Chang EP. Influence of telopeptide on the morphology and physicomechanical properties of reconstituted collagens. Biopolymers. 1973;12(9):2044–55. doi: 10.1002/bip.1973.360120911. [DOI] [PubMed] [Google Scholar]
- 50.Gelman RA, Poppke DC, Piez KA. Collagen fibril formation in vitro. The role of the nonhelical terminal regions. J Biol Chem. 1979;254(22):11741–5. [PubMed] [Google Scholar]
- 51.Helseth DL, Jr, Veis A. Collagen self-assembly in vitro. Differentiating specific telopeptide-dependent interactions using selective enzyme modification and the addition of free amino telopeptide. J Biol Chem. 1981;256(14):7118–28. [PubMed] [Google Scholar]
- 52.Mosser G, Anglo A, Helary C, Bouligand Y, Giraud-Guille MM. Dense tissuelike collagen matrices formed in cell-free conditions. Matrix Biol. 2006;25(1):3–13. doi: 10.1016/j.matbio.2005.09.002. [DOI] [PubMed] [Google Scholar]
- 53.Wang Y, Silvent J, Robin M, Babonneau F, Meddahi-Pelle A, Nassif N, et al. Controlled collagen assembly to build dense tissue-like materials for tissue engineering. Soft Matter. 2011;7(20):9659–64. [Google Scholar]
- 54.Flynn BP, Tilburey GE, Ruberti JW. Highly sensitive single-fibril erosion assay demonstrates mechanochemical switch in native collagen fibrils. Biomech Model Mechanobiol. 2012 doi: 10.1007/s10237-012-0399-2. [DOI] [PMC free article] [PubMed] [Google Scholar]
- 55.Nekouzadeh A, Pryse KM, Elson EL, Genin GM. A simplified approach to quasi-linear viscoelastic modeling. J Biomech. 2007;40(14):3070–8. doi: 10.1016/j.jbiomech.2007.03.019. [DOI] [PMC free article] [PubMed] [Google Scholar]
- 56.Shen ZL, Kahn H, Ballarini R, Eppell SJ. Viscoelastic properties of isolated collagen fibrils. Biophysical J. 2011;100(12):3008–15. doi: 10.1016/j.bpj.2011.04.052. [DOI] [PMC free article] [PubMed] [Google Scholar]
- 57.Fung YC. Elasticity of soft tissues in simple elongation. Am J Physiol. 1967;213(6):1532–44. doi: 10.1152/ajplegacy.1967.213.6.1532. [DOI] [PubMed] [Google Scholar]
- 58.Vader D, Kabla A, Weitz D, Mahadevan L. Strain-induced alignment in collagen gels. PLoS One. 2009;4(6):e5902. doi: 10.1371/journal.pone.0005902. [DOI] [PMC free article] [PubMed] [Google Scholar]
- 59.Silver FH, Birk DE. Kinetic analysis of collagen fibrillogenesis: I. Use of turbidity–time data. Coll Relat Res. 1983;3(5):393–405. doi: 10.1016/s0174-173x(83)80020-x. [DOI] [PubMed] [Google Scholar]
- 60.Comper WD, Veis A. Characterization of nuclei in in vitro collagen fibril formation. Biopolymers. 1977;16(10):2133–42. doi: 10.1002/bip.1977.360161005. [DOI] [PubMed] [Google Scholar]
- 61.Kuznetsova N, Leikin S. Does the triple helical domain of type I collagen encode molecular recognition and fiber assembly while telopeptides serve as catalytic domains? Effect of proteolytic cleavage on fibrillogenesis and on collagen-collagen interaction in fibers. J Biol Chem. 1999;274(51):36083–8. doi: 10.1074/jbc.274.51.36083. [DOI] [PubMed] [Google Scholar]
- 62.Eyre DR, Paz MA, Gallop PM. Cross-linking in collagen and elastin. Annu Rev Biochem. 1984;53:717–48. doi: 10.1146/annurev.bi.53.070184.003441. [DOI] [PubMed] [Google Scholar]
- 63.Tanzer ML. Cross-linking of collagen. Science. 1973;180(86):561–6. doi: 10.1126/science.180.4086.561. [DOI] [PubMed] [Google Scholar]
- 64.Vater CA, Harris ED, Jr, Siegel RC. Native cross-links in collagen fibrils induce resistance to human synovial collagenase. Biochem J. 1979;181(3):639–45. doi: 10.1042/bj1810639. [DOI] [PMC free article] [PubMed] [Google Scholar]
- 65.Walton RS, Brand DD, Czernuszka JT. Influence of telopeptides, fibrils and crosslinking on physicochemical properties of type I collagen films. J Mater Sci Mater Med. 2010;21(2):451–61. doi: 10.1007/s10856-009-3910-2. [DOI] [PubMed] [Google Scholar]
- 66.Lai ES, Anderson CM, Fuller GG. Designing a tubular matrix of oriented collagen fibrils for tissue engineering. Acta Biomater. 2011;7(6):2448–56. doi: 10.1016/j.actbio.2011.03.012. [DOI] [PubMed] [Google Scholar]
Associated Data
This section collects any data citations, data availability statements, or supplementary materials included in this article.


