

Summary
In this review we summarize our recent efforts using mathematical modeling and computation to simulate cancer invasion, with a special emphasis on the tumor microenvironment. We consider cancer progression as a complex multiscale process and approach it with three single-cell based mathematical models that examine the interactions between tumor microenvironment and cancer cells at several scales. The models exploit distinct mathematical and computational techniques, yet they share core elements and can be compared and/or related to each other. The overall aim of using mathematical models is to uncover the fundamental mechanisms that lend cancer progression its direction towards invasion and metastasis. The models effectively simulate various modes of cancer cell adaptation to the microenvironment in a growing tumor. All three point to a general mechanism underlying cancer invasion: competition for adaptation between distinct cancer cell phenotypes, driven by a tumor microenvironment with scarce resources. These theoretical predictions pose an intriguing experimental challenge: test the hypothesis that invasion is an emergent property of cancer cell populations adapting to selective microenvironment pressure, rather than culmination of cancer progression producing cells with the “invasive phenotype”. In broader terms, we propose that fundamental insights into cancer can be achieved by experimentation interacting with theoretical frameworks provided by computational and mathematical modeling.
Introduction
We are studying the process of cancer progression, particularly invasion, by a multidisciplinary approach that integrates mathematics and experimentation. In this review we describe why cancer progression and invasion are amenable to this approach, the logic behind the modeling techniques we are using in our group, and key outcomes our mathematical models have in common. The emphasis of the review is on the tumor microenvironment (mE), for two reasons. First, this is the theme of this journal issue. Second, three independent computational models we developed, based on distinct mathematical techniques, all point to an essential, but unsuspected role for the mE in eliciting invasive patterns of tumor growth and enabling dominance of aggressive cell phenotypes.
Theoretical frameworks of cancer based on multiscale mathematical models
Cancer progression can be viewed as a process with both multiscale and complex features. Multiscale because its mechanisms and outcomes involve multiple biological scales, e.g., from genes to cells to tissues to organs to organisms to populations. Complex because it is influenced by multiple variables interacting at once and segregated by scales; e.g., at the population scale, variables may include age specific rate of cancer incidence, exposure to chemicals, lifestyle; at the tissue scale, variables may include rates of cell proliferation, death, motility, adhesion, angiogenesis; at the molecular scale, mutation rates.
In a complex multiscale process, variables at a given scale affect properties of the process at other scales. They tend to do so not in a linear fashion but, rather, from underlying new properties that emerge at the next higher scale. Applying this perspective to cancer progression, invasion can be viewed as a property of the tissue scale that emerges from the population behavior of individual cells at the lower scale. Of course, individual cell behavior is influenced by the mE, a composite of molecular, cellular and tissue scales that illustrates how biological scales intermingle. Ideally, in a comprehensive mechanistic view of cancer progression, all scales should ultimately interact with one another, in both directions, with the cell as the centerpiece for these interactions (see below). Whilst this interactivity is easily inferred from current knowledge on cancer progression, at the moment studies and insights at different scales remain quantitatively disconnected. For example, major insights from epidemiological data and the study of age-specific cancer incidence (i.e., the population scale) led to the formulation of a multistage theory1,2 predicting that there are 5–7 rate limiting steps in cancer progression. Validating this theory and understanding the nature of these steps at lower scales is a major goal of current research that has led to spectacular advances, but that remains largely unrealized. Another success story is the case of familiar retinoblastoma two-hit theory3 (a special case of multistage progression), which predicted the existence of an Rb gene, subsequently discovered by molecular genetics4. It remains however to be determined how altered functions of mutated Rb genes propagate through higher scales (cell, tissue, etc.) to eventually cause the observed retinoblastoma incidence at the population level. Discovery of other tumor suppressor genes was promoted by multiscale links from population to molecular genetics studies5, but again the intermediate cell scales remain largely unexplored. Conversely, in non-familiar sporadic cancers, fundamental insights have been obtained starting from the gene scale5. Molecular cancer genetics has identified oncogenes that, together with tumor suppressor genes, can reproduce many aspects of cancer progression in cultured cells or animals. In these experimental models, however, cancer progression is initiated by genetic mutation, but again steps at intermediate scales (e.g., at the cellular and tissue scale), other than unrestrained growth, are not well reproduced or understood quantitatively. For instance, invasion and metastasis rarely occur in animal models of human cancers, suggesting that other variables or mechanisms may be involved. At the cell scale, the realization that changes in signaling networks may confer cancerous traits to a cell has produced major insights. However, defining the link between these traits and underlying genetic changes is a major challenge6 to be met. At the tissue scale the chemical, physical and cellular composition of the mE is known to profoundly affect cancer progression7. In some cases, mE features appear to dominate over genotype in determining the outcome of cancer cell organization into tissue8.
A delaying factor is that, as studies move from one scale to the other, they tend to become segregated by traditional discipline boundaries: cancer cell biologists do not necessarily communicate with population geneticists, who communicate little with molecular geneticists, etc.9. For instance, it has been argued that, as powerful as they are, molecular genetics studies often fall short of fully understanding cancer genetics because they tend to disregard how allele frequencies become fixed in a growing population of heterogeneous cancer cells. That is, cancer molecular genetics has traditionally neglected somatic cell population genetics10. For this reason, the question as to whether mutated genes in cancer cells are cause or effect of cancer progression remains a legitimate one and to an extent unanswered. See, for instance, the ongoing debate on mutation rates, i.e., whether or not a rate increase is necessary for progression11. From these distilled highlights that do not of course do justice to the breadth of current cancer research, it should be evident that considering the multiscale nature of cancer progression is desirable. It is also worth mentioning why we think it important to consider cancer progression as a complex process: at every scale there are multiple variables that interact simultaneously. Therefore in order to make any useful predictions concerning the mechanistic nature of cancer progression we propose to utilize theoretical frameworks capable of integrating multiple variables at once12,13.
In summary, if cancer progression is a complex multiscale process, one effective means of comprehending it is to adopt multiscale mathematical models that naturally incorporate multiple variables across multiple scales. Accordingly, this approach has been adopted by other disciplines (including physics, engineering, ecology and economics) for forming testable theories of complex multiscale processes. To be clear, there is no single mathematical model that can encompass all aspects of cancer progression, due to the very nature of its complexity. We therefore have been focusing on one aspect of progression: the transitioning of tumor growth from contained to locally invasive. Specifically, we consider three different multiscale mathematical models of invasion that bridge three different spatial scales (but also overlap) from genes to cellular phenotype to tissue.
Approaches and techniques to modeling cancer invasion
The occurrence of cancer invasion dramatically restricts treatment options and is almost invariably fatal. Therefore, understanding and controlling invasion could have a major impact on this dreadful disease. Invasion occurs at the tissue scale, but it is perhaps best viewed as a property emerging from the collective behavior of cells, at the scale below, in the context of a tumor mE. In fact, all of cancer progression is best framed, for theoretical and experimental purposes, in such multiscale fashion. The behavior of a single cell is an emergent property of the relative balance of lower scale cellular core processes, including, e.g., division, growth, motility, death. Each core process has properties emerging from the collective behavior of molecular signaling networks at the scale below. The output of each signaling network derives from the behavior of underlying genes. In this multiscale integrated framework, it is easy to see how a mutation in a gene may propagate its effects up the scales, ultimately determining the ouctome of cancer progression, e.g., whether or not invasion occurs. The effects of a genetic mutation on disease outcome (e.g., invasion) can also be modified by other variables at each scale. From this perspective, it is inescapable that, to predict and curb invasion, we must have some understanding of how multiple variables affect one another and bridge the different scales. Complex multiscale processes such as cancer progression (as discussed above) are effectively studied by using mathematical modeling.
In more pragmatic terms, we have taken the view that, in order to understand quantitatively and mechanistically invasion in the context of cancer progression, top-down theoretical approaches are needed to complement and organize the massive amount of data and information produced by the wildly successful bottom-up, molecular reductionist approaches6. We have proposed that mathematical models should reflect the multiscale nature of cancer progression, and that particular care should be taken when interfacing experiments with models, so that data and modeling scales are properly matched6. Several models at distinct scales are therefore necessary. However, in the specific case of invasion, models operating at the cellular and tissue scale are particularly relevant, because that is the level at which invasion is observed. Here, we show our experience in building three different models, EHCA, IBCell and HDC, which span scales from the genotype to the tissue and in which the cell takes center stage. These models overlap, a highly desired property to easily interface the knowledge they produce.
The mE in three mathematical models: EHCA, IBCell and HDC
In this review, we focus on elements of these three mathematical models that concern the tumor microenvironment (mE). It is perhaps useful to entertain both biological and mathematical considerations we have adopted in building these models. Regarding our biological perspective, we are aware that it is customary to consider the mE at the most intuitive level (stroma, ECM, vessels, soluble factors, etc.), with little concern about scale separation. A pervasive view is also that the many components of the mE should be represented altogether, in order to capture their effects fully. These views have been immensely helpful to unearth enormous amounts of information. However, in our modeling efforts we found it useful to sacrifice detail in order to distill essential elements of the mE. For now, we are focusing on the following: space, mechanical forces, nutrients, proteases, ECM. Each of these elements is represented in a simple form that still provides sufficient realism for simulations, but not simpler. For instance a generic form of ECM or nutrients was adopted (see below for further details).
Our modeling approach is strictly reductionist (in the original sense), and we strive to avoid a panglossian view of the mE14 in which every mE feature would have an evolutionarily optimized purpose. To be clear, the models are built in such a way that the represented elements of the mE interact with mathematical representations of cells or genes. In the case of cells, their perception of the mE is an essential part of their phenotype. Simulation outcomes are entirely determined by the interactions of cell phenotypes with mE elements. In a sense, the outcome of interactions between cells and mE in the models is entirely determined by rules that reflect physicochemical laws. The simulations can be endowed with external assumptions based on biological knowledge. To the best of our abilities, these assumptions do not predetermine outcome and are suitable for experimental parameterization and refinement if necessary. Regarding our mathematical perspective, we appreciate that it may certainly be possible to represent all of the many components of the mE at once in a model, in spite of the complexity of the task. However, from a modeling perspective there is no particular advantage in doing so - in fact it is best to adopt a minimal modeling approach because too many interacting variables and processes reduce the likelihood of understanding the dynamics of the mechanisms that drive outcomes. Therefore, each of the three models we describe includes a limited representation of mE components, which in a sense matches the kind of process we are trying to capture with that particular model, and its scale.
In the evolutionary hybrid cellular automata (EHCA) model, the only mE variable is concentration of oxygen (as a generic representative of nutrients); in the immersed boundary cell (IBCell) model, it is mechanical forces (both between cells and betweens cells and the ECM); in the hybrid discrete-continuum (HDC) model, the mE is reduced to nutrients (once again, oxygen as a representative of), proteases and ECM. It is also worth mentioning that in each model cancer cells themselves are technically part of the mE since they affect the behavior of other cells.
Brief description of the EHCA
The EHCA model uses a cellular automata based approach that considers cells as simple grid points (fig. 1(a)). Each cell contains a complex neural network that links genotype to phenotype. The grid itself represents the mE (see Fig. 1(a)) and the only variable on this grid, apart from the cells, is the concentration of oxygen. The dynamics of oxygen in space and time are controlled by a (continuous) partial differential equation. Cells on the grid consume oxygen at a constant rate, whose value was derived from published experimental data15. The oxygen equation contains a term that links cellular consumption with mE concentration. In the EHCA model, cells perform three basic functions: proliferation, quiescence, apoptosis. The neural network within the cells controls these functions, via a feed-forward decision mechanism. The mE variables (oxygen concentration, and cell crowding, i.e., available space on the grid) are considered as input to the genotype layer. Please note that genotypes can vary and evolve from cell to cell, because of random error at the time of copying (see below). The input is therefore processed by the cells’ individual genotypes in slightly different ways. For instance, a value of oxygen concentration may trigger apoptosis in one cell, but not another, because their respective genotypes have evolved apart. Similar effects occur for quiescence and proliferation. In aggregate, the genotype layer processes input, at the single cell level, and then generates an output, also at the single cell level. This output effectively represents phenotype, since it characterizes cell behavior (proliferation, death, etc.) (see 16 for full details). In the EHCA model, the mE is limited to the number of neighbors of a cell and the local oxygen concentration. The level of cell crowding triggers competing behavior for space and will determine whether a cell proliferates or becomes quiescent. More “aggressive” cells will have evolved to become less prone to quiescence upon crowding. The oxygen concentration decides the death response: again, more aggressive cells have evolved to be less sensitive to death triggers. At every cell doubling, the inner neural network is copied to the daughter cells, but with a probability of error. This noise reflects, in a sense, the occurrence of mutations. Of course, these mutations modify how the genotype layer processes mE input, and distinct outputs are generated, directly linked to the mutated genotype. Therefore, the model captures one component of cancer progression, the generation of phenotypic variation within a population of growing cancer cells. It is of crucial importance to realize that the effects of a mutation will directly alter the ability of a cell, and its progeny, to compete for spatial an nutritional resources16,17. The selective forces of the model can apply pressure on the phenotypes, if they become limiting. For instance, decreasing levels of oxygen concentration or increased cell crowding will produce a competition from which the fittest phenotypes will emerge. The genotype of the fittest cells then increases its frequency in the total tumor cell population. Therefore, in the EHCA model tumor growth is strongly favored by adaptation to the mE, and the genotype/phenotype of the resulting tumor is influenced by the selective strength of the mE, which may or may not ignite competition among phenotypes. For a detailed description of the EHCA model, refer to our recent publication16.
Figure 1.
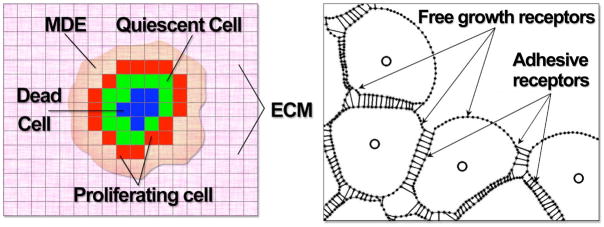
Schematic of different model layouts: (left panel) A cluster of tumour cells in the EHCA and HDC models (colouration denoting cell state). The cells reside on a square lattice and each lattice site can either be occupied by a cancer cell or be empty. Note, the EHCA model does not consider MDE (Matrix Degrading Enzymes) or ECM (Extracellular Matrix). (right panel) A portion of a small cluster of adherent cells in the IBCell model. Cell boundary points (dots) are connected by short linear springs to form plasma membranes (grey lines); nuclei (circles inside cells) are surrounded by cytoplasm modeled as a viscous incompressible Newtonian fluid; cells are connected by adherent links (thin black lines); adhesive and growth membrane receptors are distributed along the cell boundary.
Brief description of IBCell
The tumor microenvironment exerts physical forces on cancer cells7,18,19 that affect their behavior. These forces are often overlooked in mathematical models of cancer progression. For our goal of modeling cancer invasion at cell and tissue scale, however, it is essential to represent this mechanical aspect of the tumor mE, since it could capture critical steps in the initial stages of invasion, such as breach of basement membranes, or distortion of epithelial structures (acini, ducts) that leads to local invasion and fingering. To model mE mechanical forces, we used the Immersed Boundary method20 to represent 2-dimensional fully deformable cancer cells. In our model (IBCell), the structure of each individual cell includes an elastic plasma membrane modelled as a network of linear springs that defines cell shape and encloses the viscous incompressible fluid representing the cytoplasm and providing cell mass. These individual cells can interact with other cells and with the environment via a set of discrete membrane receptors located on the cell boundary. In particular, each point can be engaged in adhesion either with one of the neighboring cells or with the extracellular matrix (ECM). The ECM in this model is represented as a viscous incompressible fluid. Figure 1(b) shows a small cluster of adherent cells with adhesive and free receptors distributed along cell boundaries. Separate cells are connected by adhesive links, that are modelled as springs acting between boundary points of two distinct cells if they are sufficiently close to one another. Several cellular processes, such as cell growth, division, apoptotic death or epithelial polarisation, are modeled in IBCell. All individual cells follow identically defined cell life processes. However, since cells interact with one another, the initiation and progression of some cellular processes may be a result of the cells’ collaborative or competitive behavior. The mathematical formulation of cell life processes that are crucial for the applications presented in this section are described elsewhere21. In the current version of the model, the focus is particularly on mechanical forces that cells exert on each other. For the purposes of this review, therefore, one mE influence we consider is the ability of cells to recognize the presence of other cells. For instance, if they are part of a lumen, they may or may not sense apoptotic stimuli from outer cells. If they are part of the outer layer of cells in acini, they may or may not polarize correctly. Another mE influence we consider is the background oxygen level, like in the EHCA model. Depending on their hypoxic tolerance, cells may undergo positive or negative selection.
If the cells are given an experimentally derived set of parameters, they can go on to build realistic epithelial structures, such as acini, ducts, tubes21. It is important to realize that the outcome of these simulations is not predetermined, but is an emergent property of the collective behavior of cells, i.e., the model is truly reductionist. The only external input to the model is the set of parameters that regulate growth, proliferation, adhesion, death, and polarization. How cells use these parameters is purely determined by their mechanical interactions with one another, and the mE. Therefore, IBCell is ideal to capture the transition to invasion as epithelial structures (acini, ducts) built or perturbed by cancerous cells become unstable. For instance, we have used IBCell to simulate the growing of cancer cells within the lumen of a duct, and the requirements for duct filling and eventual breaching22. Selective pressure from the mE, in the form of low nutrient levels, will also perturb the morphology of growing cell aggregates by selecting only those cells that have maximum capacity to proliferate.
Brief description of HDC
The Hybrid Discrete Continuum (HDC) model operates at the cell-to-tissue scale, and is broadly based on the growth of a generic three-dimensional solid tumor, but, for economy of computation time, we only consider a one-cell diameter thick two-dimensional slice through it. Mathematically, however, translation to 3-D is straightforward 6. Like the EHCA model, cells are considered as points on a lattice and modeled using a hybrid cellular automata approach. The mE consists of a two dimensional lattice of extracellular matrix (ECM) (f) upon which oxygen (c) diffuses and is produced/consumed, and matrix degrading proteases (m) are produced/used. The mE variables f,c and m are controlled by a system of continuous reaction-diffusion equations whereas the tumor cells (Ni,j) are considered as discrete individuals which occupy single lattice points (i, j), hence HDC is a Hybrid between a Discrete and a Continuum model. Unlike the EHCA and IBCell models, cell movement is controlled by directional movement probabilities that are functions of the local ECM concentration and allow the cell to remain stationary (P0) or move west (P1), east (P2), south (P3) or north (P4) one grid point at each time step (see Fig. 1). The motion of an individual cell is therefore governed by its interactions with the ECM in its local environment. Of course the motion will also be modified by interactions with other tumor cells. Each individual cell is also endowed with a predefined phenotype consisting of specific cell traits, including proliferation, death, cell-cell adhesion, cell-matrix adhesion, and secretion of ECM-degrading proteases (m), which determines how it behaves and interacts with other cells and its environment. These traits can be parameterized with experimental data from the laboratory or the literature. A more detailed description of the model and its application have appeared in print17,23
A key feature of the HDC model is that the tumor cell population is heterogeneous with each cell phenotype being defined from a pool of 100 randomly predefined phenotypes within a biologically relevant range of cell specific traits (more or less than 100 phenotypes could easily be considered, likely with similar outcomes). In order to capture the process of mutation we assign cells a small probability (Pmutat) of changing some of their traits at the time of cell division. If such a change occurs, the cell is randomly assigned a new phenotype from the pool of 100. A feature of the HDC model especially relevant to invasion is that cells have the ability to move. This makes it possible to examine (and parameterize from experiments) the impact of cell-ECM interactions on cell migration. In summary, in the HDC model cell migration, proliferation and death, coupled with mutating phenotypes, create a tumor population whose individual cell components interact with each other and have the ability to adapt to the mE (within the confines of the 100 randomly defined phenotypes). In this scenario, it is possible to examine tumor growth morphological outcomes, the traits of phenotypes best adapted to a local mE, the dynamics of the adaptation process, and the influence of a range of different mE on morphology and adaptation outcomes.
Distinctive mE modeling features of EHCA, IBCell and HDC
By limiting the mE in all three models to only a few elements we have been able to better focus on their effects on cells. Thus all three models are aligned with our ultimate goal, which is to identify fundamental mechanisms that underlie interactions between cells and their mE during cancer invasion. Nonetheless, in each model the mE has some differences worth noting.
In EHCA, the mE elements are represented as information input to a network that links genotype with phenotype. In a sense, this information can be viewed as input that trains the network to adapt. This is an abstraction of a fundamental biological process, cell adaptation to mE conditions. Perhaps the closest experimental method that captures this process is gene expression analyzed by microarrays24. In this technique, cells are placed in distinct mE (e.g., high and low serum concentrations), and their gene expression profile is compared, globally25. A key difference between EHCA and microarrays is that in EHCA the gene layer network is monitored at the single-cell level, whilst in microarrays, for technical reasons of sensitivity, gene expression profiles are the average of a population of cells (although ultrasensitive single-cell microarrays will be available, no doubt, in the future). We are exploiting these similarities to improve analysis of microarray data with new analytical tools (Gerlee and Zhang, in preparation). This may become an excellent example of theory guiding experimentation and vice versa, since the single-cell set up of EHCA can deconvolve the gene expression averages of microarrays, whilst microarray expression data can validate theoretical predictions of the EHCA.
In IBCell, our intention was to represent the mE primarily as mechanical forces. In a sense, we wanted to represent the interface between chemical and physical events, based on the view that the physical laws of the mE (which includes cells) determine and constrain cell behavior, which is based mostly on chemical reactions (of course, there are chemical reactions occurring in the mE as well). There is a high level of abstraction in this model, e.g., receptors are grouped in broad categories, unlike real life, and they all directly transduce mechanochemical information. IBCell is aimed at representing the effects of the mE on intercellular organization and the resulting creation of morphological structures that make functional sense. In cancer, the morphology of histological structures made by transformed cells has been described as a caricature of normal histology26,27. IBCell has the potential to quantify the influence of the mE on the process of morphogenesis, particularly epithelial morphogenesis22 in both normal and cancerous tissue.
In HDC, the mE contains more elements, inclusive of soluble nutrients, ECM and matrix degrading enzymes. HDC has the least level of abstraction, and in fact it has the potential to explicitly incorporate mE elements from real life, such as inflammatory cells, angiogenesis, stem cell niches, etc. The goal of HDC, in a sense, is to determine how single-cell behavior translates into emergent properties at the cell population level. In biological terms, one can think of it as cell differentiation affecting tissue organization, because in HDC the cellular phenotype is a composite of traits that explicitly reflect core cell processes, such as proliferation, migration, metabolism, secretion, etc. By dialing each of these traits up or down, in different combinations, HDC effectively defines differentiation states of every cell in the simulation. For instance, HDC could model epithelial to mesenchymal transition, or vice versa.
From this brief description of the distinct features of the three models, we hope it is clear that they operate at different but overlapping scales, though all considering the cell as the fundamental unit: EHCA is at the molecular (gene expression) scale, IBCell is solidly at the cell scale, while HDC captures primarily the tissue scale.
Common features in the three models make it possible to compare their inner workings, outcomes, predictions or conclusions. They can be highlighted as follows: (i) Each model treats cells as individuals with their own distinct inner life processes (e.g., proliferation, death, mutation, migration). (ii) Cells sense and influence each other (e.g., death signals in IBCell), and interact with and alter the local mE, e.g., by occupying space, sensing nutrients and modifying their concentrations by consumption. (iii) Acquisition of two resources, space and nutrients, is the major influence on adaptive behavior of cells. (iv) In all three models, since they are individual-cell based, cells themselves are part of the mE, e.g., the number of neighboring cells is a variable that contributes to modifying proliferative response, akin to contact inhibition. (v) Availability of resources in the mE sets the stage for competition between individual cells during adaptation and can set in motion a struggle among phenotypes that evolves the tumor population.
We now examine simulations from these models in a range of mE conditions, and discuss the implications of outcomes.
Insights from simulated tumor growth dynamics
Fingering morphology as a modeling abstraction of invasion
In order to understand the key role that nutrients play in driving changes in tumor morphology we use each of the three models to investigate how changes in cell metabolic parameters influence the structure of the developing tumor. Specifically we consider a single mE value, oxygen concentration. Changes in this mE variable are sensed by cells and if the hypoxia threshold level h occurs, they become growth arrested or die. For all three models we start each simulation with the same initial cluster of tumor cells embedded in a homogenous field of a given oxygen concentration and allow cells to interact with their mE. This leads to the development of different tumor morphologies including the emergence of tumor fingering, summarized in the form of a graphical table (see figure 2).
Figure 2.

Simulation results from all three models for tumors grown under a range of mE background oxygen levels (k) and cell hypoxia tolerance thresholds (h): HDC (upper figure in each square), EHCA (left figure in each square) and IBCell (right figure in each square). Both parameters (k and h) influence the morphology of the tumour: increasing k reduces size and produces fingering, increasing h has a similar, albeit more subtle effect. Colouration for cell types: red (proliferating); green (quiescent); blue (dead).
Several trends are apparent (figure 2) in the resulting tumor morphologies from representative simulations in which we systematically varied availability of mE oxygen and cell hypoxia sensitivity (h). A common feature is that living (red) cells are mostly located on outer rims and surround central cores of dead (blue) cells, consistent with the idea that the best adapted phenotypes are the ones capable of positioning themselves at the tumor margin, by proliferation or motility. For high mE oxygen levels and low hypoxia thresholds (cells require less oxygen to survive or proliferate), the tumor grows into a compact morphology, with a smoothly growing leading margin that leaves an even distribution of dead cells in its wake. As the background oxygen level is decreased and the hypoxic cell threshold is elevated, a fingering morphology emerges. Decreasing mE oxygen levels also appear to decrease the overall size of the tumor. In contrast, elevating hypoxia thresholds result in approximately constant tumor size, but emerging fingers take on thinner, more elongated shapes. These trends are best visualized along the diagonal (top left to bottom right): simulated tumors are smaller and more fingered as mE oxygen decreases and oxygen requirement by cells increases. These results point to a direct correlation between tumor morphology and the intensity of competition for resources during simulated tumor growth.
Whilst all three models produce similar trends in tumor morphologies under similar conditions, there are also some differences. The HDC and EHCA models produce the closest results to each other. However, the EHCA simulated tumors are generally much more compact, mostly due to the fact that the cells can migrate in the HDC but not in the EHCA model (movement will be added in a future version). The IBCell model results present some unique features that can be grouped into three distinct morphologies: large clusters with smooth boundaries, medium size clusters with finger-like extensions and small clusters of non-growing cells. The reason for these differences from the other two models is due in part to scale and in part to the limited ability of cells in IBCell to evolve by progressive adaptation. Nonetheless, if we examine the three outcomes specific to IBCell simulations in more detail, a possible reason emerges for the differences in model outcomes as well as tumor morphologies. Figure 3 (upper panel) shows the distribution of cells for the three different IBCell simulation outcomes: solid, fingered, growth arrested. As the IBCell model is driven by receptor dynamics, we examine the distribution of cells in each of these morphologies according to their percentage of free growth receptors and the total concentration of oxygen sensed by each cell. Figure 3(a), shows that the majority of cells above the growth threshold of free growth receptors are actually growing (red), all quiescent cells (green) lie in the region above the hypoxic threshold and below the growth threshold, and almost all hypoxic cells (blue) are starving and are overcrowded. In contrast, figure 3(b) shows that numerous hypoxic cells lie above the growth threshold, that is they maintain more than 20% of their receptors free from cell-cell adhesion, so their growth suppression is due to low levels of oxygen in their vicinity and not to overcrowding, this suggests that the finger-like morphology is rather a result of hypoxia-related growth suppression than overcrowding. Figure 3(c) shows in turn, that all cells in the growth arrested tumors lie well below their hypoxia threshold. In spite of this uniqueness, the common trend persists in IBCell: emergence of a fingering morphology in the presence of low oxygen conditions, i.e., a harsh mE that can spawn competition among adapting cell phenotypes.
Figure 3.
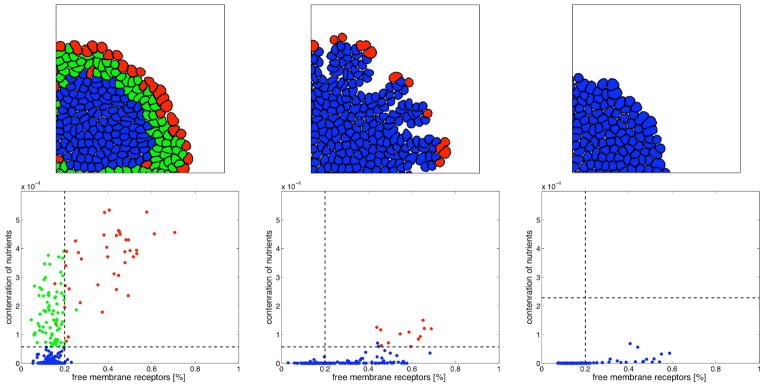
Growth simulation outcomes from the IBCell model. (Upper row): Spatial distribution of cells after 11 cell divisions. Under different mE and hypoxia tolerances, three distinct growth patterns are observed: (left) solid tumours (nutrient-rich mE, normal hypoxia tolerance), (center) tumours with fingering margins (nutrient-scapoorrce mE, normal hypoxia threshold), (right) tumours in growth arrest (nutrient-poor mE, low hypoxia tolerance). (Lower row): Distribution of all cells according to the concentration of nutrients sensed by each cell and the percentage of free growth receptors. Horizontal lines represent the hypoxic tolerance level. Vertical lines represent the 20% growth threshold. Cells colouration denotes cell state: growing (red), quiescent (green), hypoxic (blue).
mE influence on tumor evolutionary dynamics
The mE not only affects tumor morphologies in the simulations discussed above but also acts as a selective pressure that leads to the clonal dominance of more aggressive phenotypes. To understand this result we will examine each of the model results in more detail and under different mE conditions.
The prediction that a harsh environment induces tumor ngering raises the question: is it possible to reverse the fingering morphology by simply increasing the available oxygen levels? If so, how will this affect the growth and evolutionary dynamics of tumor populations? To investigate this point, we focus on the EHCA model and impose two different forms of competition upon the tumor cells—for space and nutrients in the poor oxygen mE (harsh), and for space only in the oxygen rich mE (mild). Figure 4(a) shows simulation results in which the mE is switched between the two conditions. Consistent with results obtained in figure 2 the simulated tumor grows with smooth margins in a mild mE, whereas when switched into a harsh mE, finger like protrusions immediately occur. Analysis of the phenotype dynamics (figure 4(b)) reveals that the phenotype composition of the population also changes under the different mE conditions. In particular, we observe the emergence of more aggressive phenotypes in the oxygen starved mE (e.g. the {1,0,0} and {0.9,0.1,0} phenotypes).
Figure 4.

Growth simulation outcomes from the EHCA model. (Left panels): Spatial distribution of cells in an oxygen switching experiment. In high oxygen mE, the tumour consists mostly of quiescent cells and grows with a round morphology, while in low oxygen mE the tumour is dominated by dead cells and displays a fingering morphology (outcomes of two independent simulations are shown). (Line graph on the right): Time evolution of the phenotypes in the simulations on the left panels. The most abundant phenotypes have been highlighted and their response vectors are displayed - the vector takes the form of three probabilities for (proliferation, quiescence, apoptosis), so that (1,0,0) means the probability of proliferation is 1, i.e., it will always occur.
The implication from this result is that tumor fingering goes hand in hand with the selection of more aggressive phenotypes. However, if we were to consider different harsh mE conditions would the same outcome result? As we reported previously, using the HDC model23 we can investigate different mE conditions and answer this very question. Figure 5 shows the results of growing in silico tumors under three different mE conditions, (a) uniform ECM and normal nutrient, (b) grainy ECM and normal nutrient and (c) uniform ECM and low nutrient. Both of the mEs in (b) and (c) could be considered to be harsh as they are more difficult mE to grow in (figure 5, upper row). Similar to the results from the EHCA model, tumor growth in these harsh conditions leads to both a fingered morphology and fewer, more aggressive cellular phenotypes in (b) and (c) (figure 5, lower row). The aggressive phenotypes obtained in both the HDC and EHCA models under harsh mE growth conditions are similar in that they have the highest proliferation rates; however, HDC phenotypes are more detailed and reveal that the most aggressive phenotypes also have low cell-cell adhesion and high cell motility values.
Figure 5.

Growth simulation outcomes from the HDC model under three different mE: (A) uniform ECM, (B) Grainy ECM and (C) Low nutrient. (Upper row): Spatial tumor cell distributions after 3 months of simulated growth shows that the three different microenvironments have produced distinct tumour morphologies. In particular, the homogeneous ECM distribution has produced a large tumor with smooth margins (A) containing a dead cell inner core and a thin rim of proliferating cells. The tumour in the grainy ECM also has a dead inner core with a thin rim of proliferating cells, however, it displays a striking, branched fingered morphology at the margins (B). This fingering morphology is also observed in the low nutrient simulation, which produced the smallest tumour (C). (Lower row): Relative abundance of the 100 tumour phenotypes as the tumour grew in the different mE: approximately 6 dominant phenotypes in the uniform tumour, 2 in the grainy and 3 in the low nutrient tumour. These phenotypes have several traits in common: low cell-cell adhesion, short proliferation age, and high migration coefficients. In each tumour, one of the phenotypes is the most aggressive and also the most abundant, particularly in B and C. All parameters used in the simulations are identical with the exception of the different mE.
The EHCA and HDC models produce consistent results; however both models begin with cells that have already undergone some initial step of tumorigenesis, e.g., growth is unrestrained. By contrast, the IBCell model is initiated with normal epithelial cells and can progress without phenotype mutations to produce epithelial structure. However, IBCell can be used to test diverse scenarios for the very early steps of tumor initiation, e.g., growth inhibition by mE forces is reduced in all cells, or an occasional cell within the epithelial cluster does not respond to mE growth inhibition cues. Figure 6 shows the IBCell simulated development from a single epithelial cell to: (6a) a normal acinus, or (6b-c) two aberrant structures. In fig. 6b, luminal filling is achieved by removing response to mE growth inhibition cues from all cells (interestingly an acinus of similar size and shape to normal structure forms, though with a filled lumen). In fig. 6c, distorted acinus morphologies, reminiscent of invasive phenotypes, occur via mutation of a single cell such that it loses its ability to polarize and become growth-arrested.
Figure 6.
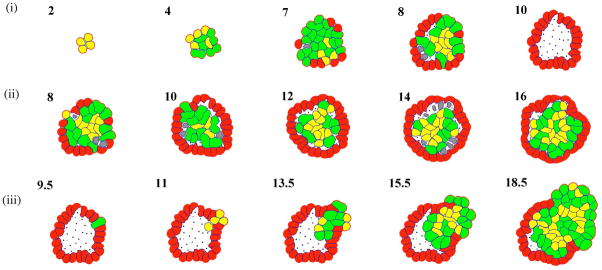
IBCell simulation outcomes. (i) Consecutive stages in the development of a normal hollow acinus from a small cluster of viable cells to an acinar structure composed of a complete outer layer of polarised cells surrounding a hollow luminal space; (ii) Formation of an abnormal acinus with a complete outer layer of polarised cells and an inner core of cells that fail to become growth suppressed and fill the luminal space; (iii) Formation of an abnormal acinus with a cohort of invasive cells arising from a polarization-deficient precursor cell, which deform the outer layer and break through to the outside and to the luminal space. Numbers indicate completed rounds of cell divisions. Cell phenotypes are coloured as follows: resting viable cells (yellow); growing cells (green); polarised cells (red); apoptotic cells (grey); dead cells (black dots).
In summary, three models, all individual cell-based but very different in their construction, can be used to analyze the effect of mE variables on tumor growth. Strikingly, they all reach the same conclusion, and point to competitive adaptation to mE conditions as a determining factor for invasion: both invasive tumor morphology (“fingering”) and evolution of dominant aggressive clonal phenotypes appear to occur by a process of progressive cell adaptation to mE’s that support sustained competition between distinct cancer cell phenotypes. Currently, we are engaged in testing these models’ general predictions via both parameterization of the HDC (Anderson et al., submitted,) or IBCell (Rejniak et al., submitted) models, and validation (Kam et al., in press; Rejniak et al., submitted).
Adaptation and Selection during Cancer Progression
In this review, we have presented three mathematical models of cancer invasion, each representing the mE in different, but connected ways:
in EHCA, the mE is represented as molecular concentrations of nutrients or factors: this limited abstraction appears to be the most appropriate for the purposes of EHCA, to model the link between genes and phenotypes in distinct mE.
in IBCell, the mE is essentially mechanical forces, because the goal of IBCell is to model mechanotransduction, i.e., how cells, as deformable objects driven by chemical reactions, aggregate (at the scale of a few hundred) and form meaningful functional multicellular structures interfacing the physicochemical mE.
in HDC, mE influences include both neighboring cells and concentrations of oxygen or ECM macromolecules, in order to model large scale tissue formation (millions to billions of cells) from single cell behavior.
The predictions of all three mathematical models converge on one message: invasion emerges from the population dynamics of single cancer cells growing and adapting to the mE, when a harsh mE ignites competition for resources between phenotypes with distinct adaptive features. Whilst the models do not disprove the possibility that the mE may also have a regulatory (instructive) effect on cancer cells18, or that some cancer cell phenotypes may be intrinsically invasive28, nonetheless they place a major emphasis on another proximate cause for invasion: the struggle among cancer cell phenotypes with distinct adaptive values to survive by coopting mE resource(s) that have become scarce. It is important to realize that, in the models, distinct phenotypes are generated at random, whilst their relative frequency is non-random and based on their adaptive value to the mE16,23 (fitness, intended as the ability to increase their frequency in the next time step). Therefore, in the models two elements appear to be essential for invasion: adaptation and competition. If either is missing, neither morphological invasion (fingering) nor phenotype evolution may proceed in the models. To be clear, if adaptation is abolished (e.g., by dialing “mutation rates” to zero in the HDC model), cancer cells still form tumors if the mE is favorable, but they consistently present smooth, non-invasive margins and, naturally, evolution by competition is absent because the cancer cell population is immutable (with the exception of an extremely aggressive phenotype matched to an extreme mE, in which case the aggressive phenotype, though unchanging, competes with itself and fingers). If, on the other hand, competition is abolished from the simulations, aggressive phenotypes do emerge from the adaptation process, but in the non-competitive mE they neither invade nor dominate and coexist with other adapted phenotypes in a smooth-margined tumor. In summary, the mE enables invasion by creating competitive conditions among adapting phenotypes29.
Parallels between cancer progression and darwinian evolution
Cancer progression to invasion is described by our models as a process of competitive adaptation ignited by a harsh mE. This framework has obvious similarities to a classic (Darwinian) process of evolution by natural selection. Parallels between cancer progression and Darwinian processes have been discussed recently27,30–33. However, caution should be exercised in jumping to conclusions. This caution is justified by insufficient quantitative data from real or experimental tumors regarding the three key components of darwinian evolution: variation, inheritance, selection. Limitations to be overcome include the following.
Variation: available methods are powerful but there are at least two problems34: 1) most of them average out information on genotypes (gene expression profiling) or phenotypic traits, whereas information on single-cell phenotypic plasticity, variability of phenotypic traits within isogenic cells, and quantitation of phenotype among clonal cells with distinct genotypes is desirable, if not absolutely necessary; 2) the mapping of genotype to phenotype is obviously not one-to-one (one gene, one trait), and therefore experimentally translating genotypes into phenotypes (a collection of behavioral traits, such as proliferation rate, migration rate, metabolic rate, etc.) is a must, because mE selective forces act on these traits.
Inheritance: the need for theoretical, quantitative treatment of somatic cell population genetics has been repeatedly advocated 9,10. We subscribe to that view: without this framework, it will be impossible, for one, to connect properly observed frequencies of mutations in cancer cells with disease outcome.
Selection: whilst the importance of the mE in determining cancer progression is now recognized, quantitative measurements of mE parameters (concentration of nutrients or mitogens, oxygen tension, physical forces, etc.) are still in their early days and far from being routinely applied. In fact, technology for such measurements in need of development.
Once quantitative information on these three aspects of cancer reaches a critical mass, it will be more feasible to determine to what extent Darwinian selection applies to cancer progression. There is hardly any doubt that some form of adaptation, or even evolution, of cancer cell phenotypes occur during cancer progression: The concept of “clonal selection”35 is a cornerstone of cancer biology. However, it is perhaps worth reminding ourselves that evolution by natural selection is by no means the only mechanism of adaptation to the mE, as elegantly summarized by Gould and Lewontin14: “The mere existence of a good fit between organism and environment is insufficient for inferring the action of natural selection”.
For instance (fig. 7), on the longer time scale (years or decades) necessary for cancer to arise, it is possible that classic Darwinian processes, operating in forming cancer tissue, may overcome the rate-limiting steps proposed by multistage progression theory36 (developed to explain age-specific cancer incidence data10,36). In contrast, for the shorter time scales (weeks or months) of terminal cancer progression (Fig. 7), other adaptation/evolution mechanisms may be operational. Epigenetics37,38 come to mind. Another possibility (Fig. 7) is adaptation to stressful mE’s that favors genetic changes39. Mathematical models such as the ones describes here can, if properly parameterized, provide powerful theoretical frameworks for experimental validation of their predictions about mechanisms underlying cancer progression at various stages. Of course, experimental parameterization and validation is a task far from simple. As we discuss elsewhere6, it requires close integration between theoreticians and experimentalists. Furthermore, the enormous amount of data and technology in modern experimental biology is a critical wealth, but it will need to be complemented by mathematics-driven experimentation and novel validation-enabling techniques6.
Figure 7.
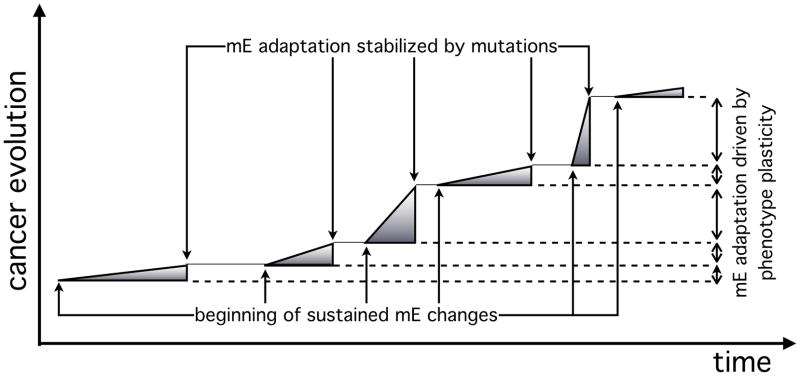
A schematic plot of cancer evolution as a function of time, driven by two distinct adaptive strategies. Initially a well-adapted phenotype is pushed to operate at one extreme of its plasticity range, in order to adapt to changes in the mE. A random genetic mutation in its progeny stabilizes this effect and creates a phenotype well-adapted to the new mE. This process then repeats and leads to further rounds of phenotype adaptation and genotype stabilization (possibly based on additional mutation events), producing a mix of phenotypes with distinct adaptation and adaptability values. At any point in this process, invasion may emerge if a harsh mE (e.g., nutrient- or oxygen-poor) develops and drives competition between these phenotypes (see figure 2).
Conclusions
We hope to have justified how a theoretical framework rooted in mathematical modeling can provide a multiscale, unifying view of cancer progression, with both explanatory and experiment-driving power. Understanding mechanistic details of individual variables of cancer progression is highly desirable and, rightly, most of the cancer research enterprise is focused on this task. This molecular reductionist approach should continue unabated. However, its very success, its ability to produce enormous amounts of data at ever accelerating rates, especially at the molecular scale, has created a huge opportunity and an urgent need for integrative theoretical approaches. Mathematical modeling coupled with experimentation is one powerful approach to fulfill this opportunity and need. For example, the computational results presented here on the importance of adaptation (operating in different modes) would be difficult to grasp intuitively. Mathematical models provide a theoretical framework that produces quantitative testable hypotheses. Experimentation then becomes essential in order to verify 1) whether simulation outcomes apply to real tumors; 2) which mechanisms drive the various stages of tumor progression.
Finally, there is one intriguing conclusion that is worth highlighting because it complements current translational research. It is becoming a general view that cancer is not one, but many diseases that must be characterized individually. In fact, in this genomic era of personalized medicine, it is often argued that even a given type of cancer, e.g., breast or lung cancer, is in fact a composite of many diseases that must be deconvolved at the level of individual patients, for successfully applying treatment40,41. Our models offer an alternative perspective: cancer is one disease, caused by a runaway process of evolution by natural selection, which gives progression its ruthless direction towards malignancy. The outcome of this one disease, however, is diverse in each patient, because its driving process contains stochastic components. That is, one disease, but not the same in every patient. Personalized cancer treatment is still the road to follow42, guided however by the quantitative perspective of properly parameterized computational models that can make sense of both the deterministic and stochastic aspects of the disease, as it arises in a specific patient. It will be fascinating to witness the reach and direction of cancer research as guided by theoretical frameworks.
Acknowledgments
Work described in this review was supported by grant U54-CA113007 from the Integrative Cancer Biology Program of the National Cancer Institute. The authors are grateful to Lourdes Estrada and Alissa Weaver for thoughtful reading of the manuscript, and to all members of the VICBC (http://www.vanderbilt.edu/VICBC/) for their enthusiasm and hard work.
Footnotes
Publisher's Disclaimer: This is a PDF file of an unedited manuscript that has been accepted for publication. As a service to our customers we are providing this early version of the manuscript. The manuscript will undergo copyediting, typesetting, and review of the resulting proof before it is published in its final citable form. Please note that during the production process errors may be discovered which could affect the content, and all legal disclaimers that apply to the journal pertain.
Contributor Information
Vito Quaranta, Email: vito.quaranta@Vanderbilt.Edu, Department of Cancer Biology, Vanderbilt University School of Medicine, Nashville, TN 37235, USA.
Katarzyna A. Rejniak, Division of Mathematics, University of Dundee, Dundee DD14HN, Scotland, UK
Philip Gerlee, Division of Mathematics, University of Dundee, Dundee DD14HN, Scotland, UK.
Alexander R. A. Anderson, Email: anderson@maths.dundee.ac.uk, Division of Mathematics, University of Dundee, Dundee DD14HN, Scotland, UK
References
- 1.Armitage P. Multistage models of carcinogenesis. Environ Health Perspect. 1985;63:195–201. doi: 10.1289/ehp.8563195. [DOI] [PMC free article] [PubMed] [Google Scholar]
- 2.Moolgavkar SH, Luebeck EG. Multistage carcinogenesis and the incidence of human cancer. Genes Chromosomes Cancer. 2003;38(4):302–6. doi: 10.1002/gcc.10264. [DOI] [PubMed] [Google Scholar]
- 3.Knudson AG. Two genetic hits (more or less) to cancer. Nat Rev Cancer. 2001;1(2):157–62. doi: 10.1038/35101031. [DOI] [PubMed] [Google Scholar]
- 4.Lee WH, Bookstein R, Hong F, Young LJ, Shew JY, Lee EY. Human retinoblastoma susceptibility gene: cloning, identification, and sequence. Science. 1987;235(4794):1394–9. doi: 10.1126/science.3823889. [DOI] [PubMed] [Google Scholar]
- 5.Weinberg RA. Oncogenes and tumor suppressor genes. CA Cancer J Clin. 1994;44(3):160–70. doi: 10.3322/canjclin.44.3.160. [DOI] [PubMed] [Google Scholar]
- 6.Anderson ARA, Quaranta V. Nature Reviews Cancer. 2008. Integrative Mathematical Oncology. In Press. [DOI] [PubMed] [Google Scholar]
- 7.Mueller MM, Fusenig NE. Friends or foes - bipolar effects of the tumour stroma in cancer. Nat Rev Cancer. 2004;4(11):839–49. doi: 10.1038/nrc1477. [DOI] [PubMed] [Google Scholar]
- 8.Schmeichel KL, Weaver VM, Bissell MJ. Structural cues from the tissue microenvironment are essential determinants of the human mammary epithelial cell phenotype. J Mammary Gland Biol Neoplasia. 1998;3(2):201–13. doi: 10.1023/a:1018751124382. [DOI] [PMC free article] [PubMed] [Google Scholar]
- 9.Tomlinson I, Bodmer W. Selection, the mutation rate and cancer: ensuring that the tail does not wag the dog. Nat Med. 1999;5(1):11–2. doi: 10.1038/4687. [DOI] [PubMed] [Google Scholar]
- 10.Hornsby C, Page KM, Tomlinson IP. What can we learn from the population incidence of cancer? Armitage and Doll revisited. Lancet Oncol. 2007;8(11):1030–8. doi: 10.1016/S1470-2045(07)70343-1. [DOI] [PubMed] [Google Scholar]
- 11.Loeb LA. A mutator phenotype in cancer. Cancer Res. 2001;61(8):3230–9. [PubMed] [Google Scholar]
- 12.Anderson AR, Chaplain MAJ, Rejniak KA. Single-Cell-Based Models in Biology and Medicine. Basel: Birkhauser; 2007. [Google Scholar]
- 13.Murray JD. Mathematical biology. New York: Springer; 2002. [Google Scholar]
- 14.Gould SJ, Lewontin RC. The spandrels of San Marco and the Panglossian paradigm: a critique of the adaptationist programme. Proc R Soc Lond B Biol Sci. 1979;205(1161):581–98. doi: 10.1098/rspb.1979.0086. [DOI] [PubMed] [Google Scholar]
- 15.Freyer JP, Sutherland RM. Regulation of growth saturation and development of necrosis in EMT6/Ro multicellular spheroids by the glucose and oxygen supply. Cancer Res. 1986;46(7):3504–12. [PubMed] [Google Scholar]
- 16.Gerlee P, Anderson AR. An evolutionary hybrid cellular automaton model of solid tumour growth. J Theor Biol. 2007;246(4):583–603. doi: 10.1016/j.jtbi.2007.01.027. [DOI] [PMC free article] [PubMed] [Google Scholar]
- 17.Anderson AR. A hybrid mathematical model of solid tumour invasion: the importance of cell adhesion. Math Med Biol. 2005;22(2):163–86. doi: 10.1093/imammb/dqi005. [DOI] [PubMed] [Google Scholar]
- 18.Nelson CM, Bissell MJ. Of extracellular matrix, scaffolds, and signaling: tissue architecture regulates development, homeostasis, and cancer. Annu Rev Cell Dev Biol. 2006;22:287–309. doi: 10.1146/annurev.cellbio.22.010305.104315. [DOI] [PMC free article] [PubMed] [Google Scholar]
- 19.Huang S, Ingber DE. Cell tension, matrix mechanics, and cancer development. Cancer Cell. 2005;8(3):175–6. doi: 10.1016/j.ccr.2005.08.009. [DOI] [PubMed] [Google Scholar]
- 20.Peskin CS, McQueen DM. A general method for the computer simulation of biological systems interacting with fluids. Symp Soc Exp Biol. 1995;49:265–76. [PubMed] [Google Scholar]
- 21.Rejniak KA, Anderson ARA. A computational study of the development of epithelial acini: I. Sufficient conditions for the formation of a hollow structure. Bulletin of Mathematical Biology. 2008 doi: 10.1007/s11538-007-9274-1. [DOI] [PMC free article] [PubMed] [Google Scholar]
- 22.Rejniak KA. An immersed boundary framework for modelling the growth of individual cells: an application to the early tumour development. J Theor Biol. 2007;247(1):186–204. doi: 10.1016/j.jtbi.2007.02.019. [DOI] [PubMed] [Google Scholar]
- 23.Anderson AR, Weaver AM, Cummings PT, Quaranta V. Tumor morphology and phenotypic evolution driven by selective pressure from the microenvironment. Cell. 2006;127(5):905–15. doi: 10.1016/j.cell.2006.09.042. [DOI] [PubMed] [Google Scholar]
- 24.Strauss E. Arrays of hope. Cell. 2006;127(4):657–9. doi: 10.1016/j.cell.2006.11.005. [DOI] [PubMed] [Google Scholar]
- 25.Iyer VR, Eisen MB, Ross DT, Schuler G, Moore T, Lee JC, Trent JM, Staudt LM, Hudson J, Jr, Boguski MS, et al. The transcriptional program in the response of human fibroblasts to serum. Science. 1999;283(5398):83–7. doi: 10.1126/science.283.5398.83. [DOI] [PubMed] [Google Scholar]
- 26.Tarin D. New insights into the pathogenesis of breast cancer metastasis. Breast Dis. 2006;26:13–25. doi: 10.3233/bd-2007-26103. [DOI] [PubMed] [Google Scholar]
- 27.Soto AM, Sonnenschein C. Emergentism as a default: cancer as a problem of tissue organization. J Biosci. 2005;30(1):103–18. doi: 10.1007/BF02705155. [DOI] [PubMed] [Google Scholar]
- 28.Weinberg RA. One renegade cell: how cancer begins. New York, NY: Basic Books; 1998. p. 170. [Google Scholar]
- 29.Dobzhansky TG. Genetics and the origin of species. New York: Columbia University Press; 1951. p. 364. [Google Scholar]
- 30.Crespi B, Summers K. Evolutionary biology of cancer. Trends Ecol Evol. 2005;20(10):545–52. doi: 10.1016/j.tree.2005.07.007. [DOI] [PubMed] [Google Scholar]
- 31.Merlo LM, Pepper JW, Reid BJ, Maley CC. Cancer as an evolutionary and ecological process. Nat Rev Cancer. 2006;6(12):924–35. doi: 10.1038/nrc2013. [DOI] [PubMed] [Google Scholar]
- 32.Gatenby RA, Gillies RJ. A microenvironmental model of carcinogenesis. Nat Rev Cancer. 2008;8(1):56–61. doi: 10.1038/nrc2255. [DOI] [PubMed] [Google Scholar]
- 33.Cahill DP, Kinzler KW, Vogelstein B, Lengauer C. Genetic instability and darwinian selection in tumours. Trends Cell Biol. 1999;9(12):M57–60. [PubMed] [Google Scholar]
- 34.Loo LH, Wu LF, Altschuler SJ. Image-based multivariate profiling of drug responses from single cells. Nat Methods. 2007;4(5):445–53. doi: 10.1038/nmeth1032. [DOI] [PubMed] [Google Scholar]
- 35.Nowell PC. The clonal evolution of tumor cell populations. Science. 1976;194(4260):23–8. doi: 10.1126/science.959840. [DOI] [PubMed] [Google Scholar]
- 36.Frank SA. Dynamics of cancer. Princeton and Oxford: Princeton University Press; 2007. Multistage progression. [PubMed] [Google Scholar]
- 37.Esteller M. Epigenetics in cancer. N Engl J Med. 2008;358(11):1148–59. doi: 10.1056/NEJMra072067. [DOI] [PubMed] [Google Scholar]
- 38.Rando OJ, Verstrepen KJ. Timescales of genetic and epigenetic inheritance. Cell. 2007;128(4):655–668. doi: 10.1016/j.cell.2007.01.023. [DOI] [PubMed] [Google Scholar]
- 39.Kirschner M, Gerhart J. Evolvability. Proc Natl Acad Sci U S A. 1998;95(15):8420–7. doi: 10.1073/pnas.95.15.8420. [DOI] [PMC free article] [PubMed] [Google Scholar]
- 40.Chung CH, Bernard PS, Perou CM. Molecular portraits and the family tree of cancer. Nature Genetics. 2002;32:533–540. doi: 10.1038/ng1038. [DOI] [PubMed] [Google Scholar]
- 41.Quaranta V, Weaver AM, Cummings PT, Anderson ARA. Mathematical modeling of cancer: The future of prognosis and treatment. Clinica Chimica Acta. 2005;357(2):173–179. doi: 10.1016/j.cccn.2005.03.023. [DOI] [PubMed] [Google Scholar]
- 42.Dalton WS. The “total cancer care” concept: linking technology and health care. Cancer Control. 2005;12(2):140–1. doi: 10.1177/107327480501200211. [DOI] [PubMed] [Google Scholar]