

Abstract
Background. The degree to which human immunodeficiency virus (HIV) continues to replicate during antiretroviral therapy (ART) is controversial. We conducted a randomized, double-blind, placebo-controlled study to assess whether raltegravir intensification reduces low-level viral replication, as defined by an increase in the level of 2–long terminal repeat (2-LTR) circles.
Methods. Thirty-one subjects with an ART-suppressed plasma HIV RNA level of <40 copies/mL and a CD4+ T-cell count of ≥350 cells/mm3 for ≥1 year were randomly assigned to receive raltegravir 400 mg twice daily or placebo for 24 weeks. 2-LTR circles were analyzed by droplet digital polymerase chain reaction at weeks 0, 1, 2, and 8.
Results. The median duration of ART suppression was 3.8 years. The raltegravir group had a significant increase in the level of 2-LTR circles, compared to the placebo group. The week 1 to 0 ratio was 8.8-fold higher (P = .0025) and the week 2 to 0 ratio was 5.7-fold higher (P = .023) in the raltegravir vs. placebo group. Intensification also led to a statistically significant decrease in the D-dimer level, compared to placebo (P = .045).
Conclusions. Raltegravir intensification resulted in a rapid increase in the level of 2-LTR circles in a proportion of subjects, indicating that low-level viral replication persists in some individuals even after long-term ART. Intensification also reduced the D-dimer level, a coagulation biomarker that is predictive of morbidity and mortality among patients receiving treatment for HIV infection.
Keywords: HIV, raltegravir intensification, 2-LTR circles, ongoing viral replication, D-dimer
(See the editorial commentary by Chun and Fauci on pages 1356–8.)
One of the major controversies in human immunodeficiency virus (HIV) cure research is whether low-level viral replication persists in otherwise effectively treated HIV-infected individuals. This issue has potential significance not only for ongoing cure strategies, but also for interventions aimed at decreasing the residual immune activation [1–3], immune dysfunction [4, 5], and increased levels of morbidity and mortality [6] that persist in treated HIV-infected individuals.
Several recent studies have consistently shown that treatment intensification in HIV-infected patients receiving antiretroviral therapy (ART) does not decrease plasma HIV RNA levels, as measured by ultrasensitive assays [7–12]. However, some studies have suggested that there may be ongoing, low-level viral replication in a proportion of individuals with ART-suppressed plasma HIV RNA levels, as detected by an early increase in the level of 2–long terminal repeat (2-LTR) circles [8], a decrease in immune activation in peripheral blood mononuclear cells (PBMCs) [13], or a decrease in immune activation and levels of cell-associated HIV RNA in gut-associated lymphoid tissue [9]. Moreover, despite relatively effective suppression of HIV replication, ART-treated adults have a higher risk of developing non–AIDS-associated diseases (including cardiovascular disease, liver disease, renal disease, bone disease, and cancer [14–17]), compared with HIV-uninfected adults. Many factors potentially contribute to this excess risk, including a higher prevalence of traditional risk factors, antiretroviral drug toxicity, and chronic inflammation [18]. Compared with age-matched controls, many markers of inflammation (eg, interleukin-6 [IL-6] and T-cell activation) and hypercoagulation (eg, D-dimer level) remain elevated in treated HIV disease [1, 19]. In fact, these biomarkers are strongly predictive of morbidity and all-cause mortality in ART-treated adults [6, 20, 21].
To determine whether HIV replication persists during ART and whether low-level viral replication contributes to persistent immune dysfunction, we conducted a randomized, double-blind, placebo-controlled study of raltegravir intensification in ART-suppressed individuals and assessed whether intensification led to an increase in the level of 2-LTR circles. We also examined whether intensification led to a reduction in biomarkers of inflammation and hypercoagulation in order to assess whether low-level viral replication has any potential clinical consequences and contributes to the increased non–AIDS-related morbidity and mortality observed among treated individuals.
METHODS
Study Participants
Thirty-one ART-suppressed, HIV-infected subjects with plasma HIV RNA < 40 copies/mL and CD4+ T-cell count ≥350 cells/mm3 for at least 1 year were randomly assigned to receive either raltegravir 400 mg twice daily or matching placebo for 24 weeks (clinical trials registration NCT00843713). Results of the primary virologic, immunologic, and cardiovascular end points have recently been reported elsewhere [12]. All subjects provided written informed consent. This study was approved by the University of California, San Francisco, Committee on Human Research.
2-LTR Circles
2-LTR circles were analyzed in triplicate from DNA extracted from 0.5 million cryopreserved PBMCs at weeks 0, 1, 2, and 8 by droplet digital PCR (ddPCR) [22]. Cellular DNA was extracted using a Qiagen DNA Blood Midi Kit. ddPCR was performed using the Bio-Rad QX-100 emulsification device. Primers to conserved regions of HIV-1 pol (HXB2 positions 2536–2662) and HIV-1 LTR (HXB2 positions 9585–51) were used. An RPP30 (RNAse P) primer/probe set was used to quantify host genomic DNA for purposes of normalization. DNA concentration was estimated from the A260/A280 absorbance ratio, using a NanoDrop 2000 spectrophotometer.
To compare the accuracy of HIV DNA quantification by real-time PCR (qPCR) and ddPCR, stored PBMC samples (n = 156) were analyzed by both qPCR and ddPCR in triplicate [22]. Measurements made by the 2 methods were linearly correlated (Pearson r2 = 0.64), but it was not known a priori which assay was more accurate or precise. To evaluate the precision of the 2-LTR assay, the coefficient of variation among replicate wells was computed for each sample. To account for the expected decrease in assay precision at low copy numbers, the average assay variance was computed as a function of measured copy number (in 0.1 log10 bins). On average, the assay variance was 20-fold lower by ddPCR, compared with qPCR. In addition, the limit of detection of the ddPCR assay was evaluated [1]. A serial dilution of DNA isolated from infected CD4+ T cells into uninfected PBMC DNA was tested with a number of replicate wells that increased as the reciprocal of the template number to a maximum of 36 wells. This allowed detection of both pol and 2-LTR circles at frequencies of 0.7 per million cells.
We compared 2-LTR rates by applying Poisson regression to event count raw data from ddPCR, with a fixed term (known as an “offset”) included in the model to account for variations in the number of droplets tested and the total cellular input, determined by RPP30. The models included fixed person effects to focus on within-person changes between different times while fully controlling for person-to-person variability, as in a matched analysis. All results for 2-LTR circle comparisons are from regression parameters estimated in such models. Although Poisson regression mitigates the influence of extreme values because it models effects on the logarithmic scale, one subject had an extremely large increase in the 2-LTR count at week 1, so we also performed a sensitivity analysis that excluded this subject.
Plasma Biomarkers
Interleukin 6 (IL-6) and D-dimer levels were measured in stored fasting plasma samples for 25 of the 31 subjects (12 raltegravir recipients and 13 placebo recipients) at weeks 0, 4, and 24 at the Laboratory for Clinical Biochemistry Research at the University of Vermont. IL-6 levels were measured with a chemiluminescent sandwich enzyme-linked immunosorbent assay (R&D Systems, Minneapolis, MN), and D-dimer levels were measured with immunoturbidometric methods on the Sta-R analyzer, Liatest D-DI (Diagnostica Stago, Parsippany, NJ). Interassay coefficients of variation for a number of different control materials of different values averaged approximately 10% for both assays. IL-6 and D-dimer levels were log2 transformed because the distributions were right skewed. Between-group differences in the change in the level of each biomarker from weeks 0 to 24 were calculated using analysis of covariance, with adjustment for the baseline level of the biomarker considered. Geometric means of biomarker levels at week 24 are also reported after adjustment for the baseline level. Statistical analyses were performed using SAS software, version 9.2.
RESULTS
Baseline Characteristics
At baseline, the median current and nadir CD4+ T-cell counts were 703 and 210 cells/mm3, respectively (Table 1). The median duration since HIV diagnosis and of ART suppression were 19 and 3.8 years, respectively. Fifteen of the 31 subjects (48%) were receiving a protease inhibitor (PI) as part of their ART regimen.
Table 1.
Baseline Characteristics of 31 Human Immunodeficiency Virus (HIV)–Infected Study Subjects
| Characteristic | Raltegravir (n = 15) | Placebo (n = 16) | P |
|---|---|---|---|
| Age, y | 55 (49–59) | 55 (51–60) | .464 |
| Male sex, subjects, % | 87 | 94 | .600 |
| CD4+ T-cell count, cells/mm3 | 670 (591–819) | 705 (629–808) | .812 |
| Nadir CD4+ T-cell count, cells/mm3 | 205 (74–318) | 215 (99–400) | .549 |
| Duration since HIV diagnosis, y | 19 (17–23) | 15 (9–20) | .072 |
| Duration of HAART suppression, y | 4.4 (3.2–5.7) | 2.7 (2.1–4.4) | .166 |
| PI-containing HAART | |||
| Overall, subjects, no. (%) | 9 (60) | 6 (38) | .289 |
| By PI(s), subjects, no. | |||
| Atazanavir/ritonavir | 4 | 1 | |
| Atazanavir | 2 | 0 | |
| Fosamprenavir/ritonavir | 0 | 3 | |
| Fosamprenavir | 1 | 0 | |
| Lopinavir/ritonavir | 1 | 1 | |
| Lopinavir/ritonavir/saquinavir | 0 | 1 | |
| Saquinavir/ritonavir | 1 | 0 |
Data are medians (interquartile ranges), unless otherwise noted.
Abbreviations: HAART, highly active antiretroviral therapy; PI, protease inhibitor.
As reported previously, raltegravir intensification did not have a substantial effect on plasma HIV RNA level (as measured by an ultrasensitive single-copy assay; P = .16), cell-associated HIV RNA level (P = .90), proviral HIV DNA level (P = .51), or CD4+ T-cell activation (CD38+HLA-DR+; P = .90) and CD8+ T-cell activation (CD38+HLA-DR+; P = .91) in PBMCs [12].
2-LTR Circles
The raltegravir group had a substantial increase in the level of 2-LTR circles, compared with baseline (estimated ratio of week 1 to week 0 values, 4.7 [95% confidence interval {CI}, 1.55–20.1; P = .0045]; ratio of week 2 to week 0 values, 3.4 [95% CI, 1.02–15.3; P = .046]; and ratio of week 8 to week 0 values, 3.6 [95% CI, 1.10–15.9; P = .033]; Figure 1). There were no substantial changes in the level of 2-LTR circles in the placebo group. The raltegravir group had a significant increase in the level of 2-LTR circles, compared with the placebo group. The week 1 to week 0 ratio averaged 8.8-fold (95% CI, 2.1–48.4-fold) higher in the raltegravir group, compared with the placebo group (P = .0025), and the week 2 to week 0 ratio averaged 5.7-fold (95% CI, 1.27–32.0-fold) higher in the raltegravir group, compared with the placebo group (P = .023). Nine of the 15 subjects receiving raltegravir had an increase in the level of 2-LTR circles at weeks 1 or 2, compared with 3 of 15 subjects in the placebo group (P = .060; 1 subject in the placebo group was excluded because of no follow-up 2-LTR circle measurements). When the 1 subject with an extreme increase in the level of 2-LTR circles at week 1 was excluded, the week 1 to week 0 ratio still averaged 2.9-fold (95% CI, .55–18.2-fold) higher in the raltegravir group, compared with the placebo group, although this was not statistically significant (P = .21).
Figure 1.

Increase in the level of 2–long terminal repeat (2-LTR) circles in the raltegravir group. The raltegravir group (red) had a significant increase in the level of 2-LTR circles, compared with the placebo group (blue). The week 1 to week 0 ratio was 8.8-fold higher (P = .0025) and the week 2 to week 0 ratio was 5.7-fold higher (P = .023) in the raltegravir group, compared with the placebo group. Nine of the 15 subjects receiving raltegravir had an increase in the level of 2-LTR circles at weeks 1 or 2, compared with 3 of 15 subjects in the placebo group (P = .060; 1 subject in the placebo group was excluded because of no follow-up 2-LTR circle measurements). Black ovals indicate subjects who had an increase in the level of 2-LTR circles at weeks 1 or 2. Asterisks indicate subjects receiving a protease inhibitor as part of their antiretroviral therapy regimen.
The rise in the level of 2-LTR circles in the raltegravir group was more pronounced in subjects receiving a PI-based ART regimen. Among the subset of subjects in the raltegravir group receiving a PI, there was a marked increase in the level of 2-LTR circles, compared with baseline (estimated ratio of week 1 to week 0 values, 6.4 [95% CI, 1.80–40.5; P = .0024]; ratio of week 2 to week 0 values, 3.9 [95% CI, .97–26.0; P = .055]; and ratio of week 8 to week 0 values, 4.1 [95% CI, 1.06–27.3; P = .04]). In contrast, among the subset of subjects in the raltegravir group not receiving a PI, the effect was attenuated (estimated ratio of week 1 to week 0 values, 1.07 [95% CI, .04–27.3; P = .96]; ratio of week 2 to week 0 values, 2.3 [95% CI, .20–51.2; P = .50]; and ratio of week 8 to week 0 values, 2.3 [95% CI, .20–51.2; P = .48]).
Plasma Biomarkers
At baseline, the median levels of IL-6 and D-dimer were 1.78 pg/mL (interquartile range [IQR], 1.30–2.74 pg/mL) and 0.31 pg/mL (IQR, 0.20–0.39 µg/mL), respectively; these levels are comparable to IL-6 and D-dimer levels of HIV-infected individuals from other cohorts [6, 19]. The change in IL-6 levels at week 24 did not differ significantly between the raltegravir and placebo groups (P = .39). On the log2 scale, the IL-6 levels increased by 0.31 pg/mL for the raltegravir group and by 0.01 pg/mL for the placebo group (difference, −0.29 pg/mL; 95% CI, −.99 to .41). Geometric mean IL-6 levels at week 24 for the raltegravir and placebo groups were 2.35 and 1.91 pg/mL, respectively.
On the other hand, intensification led to a statistically significant decrease in D-dimer levels at week 24, compared with placebo (change in D-dimer levels, −0.26 log2 μg/mL in the raltegravir group and +0.49 log2 μg/mL in the placebo group; P = .045; Figure 2). This corresponds to a 0.60-fold (95% CI, .36–.99-fold) decrease in D-dimer levels for the raltegravir group, relative to the placebo group. Geometric mean D-dimer levels at week 24 for the raltegravir and placebo groups were 0.24 and 0.41 µg/mL, respectively. The decline in D-dimer levels for the raltegravir group was evident at week 4 (P = .039 for the difference from the placebo group); geometric mean D-dimer levels at week 4 for the raltegravir and placebo groups were 0.19 and 0.40 µg/mL, respectively.
Figure 2.
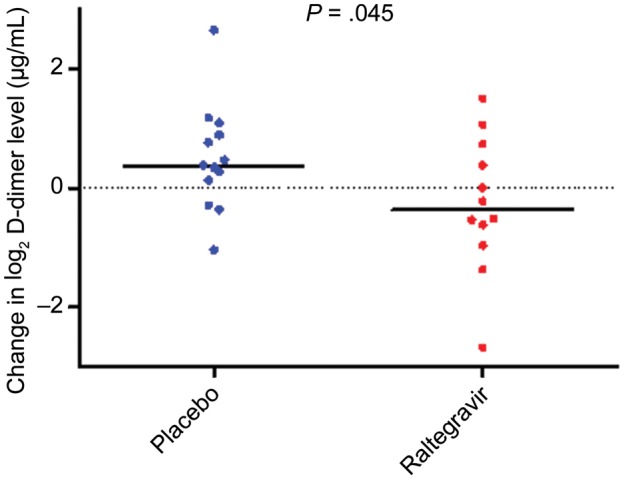
Raltegravir intensification leads to a decrease in D-dimer levels. Raltegravir intensification led to a significant decrease in D-dimer levels from week 0 to week 24 (change in D-dimer levels, −0.26 log2 μg/mL in the raltegravir group and +0.49 log2 μg/mL in the placebo group; P = .045). Data for 3 subjects (1 in the raltegravir group and 2 placebo group) are missing.
DISCUSSION
In this randomized, double-blind, placebo-controlled study, raltegravir intensification resulted in a rapid and transient increase in the level of 2-LTR circles in a proportion of patients with effectively treated HIV infection. Linear HIV complementary DNA (cDNA) is circularized by host DNA repair enzymes to form episomal cDNA (1- and 2-LTR circles) [23]. Raltegravir, an integrase inhibitor, prevents linear HIV cDNA from integrating into the host genome. Although there is some controversy over how long 2-LTR circles persist [24], several studies have shown that they are labile products of virus infection and can therefore be used as surrogate markers of recent viral replication events [23, 25, 26]. Thus, the observed increase in the level of 2-LTR circles after raltegravir intensification suggests the presence of ongoing, low-level viral replication in these individuals. We also observed a decrease in D-dimer levels with raltegravir intensification, suggesting that residual replication contributes to persistent alterations in the coagulation pathway that have been well-documented in HIV-infected adults [20, 21, 27].
Our data are consistent with results from Buzon et al, who previously found that raltegravir intensification led to an early increase in the level of 2-LTR circles [8]. In their study, 69 subjects with ART-suppressed HIV infection were randomized to receive raltegravir intensification or to continue ART without intensification in an open-label, 48-week study. The level of 2-LTR circles was measured at weeks 0, 2, 4, 12, 24, and 48. The raltegravir group had a transient and significant increase in the level of 2-LTR circles at weeks 2 and 4, compared with baseline. In contrast, an increase in the level of 2-LTR circles was not observed in other raltegravir intensification studies in which 2-LTR circles were measured at later time points (4 weeks [28] and 12 weeks [29] after initiation of intensification), suggesting that most newly formed 2-LTR circles are short-lived and that this surrogate method of detecting ongoing viral replication must be assayed early [23]. Buzon et al also observed in their study that the raltegravir recipients who had an increase in the level of 2-LTR circles had higher levels of immune activation at baseline, which then decreased with intensification [8, 13]. In our current study, we observed that, among the 12 of 31 subjects who had an early increase in the level of 2-LTR circles, the 9 subjects in the raltegravir group had a lower mean level of immune activation (defined as the percentage of CD38+HLA-DR+ CD8+ T cells) at week 24, compared to the 3 subjects in the placebo group (18.4% in the raltegravir group vs 34.4% in the placebo group; P = .043).
Although many subjects in our study displayed a transient increase in the level of 2-LTR circles with raltegravir intensification, we observed no substantial change in ultrasensitive plasma HIV RNA levels with intensification. This is consistent with previous intensification studies [7–12] and suggests that (1) most HIV RNA in plasma is due to transient production of virus from a latent reservoir, rather than a reflection of ongoing replication; and (2) there may be distinct viral reservoirs within an ART-suppressed individual, one that is more active and produces low-level rounds of de novo infection and another that is more quiescent and from which there is only stochastic release of viral RNA [30].
As noted above, nearly half (48%) of our study subjects were receiving a PI as part of their ART regimen (Table 1). We observed that the rise in the level of 2-LTR circles in the raltegravir group tended to occur in subjects receiving a PI-based ART regimen. This was also observed in the study by Buzon et al, in which 22% of subjects were receiving a PI-based ART regimen (atazanavir or lopinavir) [8]. Moreover, in our previous raltegravir intensification study in “immunologic nonresponders” (defined as individuals with a CD4+ T-cell count of <350 cells/mm3 despite at least 1 year of ART-mediated viral suppression), we noted that, although intensification did not lead to a decrease in plasma HIV RNA levels (as detected by an ultrasensitive single-copy assay), there was a significant decrease in plasma HIV RNA levels in subjects receiving a PI-based ART regimen [11]. Collectively, these data suggest that some PIs may allow low-level viral replication to occur. One reason for this may be because of inadequate tissue penetration at critical lymphoid sites [31]. An alternative (or additional) explanation may be related to the dose-response curves of specific PIs. Siliciano et al have shown that, as a drug class, PIs have a much higher inhibitory potential at peak plasma concentrations than other antiretroviral drug classes [32]. This is due in part to their very steep dose-response curves (as defined by the Hill coefficient); small increases in drug concentration lead to dramatic increases in viral inhibition. However, the converse is also true in that drugs with a high Hill coefficient are vulnerable to small decreases in drug concentration, such that small decreases in drug concentration lead to significant reductions in the degree of viral inhibition [33]. Thus, for PIs with a shorter half-life and a high Hill coefficient, the inhibitory potential can decline dramatically during the dosing interval, and this may allow new infection events to occur when drug concentrations are low. These effects are likely to differ across the various drugs within the PI drug class; future studies are necessary to further elucidate this issue.
Our secondary objective was to assess the potential clinical consequences of low-level viral replication. We measured the effect of raltegravir intensification on levels of IL-6 (a measure of systemic inflammation status) and D-dimer (an integrated measure of clot formation and degradation and thus, an indication of coagulant status). Both biomarkers have been shown to be strong, consistent, and independent predictors of increased morbidity and mortality in HIV infection [20, 21, 27, 34]. Although we observed no effect on IL-6, we found that raltegravir intensification led to a significant decrease in D-dimer levels, despite our cohort having baseline D-dimer levels that were comparable to those of HIV-infected individuals from other cohorts [6, 19]. If elevated D-dimer levels reflect excess clot formation and breakdown, our data support a previously proposed model in which HIV replication either directly or indirectly activates the coagulation cascade and contributes to thrombus formation and cardiovascular morbidity [35]. Of note, in a recent study of simian immunodeficiency virus–infected nonhuman primates, diffuse clotting in tissues was found at autopsy, supporting this model [36]. As reported previously, in our current study raltegravir intensification did not lead to an improvement in cardiovascular function, as measured by flow-mediated vasodilatation (a marker of macrovascular dysfunction) or hyperemic velocity (a marker of microvascular dysfunction) [12]. It may be that D-dimer levels represent a more sensitive or more proximal measure of cardiovascular function. However, because our sample size was small (and the resulting CI around the treatment difference was very wide), we cannot assess with certainty whether the observed treatment difference in D-dimer levels has any clinical relevance. It would be important to pursue this finding in future, larger studies.
In summary, we have shown for the first time in a randomized, double-blind, placebo-controlled study that the addition of raltegravir to a stable ART regimen resulted in a rapid and transient increase in the level of 2-LTR circles in a proportion of effectively treated HIV-infected patients, indicating that residual replication persists in some individuals even after long-term suppressive ART. This appeared to be particularly true in patients receiving a PI-based ART regimen, which suggests that with “antiretroviral optimization” (ie, the use of effective, highly bioavailable antiretroviral drugs that have robust lymphoid tissue penetration), ongoing viral replication could be further suppressed to negligible levels. We also found that raltegravir intensification led to a significant decrease in levels of D-dimer, a coagulation biomarker that has previously been shown to be predictive of increased morbidity and mortality in treated HIV disease. The potential of ongoing, low-level viral replication should be considered as a modifiable factor in future cure and treatment strategies.
Notes
Disclaimer. The funders had no role in study design, data collection and analysis, decision to publish, or preparation of the manuscript.
Financial support. This work was supported by the National Institute of Allergy and Infectious Diseases (grants R01 AI087145, K24 AI069994, AI080193, AI69432, AI047745, and AI74621); the Delaney AIDS Research Enterprise (grant U19 AI0961090); the Collaboratory for AIDS Research on Eradication (grant U19 AI096113); the National Heart Lung and Blood Institute (grant R01 HL095130); the American Foundation for AIDS Research (grant 106710–40-RGRL); the UCSF/Gladstone Institute of Virology & Immunology Center for AIDS Research (CFAR; grant P30 AI027763); the University of California, San Diego, CFAR (grant AI306214); the University of California, San Francisco, Clinical and Translational Research Institute Clinical Research Center (grant UL1 RR024131); the Center for AIDS Prevention Studies (grant P30 MH62246); the CFAR Network of Integrated Systems (grant R24 AI067039); and the Department of Veterans Affairs.
Potential conflicts of interest. H. H. and S. G. D. have received research support from Merck. D. D. R. has consulted for Merck. All other authors report no potential conflicts.
All authors have submitted the ICMJE Form for Disclosure of Potential Conflicts of Interest. Conflicts that the editors consider relevant to the content of the manuscript have been disclosed.
References
- 1.Hunt PW, Martin JN, Sinclair E, et al. T cell activation is associated with lower CD4+ T cell gains in human immunodeficiency virus-infected patients with sustained viral suppression during antiretroviral therapy. J Infect Dis. 2003;187:1534–43. doi: 10.1086/374786. [DOI] [PubMed] [Google Scholar]
- 2.Hunt PW, Cao HL, Muzoora C, et al. Impact of CD8+ T cell activation on CD4+ T cell recovery and mortality in HIV-infected Ugandans initiating antiretroviral therapy. AIDS. 2011;25:2123–31. doi: 10.1097/QAD.0b013e32834c4ac1. [DOI] [PMC free article] [PubMed] [Google Scholar]
- 3.Hatano H, Jain V, Hunt PW, et al. Cell-based measures of viral persistence are associated with immune activation and programmed cell death protein 1 (PD-1)-expressing CD4+ T cells. J Infect Dis. 2013;208:50–6. doi: 10.1093/infdis/jis630. [DOI] [PMC free article] [PubMed] [Google Scholar]
- 4.Day CL, Kaufmann DE, Kiepiela P, et al. PD-1 expression on HIV-specific T cells is associated with T-cell exhaustion and disease progression. Nature. 2006;443:350–4. doi: 10.1038/nature05115. [DOI] [PubMed] [Google Scholar]
- 5.Trautmann L, Janbazian L, Chomont N, et al. Upregulation of PD-1 expression on HIV-specific CD8+ T cells leads to reversible immune dysfunction. Nat Med. 2006;12:1198–202. doi: 10.1038/nm1482. [DOI] [PubMed] [Google Scholar]
- 6.Kuller LH, Tracy R, Belloso W, et al. Inflammatory and coagulation biomarkers and mortality in patients with HIV infection. PLoS Med. 2008;5:e203. doi: 10.1371/journal.pmed.0050203. [DOI] [PMC free article] [PubMed] [Google Scholar]
- 7.McMahon D, Jones J, Wiegand A, et al. Short-course raltegravir intensification does not reduce persistent low-level viremia in patients with HIV-1 suppression during receipt of combination antiretroviral therapy. Clin Infect Dis. 2010;50:912–9. doi: 10.1086/650749. [DOI] [PMC free article] [PubMed] [Google Scholar]
- 8.Buzon MJ, Massanella M, Llibre JM, et al. HIV-1 replication and immune dynamics are affected by raltegravir intensification of HAART-suppressed subjects. Nat Med. 2010;16:460–5. doi: 10.1038/nm.2111. [DOI] [PubMed] [Google Scholar]
- 9.Yukl SA, Shergill AK, McQuaid K, et al. Effect of raltegravir-containing intensification on HIV burden and T-cell activation in multiple gut sites of HIV-positive adults on suppressive antiretroviral therapy. AIDS. 2010;24:2451–60. doi: 10.1097/QAD.0b013e32833ef7bb. [DOI] [PMC free article] [PubMed] [Google Scholar]
- 10.Gandhi RT, Zheng L, Bosch RJ, et al. The effect of raltegravir intensification on low-level residual viremia in HIV-infected patients on antiretroviral therapy: a randomized controlled trial. PLoS Med. 2010;7 doi: 10.1371/journal.pmed.1000321. doi:pii:e1000321. [DOI] [PMC free article] [PubMed] [Google Scholar]
- 11.Hatano H, Hayes TL, Dahl V, et al. A randomized, controlled trial of raltegravir intensification in antiretroviral-treated, HIV-infected patients with a suboptimal CD4+ T cell response. J Infect Dis. 2011;203:960–8. doi: 10.1093/infdis/jiq138. [DOI] [PMC free article] [PubMed] [Google Scholar]
- 12.Hatano H, Scherzer R, Wu Y, et al. A randomized, controlled trial assessing the effects of raltegravir intensification on endothelial function in treated HIV infection. J Acquir Immune Defic Syndr. 2012;61:317–25. doi: 10.1097/QAI.0b013e31826e7d0f. [DOI] [PMC free article] [PubMed] [Google Scholar]
- 13.Llibre JM, Buzon MJ, Massanella M, et al. Treatment intensification with raltegravir in subjects with sustained HIV-1 viraemia suppression: a randomized 48-week study. Antivir Ther. 2012;17:355–64. doi: 10.3851/IMP1917. [DOI] [PubMed] [Google Scholar]
- 14.Phillips AN, Neaton J, Lundgren JD. The role of HIV in serious diseases other than AIDS. AIDS. 2008;22:2409–18. doi: 10.1097/QAD.0b013e3283174636. [DOI] [PMC free article] [PubMed] [Google Scholar]
- 15.Neuhaus J, Angus B, Kowalska JD, et al. Risk of all-cause mortality associated with nonfatal AIDS and serious non-AIDS events among adults infected with HIV. AIDS. 2010;24:697–706. doi: 10.1097/QAD.0b013e3283365356. [DOI] [PMC free article] [PubMed] [Google Scholar]
- 16.Triant VA, Brown TT, Lee H, Grinspoon SK. Fracture prevalence among human immunodeficiency virus (HIV)-infected versus non-HIV-infected patients in a large U.S. healthcare system. J Clin Endocrinol Metab. 2008;93:3499–504. doi: 10.1210/jc.2008-0828. [DOI] [PMC free article] [PubMed] [Google Scholar]
- 17.Young B, Dao CN, Buchacz K, Baker R, Brooks JT. Increased rates of bone fracture among HIV-infected persons in the HIV Outpatient Study (HOPS) compared with the US general population, 2000–2006. Clin Infect Dis. 2011;52:1061–8. doi: 10.1093/cid/ciq242. [DOI] [PubMed] [Google Scholar]
- 18.Deeks SG, Phillips AN. HIV infection, antiretroviral treatment, ageing, and non-AIDS related morbidity. BMJ. 2009;338:a3172. doi: 10.1136/bmj.a3172. [DOI] [PubMed] [Google Scholar]
- 19.Neuhaus J, Jacobs DR, Jr, Baker JV, et al. Markers of inflammation, coagulation, and renal function are elevated in adults with HIV infection. J Infect Dis. 2010;201:1788–95. doi: 10.1086/652749. [DOI] [PMC free article] [PubMed] [Google Scholar]
- 20.Musselwhite LW, Sheikh V, Norton TD, et al. Markers of endothelial dysfunction, coagulation and tissue fibrosis independently predict venous thromboembolism in HIV. AIDS. 2011;25:787–95. doi: 10.1097/QAD.0b013e3283453fcb. [DOI] [PMC free article] [PubMed] [Google Scholar]
- 21.Duprez DA, Neuhaus J, Kuller LH, et al. Inflammation, coagulation and cardiovascular disease in HIV-infected individuals. PLoS One. 2012;7:e44454. doi: 10.1371/journal.pone.0044454. [DOI] [PMC free article] [PubMed] [Google Scholar]
- 22.Strain MC, Lada SM, Luong T, et al. Highly precise measurement of HIV DNA by droplet digital PCR. PLoS One. 2013;8:e55943. doi: 10.1371/journal.pone.0055943. [DOI] [PMC free article] [PubMed] [Google Scholar]
- 23.Sharkey ME, Teo I, Greenough T, et al. Persistence of episomal HIV-1 infection intermediates in patients on highly active anti-retroviral therapy. Nat Med. 2000;6:76–81. doi: 10.1038/71569. [DOI] [PMC free article] [PubMed] [Google Scholar]
- 24.Pierson TC, Kieffer TL, Ruff CT, Buck C, Gange SJ, Siliciano RF. Intrinsic stability of episomal circles formed during human immunodeficiency virus type 1 replication. J Virol. 2002;76:4138–44. doi: 10.1128/JVI.76.8.4138-4144.2002. [DOI] [PMC free article] [PubMed] [Google Scholar]
- 25.Sharkey M, Triques K, Kuritzkes DR, Stevenson M. In vivo evidence for instability of episomal human immunodeficiency virus type 1 cDNA. J Virol. 2005;79:5203–10. doi: 10.1128/JVI.79.8.5203-5210.2005. [DOI] [PMC free article] [PubMed] [Google Scholar]
- 26.Murray JM, McBride K, Boesecke C, et al. Integrated HIV DNA accumulates prior to treatment while episomal HIV DNA records ongoing transmission afterwards. AIDS. 2012;26:543–50. doi: 10.1097/QAD.0b013e328350fb3c. [DOI] [PubMed] [Google Scholar]
- 27.Morse CG, Dodd LE, Nghiem K, et al. Elevations in D-dimer and C-reactive protein are associated with the development of osteonecrosis of the hip in HIV-infected adults. AIDS. 2013;27:591–5. doi: 10.1097/QAD.0b013e32835c206a. [DOI] [PMC free article] [PubMed] [Google Scholar]
- 28.Besson GJ, McMahon D, Maldarelli F, Mellors JW. Short-course raltegravir intensification does not increase 2 long terminal repeat episomal HIV-1 DNA in patients on effective antiretroviral therapy. Clin Infect Dis. 2012;54:451–3. doi: 10.1093/cid/cir721. [DOI] [PMC free article] [PubMed] [Google Scholar]
- 29.Gandhi RT, Coombs RW, Chan ES, et al. No effect of raltegravir intensification on viral replication markers in the blood of HIV-1-infected patients receiving antiretroviral therapy. J Acquir Immune Defic Syndr. 2012;59:229–35. doi: 10.1097/QAI.0b013e31823fd1f2. [DOI] [PMC free article] [PubMed] [Google Scholar]
- 30.Buzon MJ, Codoner FM, Frost SD, et al. Deep molecular characterization of HIV-1 dynamics under suppressive HAART. PLoS Pathog. 2011;7:e1002314. doi: 10.1371/journal.ppat.1002314. [DOI] [PMC free article] [PubMed] [Google Scholar]
- 31.Fletcher CV. Overcoming pharmacologic sanctuaries [abstract 108]. Program and abstracts of the 19th Conference on Retroviruses and Opportunistic Infections; Seattle, Washington. [Google Scholar]
- 32.Shen L, Peterson S, Sedaghat AR, et al. Dose-response curve slope sets class-specific limits on inhibitory potential of anti-HIV drugs. Nat Med. 2008;14:762–6. doi: 10.1038/nm1777. [DOI] [PMC free article] [PubMed] [Google Scholar]
- 33.Jilek BL, Zarr M, Sampah ME, et al. A quantitative basis for antiretroviral therapy for HIV-1 infection. Nat Med. 2012;18:446–51. doi: 10.1038/nm.2649. [DOI] [PMC free article] [PubMed] [Google Scholar]
- 34.Boulware DR, Hullsiek KH, Puronen CE, et al. Higher levels of CRP, D-dimer, IL-6, and hyaluronic acid before initiation of antiretroviral therapy (ART) are associated with increased risk of AIDS or death. J Infect Dis. 2011;203:1637–46. doi: 10.1093/infdis/jir134. [DOI] [PMC free article] [PubMed] [Google Scholar]
- 35.Funderburg NT, Mayne E, Sieg SF, et al. Increased tissue factor expression on circulating monocytes in chronic HIV infection: relationship to in vivo coagulation and immune activation. Blood. 2010;115:161–7. doi: 10.1182/blood-2009-03-210179. [DOI] [PMC free article] [PubMed] [Google Scholar]
- 36.Pandrea I, Cornell E, Wilson C, et al. Coagulation biomarkers predict disease progression in SIV-infected nonhuman primates. Blood. 2012;120:1357–66. doi: 10.1182/blood-2012-03-414706. [DOI] [PMC free article] [PubMed] [Google Scholar]