

Abstract
Background
Rapid desensitization transiently prevents severe allergic reactions, allowing administration of life-saving therapies in previously sensitized patients. However, the mechanisms underlying successful rapid desensitization are not fully understood.
Objectives
We sought to investigate whether the mast cell (MC) is an important target of rapid desensitization in mice sensitized to exhibit IgE-dependent passive systemic anaphylaxis in vivo and to investigate the antigen specificity and underlying mechanisms of rapid desensitization in our mouse model.
Methods
C57BL/6 mice (in vivo) or primary isolated C57BL/6 mouse peritoneal mast cells (PMCs; in vitro) were passively sensitized with antigen-specific anti–2,4-dinitrophenyl IgE, anti-ovalbumin IgE, or both. MCs were exposed over a short period of time to increasing amounts of antigen (2,4-dinitrophenyl–human serum albumin or ovalbumin) in the presence of extracellular calcium in vitro or by means of intravenous administration to sensitized mice in vivo before challenging the mice with or exposing the PMCs to optimal amounts of specific or irrelevant antigen.
Results
Rapidly exposing mice or PMCs to progressively increasing amounts of specific antigen inhibited the development of antigen-induced hypothermia in sensitized mice in vivo and inhibited antigen-induced PMC degranulation and prostaglandin D2 synthesis in vitro. Such MC hyporesponsiveness was induced antigen-specifically and was associated with a significant reduction in antigen-specific IgE levels on MC surfaces.
Conclusions
Rapidly exposing MCs to progressively increasing amounts of antigen can both enhance the internalization of antigen-specific IgE on the MC surface and also desensitize these cells in an antigen-specific manner in vivo and in vitro.
Keywords: Anaphylaxis, antigen, basophil, degranulation, desensitization, IgE, mast cell, rapid desensitization, receptor internalization, rush desensitization
Mast cells (MCs) are key effector cells in patients with IgE-dependent immediate hypersensitivity disorders. Multivalent allergens (herein referred to as antigens) activate MCs by binding to FcεRI-bound IgE antibodies, causing cross-linking of IgE and aggregation of FcεRI complexes and thereby signaling MCs to release many biologically active mediators.1-4 In severe cases such antigen-, IgE-, and MC-dependent release of mediators can induce anaphylaxis, a catastrophic and potentially fatal reaction.5
Rapid desensitization (or rush desensitization) is used clinically to prevent the occurrence of anaphylaxis and other severe allergic reactions in subjects who are highly sensitized to particular antigens, including drugs (eg, antibiotics and chemo-therapeutic agents) and mAbs.6,7 Despite the clinical effectiveness of rapid desensitization protocols, the mechanisms by which they prevent the occurrence of acute allergic responses to antigen are not yet fully understood.8,9
MCs and basophils are thought to be important target cells in rapid desensitization because mediators from these cells are released during allergic hypersensitivity reactions within seconds.10-12 Moreover, some early studies demonstrated that MCs or basophils become hyporesponsive to antigen challenge after their desensitization in vitro.13-17 However, in each of these studies, the cells were desensitized under nonphysiologic conditions (eg, cells were treated with a single suboptimal concentration of antigen in the absence of extracellular calcium).
Recently, Sancho-Serra et al18 reported that mouse bone marrow–derived cultured mast cells (BMCMCs) generated in vitro could be desensitized by sequentially increasing concentrations of specific antigen in the presence of physiologically relevant extracellular calcium levels. Using 2 different antigen-specific IgEs, they demonstrated that such rapid desensitization can be induced in an antigen-specific manner. They also reported that IgE internalization was impaired after rapid desensitization using their protocol and concluded that the inhibition of IgE internalization might be the underlying mechanism of rapid desensitization. This proposed mechanism challenges the longstanding hypothesis that IgE internalization (ie, loss of IgE molecules from the cell surface) is a key mechanism in rapid desensitization.16,19,20
In the present study we first sought to develop a mouse model of rapid desensitization to investigate whether the MC is truly an important target cell of this process in vivo. We then used that model and an in vitro model of rapid desensitization to investigate whether internalization of antigen-specific IgE from the MC surface was associated with the development of antigen-specific rapid desensitization in vivo or in vitro.
RESULTS
Rapid desensitization reduces antigen-induced anaphylaxis in mice in vivo
In mice passively sensitized (intravenously) with anti–2,4-dinitrophenyl (DNP) IgE, a single challenge with antigen (DNP–human serum albumin [HSA]) decreased body temperature in a dose-dependent manner; under the conditions tested, no mice died of the reaction (Fig 1, A). This model of PSA is largely dependent on MCs.22 Indeed, antigen-induced hypothermia was not observed in MC-deficient C57BL/6-KitW-sh/W-sh mice (Fig 1, A). On the basis of these results, we designed a rapid desensitization protocol using sequential cumulative doses of DNP-HSA in vivo (Fig 1, B); we used 0.015 mg/kg DNP-HSA as the first dose because it did not induce hypothermia (Fig 1, A and B). Mice were then injected with incremental doses of DNP-HSA (0.05, 0.15, and 0.5 mg/kg) at 30-minute intervals and then administered the target dose (1.5 mg/kg), which produced the optimal/maximum response when mice were not desensitized. Although single doses of 0.15, 0.5, and 1.5 mg/kg DNP-HSA caused a significant reduction in body temperature (Fig 1, A), we did not observe any significant hypothermia if these doses were added sequentially (ie, the mice were desensitized; Fig 1, B). Moreover, mice were hyporesponsive to antigen challenge when the target dose of antigen (1.5 mg/kg) was administered 30 minutes (Fig 1, B), 1 day (see Fig E1, A, in this article’s Online Repository at www.jacionline.org), or 3 days (see Fig E1, B) after the last desensitization dose. In pilot experiments a reduction in body temperature was still observed in response to a challenge with 0.15 mg/kg DNP-HSA administered 30 minutes after a first injection of 0.015 mg/kg DNP-HSA (see Fig E2, A, in this article’s Online Repository at www.jacionline.org), suggesting that several steps using gradually increasing doses of antigen are needed to effectively desensitize mice to a target dose of antigen.
FIG 1.

Rapid desensitization can prevent PSA reactions in vivo. Mice were sensitized (intravenously) with 100 μg/kg anti-DNP (A and B), 100 μg/kg anti-OVA (C and D), or both anti-DNP and anti-OVA (total of 200 μg/kg, E and F) IgE. Body temperature was measured after a single challenge (intravenously) with DNP-HSA (Fig 1, A) or OVA (Fig 1, C). Fig 1, B, D, E, and F, Body temperature was measured at the indicated times points after injection (intravenous) with sequentially increasing amounts (Desensitization) or a target dose (Challenge) of DNP-HSA or OVA. N = 3 to 11 mice per group from at least 3 independent experiments, each of which produced similar results. **P < .01, *P < .05, and n.s. (not significant, P > .05). i.v., Intravenously. Body temperatures at 15 minutes (Fig 1, A and C); at 15, 45, 75, 105, and 135 minutes (Fig 1, B and D); or at 135 minutes (Fig 1, E and F) in each group were compared by using 1-way ANOVA, followed by the Bonferroni test.
Next, we confirmed these findings using another antigen-specific IgE. In anti-ovalbumin (OVA) IgE–sensitized (intravenously) mice a single challenge with OVA induced hypothermia in a dose-dependent manner (Fig 1, C), and none of the responses were fatal. Again, this PSA reaction was not observed in MC-deficient C57BL/6-KitW-sh/W-sh mice (Fig 1, C), and sequential administration of progressively increasing doses of OVA allowed challenge with the target dose of 2 mg/kg OVA without inducing detectable hypothermia (Fig 1, D). By contrast, a significant reduction in body temperature was still observed when mice were challenged with a second dose of 0.3 mg/kg OVA 30 minutes after a first injection of 0.1 mg/kg OVA (Fig E2, B), again highlighting the importance of using a series of appropriate incremental doses to achieve desensitization.
We then examined the antigen specificity of such findings using mice sensitized (intravenously) with both anti-DNP and anti-OVA IgE. Injection of sequentially increasing doses of DNP-HSA (0.015 → 0.5 mg/kg) inhibited the hypothermia induced after challenge with the target dose (1.5 mg/kg) of DNP-HSA (Fig 1, E). By contrast, challenge with 1.5 mg/kg DNP-HSA induced significant, although slightly attenuated, hypothermia in mice sequentially injected (ie, desensitized) with increasing concentrations of OVA (0.1 → 1 mg/kg). Similarly, although sequential OVA injections (0.1 → 1 mg/kg) markedly inhibited the hypothermia induced by challenge with 2 mg/kg OVA, sequential DNP injections (0.015 → 0.5 mg/kg) did not (Fig 1, F). Given that 1.5 mg/kg DNP-HSA challenge induced hypothermia in OVA-desensitized mice and 2 mg/kg OVA challenge induced hypothermia in DNP-HSA–desensitized mice, the effector mechanisms responsible for the MC-mediated induction of hypothermia were largely intact in both the DNP- and OVA-desensitized mice. These results strongly suggest that antigen desensitization in our model occurs in an antigen-dependent manner in vivo.
PMCs can be rapidly desensitized to antigen in vitro
PMCs sensitized with anti-DNP IgE were activated by a single challenge with DNP-HSA in a concentration-dependent manner (Fig 2, A). On the basis of this response, we designed a rapid desensitization protocol using DNP-HSA in vitro (Fig 2, B; a more detailed description of the protocol is provided in Fig E3 in this article’s Online Repository at www.jacionline.org). Preliminary experiments revealed that several steps with appropriate incremental doses of antigen are required to desensitize PMCs effectively to a target dose of DNP-HSA in vitro. For example, PMCs treated with 1 ng/mL DNP-HSA followed 10 minutes later by 10 ng/mL DNP-HSA still exhibited robust (although significantly reduced) degranulation (see Fig E4 in this article’s Online Repository at www.jacionline.org), suggesting that antigen concentration cannot be increased by 10-fold at each desensitization step.
FIG 2.

Rapid desensitization of MCs in vitro. Purified PMCs were sensitized with anti-DNP (A-H and N-P), anti-OVA (I-K), or both anti-DNP and anti-OVA (L and M) IgE. Percentage of β-hexosaminidase release was measured after a single challenge with DNP-HSA (Fig 2, A), OVA (Fig 2, I), or anti-IgE antibody (α-IgE; Fig 2, N). Effects of desensitizing PMCs with sequentially increasing concentrations of DNP-HSA, OVA, or α-IgE (using experimental protocols shown in Fig 2, B, J, L, and O and Fig E3) on β-hexosaminidase release (Fig 2, C, H, K, M, and P), β-hexosaminidase remaining in the cell pellet (Fig 2, D), morphology of Giemsa-stained PMCs (Fig 2, E), histamine release (Fig 2, F), or PGD2 production (Fig 2, G) without (A-G and I-P) or with (Fig 2, H) washing the media before antigen challenge are shown. N = 6 to 9 mice per group from 2 to 3 independent experiments, each of which produced similar results. **P < .01, *P < .05, and n.s. (not significant, P > .05) for comparisons between indicated groups.‡P < .01 and N.S. (not significant, P > .05) versus the No Desens. + No Challenge group.
Without rapid desensitization, challenge with 100 ng/mL DNP-HSA (No Desens. + DNP Challenge group) induced significant β-hexosaminidase release (Fig 2, C), reduced the amount of β-hexosaminidase remaining in the cell pellet (Fig 2, D), caused changes in PMC morphology (Fig 2, E), and induced histamine release (Fig 2, F) and PGD2 production (Fig 2, G). If the PMCs were treated with sequentially increasing concentrations of DNP-HSA at 10-minute intervals (DNP Desens. group), enhanced release of β-hexosaminidase was not induced (Fig 2, C). Moreover, these desensitized PMCs did not subsequently respond to challenge with the target dose (100 ng/mL) of DNP-HSA (DNP Desens. + DNP Challenge group; Fig 2, C-G). Washing such PMCs before challenge with 100 ng/mL DNP-HSA did not detectably alter their hyporesponsiveness (Fig 2, H).
Next, we tested this model of rapid desensitization using a different antigen-specific IgE. PMCs sensitized with anti-OVA IgE could be activated by OVA in a concentration-dependent manner (Fig 2, I). However, after treatment with sequentially increasing concentrations of OVA (Fig 2, J, and see Fig E3), PMCs did not degranulate in response to the target dose (16,000 ng/mL) of OVA challenge (Fig 2, K).
To test whether PMCs can be desensitized in an antigen-specific manner, PMCs were sensitized with both anti-DNP and anti-OVA IgE and then exposed to sequentially increasing concentrations of DNP-HSA or OVA (Fig 2, L, and see Fig E3). Rapid desensitization with DNP-HSA or OVA inhibited DNP-HSA–induced (DNP Desens. + DNP Challenge group) or OVA-induced (OVA Desens. + OVA Challenge group) β-hexosaminidase release, respectively (Fig 2, M). However, OVA-desensitized PMCs fully responded to DNP-HSA challenge (OVA Desens. + DNP Challenge group) and DNP-HSA-desensitized PMCs fully responded to OVA challenge (DNP Desens. + OVA Challenge group), strongly suggesting that rapid desensitization of PMCs in vitro occurs in an antigen-dependent manner.
PMCs sensitized with anti-DNP IgE also could be activated by anti-IgE antibody in a concentration-dependent manner (Fig 2, N). On the basis of this result, we designed a protocol to test whether exposure to anti-IgE antibody can alter responsiveness to DNP-HSA (Fig 2, O, and see Fig E3). Sequentially increasing concentrations of anti-IgE antibody partially but significantly inhibited the degranulation response induced by challenging PMCs with the optimal concentration of anti-IgE antibody (ie, 500 ng/mL). Notably, PMCs desensitized to DNP-HSA did not fully respond to challenge with 500 ng/mL anti-IgE antibody either (Fig 2, P), suggesting that accessibility of the anti-IgE antibody to IgE molecules might be reduced in DNP-HSA–desensitized PMCs. Similarly, PMCs desensitized with anti-IgE antibody did not fully respond to challenge with DNP-HSA (Fig 2, P), suggesting that anti-DNP IgE molecules on the PMC surface might be reduced by anti-IgE antibody desensitization.
Rapid desensitization can reduce numbers of IgE molecules on MC surfaces
Because PMCs are easily isolated, we isolated and analyzed these cells after subjecting mice to a rapid desensitization protocol and/or antigen challenge in vivo. However, c-Kit+ PMCs were not effectively sensitized with IgE if we used the PSA protocol (intravenous injection of IgE) described in Fig 1; compared with PMCs from naive mice, PMCs from mice sensitized with 100 μg/kg anti-DNP IgE (intravenously) showed neither significantly higher expression levels of IgE on the cell surface (see Fig E5, A and B, in this article’s Online Repository at www.jacionline.org) nor enhanced degranulation on challenge with specific antigen (see Fig E5, C). Therefore we changed the protocol from 100 μg/kg administered intravenously (Fig 1) to 300 μg/kg administered intraperitoneally (Fig 3) to sensitize PMCs with IgE more effectively. The dose of antigen to be used for challenge was selected based on a pilot experiment (see Fig E6 in this article’s Online Repository at www.jacionline.org). Challenge (intravenous) of sensitized mice with a single target dose of DNP-HSA (10 mg/kg, No Desens. + DNP Challenge group) induced hypothermia (Fig 3, A), but no mice died of the reaction.
FIG 3.

Diminished surface IgE levels on MCs after rapid desensitization in vivo. Mice were sensitized (intraperitoneally) with 300 μg/kg anti-DNP IgE. A, Body temperature was measured at the indicated time points after injection (intravenously) with sequentially increasing amounts (Desensitization) or a target dose (Challenge) of DNP-HSA. B-F, Peritoneal cells and sera were collected from mice at the 180-minute time point (before challenge with 10 mg/kg DNP-HSA, n = 6; Fig 3, B-F) or at the 240-minute time point (after challenge with 10 mg/kg DNP-HSA, n = 6; Fig 3, D-F). Fig 3, B, Representative dot plots of surface IgE levels and c-Kit expression on peritoneal cells isolated from individual naive (No sensitization) or anti-DNP IgE–sensitized mice without (No Desens.) or with (DNP Desens.) desensitization at 180 minutes in Fig 3, A (before DNP-HSA challenge). We tested 3 (Naive) or 6 (No Desens. and DNP Desens.) mice, each of which produced similar results. The average percentage of cells in each quadrant from 3 (Naive) or 6 (No Desens. and DNP Desens.) individual mice is shown in red. Fig 3, C, MFI of cell-surface IgE molecules in c-Kit+ PMCs in Fig 3, B. Data were normalized by using MFI from naive mice as 100%. Fig 3, D, Representative Giemsa-stained cytospin preparations showing PMCs (arrowheads). Fig 3, E, Extent of PMC degranulation. The percentage of MCs exhibiting extensive (>50% of granules in that cell exhibiting evidence of degranulation), moderate (10% to 50% of granules affected), or no (none; <10% granules affected) degranulation was quantified by using Giemsa-stained slides, as in Fig 3, D. Fig 3, F, MCPT-1 concentrations in mouse serum. In Fig 3, D through F, samples from both the 180-minute (before DNP-HSA challenge) and 240-minute (after DNP-HSA challenge) time points (from mice in Fig 3, A) were analyzed. N = 6 samples per group from 3 independent experiments, each of which produced similar results. **P < .01 and n.s. (not significant, P > .05). Fig 3, A, Body temperatures at 15, 45, 75, 105, 135, 165, or 195 minutes in each group were compared by using the unpaired Student t test. i.p., Intraperitoneally; i.v., intravenously.
We detected significantly more IgE on the surface of c-Kit+ PMCs from mice sensitized with 300 μg/kg anti-DNP IgE (intraperitoneally) than on PMCs isolated from naive mice (Naïve mice vs No Desens. group; Fig 3, B and C). Challenge (intravenously) of such sensitized mice with a single target dose of DNP-HSA (10 mg/kg, No Desens. + DNP Challenge group) also induced morphologic changes in PMCs (Fig 3, D and E) and increased mast cell protease 1 (MCPT-1) levels in the serum (Fig 3, F). Sequential intravenous injections of DNP-HSA (0.01 → 3 mg/kg, DNP Desens. group) did not cause significant changes in body temperature (Fig 3, A), percentage of PMCs in whole peritoneal cells (Fig 3, B), PMC morphology (Fig 3, D and E), or serum MCPT-1 levels (Fig 3, F). However, levels of surface IgE on PMCs were significantly reduced after desensitization (DNP Desens. group; Fig 3, B and C). In these desensitized mice challenge with the target dose (10 mg/kg) of DNP-HSA (DNP Desens. + DNP Challenge group) did not induce hypothermia (Fig 3, A), changes in PMC morphology (Fig 3, D and E), or an increase in serum MCPT-1 levels (Fig 3, F). These results indicate that the numbers of IgE molecules on the surfaces of PMCs are reduced during desensitization and that subsequent challenge of such mice with antigen does not induce MC activation or systemic anaphylaxis in vivo.
We next assessed whether rapid desensitization in vitro can influence the amount of IgE on the PMC surface. Cell-surface IgE levels were increased after PMCs were sensitized with anti-DNP IgE in vitro (Fig 4, A). Challenge with a single dose of DNP-HSA reduced surface IgE levels in a concentration-dependent manner (Fig 4, B), and sequentially exposing PMCs to increasing concentrations of DNP-HSA did not induce PMC degranulation (Fig 4, C, lower panel) but significantly reduced surface levels of IgE (Fig 4, C, upper panel). Moreover, challenge of such desensitized PMCs with 100 ng/mL DNP-HSA did not induce degranulation (Fig 4, C, lower panel). Such reductions in PMC surface IgE levels were not observed when the desensitization protocol was performed on ice to prevent receptor internalization (Fig 4, D).23 Although keeping PMCs on ice for 70 minutes (without desensitization) reduced the amount of β-hexosaminidase released in response to DNP-HSA challenge at 37°C, PMCs that we attempted to desensitize on ice released amounts of β-hexosaminidase in response to DNP-HSA challenge at 37°C that were similar to those released by PMCs that also had been maintained on ice but were not desensitized (Fig 4, E), supporting our hypothesis that receptor internalization is a key mechanism of rapid desensitization. Similar to results obtained with anti-DNP IgE (Fig 4, A-D), PMC surface levels of anti-OVA IgE were reduced by sequentially increasing concentrations of OVA, as well as by a single challenge with OVA (Fig 4, F).
FIG 4.

Reduction of IgE levels on PMC surfaces after rapid desensitization in vitro. Primary isolated PMCs were sensitized with anti-DNP (A-E) or anti-OVA (F) IgE and treated with DNP-HSA (Fig 4, A-E) or OVA (Fig 4, F) by using the desensitization protocol shown in Fig E3. Fig 4, A, Representative histograms showing surface IgE levels on PMCs. Fig 4, B, MFI of cell-surface IgE after challenge with a single dose of DNP-HSA. Fig 4, C, MFI of cell-surface IgE (upper panel) or β-hexosaminidase release (lower panel) after each step. Fig 4, D, MFI of cell-surface IgE after desensitization protocol at 37°C or on ice. Fig 4, E, Percentage of β-hexosaminidase release after DNP-HSA challenge (37°C) in PMCs subjected to the desensitization protocol at 37°C or on ice. Fig 4, F, MFI of cell-surface IgE after desensitization and challenge with OVA. Fig 4, B, C, D, and F, MFI data were normalized by using MFI from unstimulated cells (gray bars) as 100%. N = 3 to 9 samples per group from 2 to 3 independent experiments, each using PMCs pooled from 3 to 5 mice. **P < .01 and n.s. (not significant, P > .05) for comparisons between indicated groups. ‡P < .01 and N.S. (not significant, P > .05) versus 0 ng/mL (Fig 4, B) and the No Desens. + No Challenge (Fig 4, C) group, respectively.
We tried to confirm that rapid desensitization in vitro can influence the amount of IgE on the PMC surface using a second anti-DNP IgE clone, SPE-7, which has been used by other groups to study MC desensitization in vitro.18,24 Unlike other mouse IgEs, SPE-7 can efficiently induce FcεRI internalization in BMCMCs in the absence of known antigen.25 Indeed, unlike anti-DNP IgE clone ε-26, SPE-7 did not upregulate IgE levels on the surfaces of PMCs in a concentration-dependent manner (Fig 5, A). Moreover, in contrast to results obtained with anti-DNP IgE clone ε-26, DNP-HSA–induced degranulation did not increase when PMCs were sensitized with higher amounts of SPE-7 (Fig 5, B). These results suggest that SPE-7 might induce the internalization of FcεRI in the absence of antigen on PMCs, as previously reported for BMCMCs.25 After sensitization with either SPE-7 or ε-26, we detected evidence of IgE internalization (ie, reduced mean fluorescence intensity [MFI] of fluorescein isothiocyanate [FITC] anti-IgE), as well as reduced antigen-induced degranulation after desensitization of PMCs in vitro (Fig 5, C); however, the differences were much less pronounced when cells were sensitized with SPE-7 versus ε-26. On the basis of these results (Fig 5) and the documented unusual properties of SPE-7,25 we continued our studies with clone ε-26.
FIG 5.

Internalization of SPE-7 anti-DNP IgE in the absence of specific antigen. Primary isolated PMCs were sensitized without or with anti-DNP IgE clone SPE-7 (Sigma) or clone ε-26 for 16 to 24 hours. A, MFI of cell-surface IgE after sensitization. B, DNP-HSA (100 ng/mL)–induced β-hexosaminidase release. C, MFI of cell-surface IgE (upper panel) or β-hexosaminidase release (lower panel) measured after desensitization, as shown in Fig E3. The MFI data were normalized by using MFI from No IgE Control group cells (gray bars) as 100%. N = 4 to 5 samples per group from at least 2 independent experiments, each using PMCs pooled from 3 to 5 mice. **P < .01, *P < .05, and n.s. (not significant, P > .05) for comparisons between indicated groups. ‡P < .01, †P < .05, and N.S. (not significant, P > .05) versus the No IgE Control group.
We also tried to test FcεRI expression levels on the surfaces of PMCs using anti-FcεRIα antibody (clone MAR-1). After IgE sensitization, anti-IgE antibody detected more IgE on the PMC surface versus naive PMCs (Figs 3, B, and 4, A); however, anti-FcεRIα antibody detected less FcεRIα on the PMC surface versus that on naive PMCs after IgE sensitization (see Fig E7 in this article’s Online Repository at www.jacionline.org). Because IgE binds to the α chain of FcεRI, IgE binding to FcεRI might block anti-FcεRIα antibody binding to the same receptor. Therefore we were unable to use this anti-FcεRIα antibody to investigate internalization of IgE-bound FcεRI.
We used Alexa Fluor 633–labeled anti-DNP IgE to evaluate whether IgE on the MC surface is internalized into the cells after rapid desensitization. IgE on the surfaces of PMCs sensitized with Alexa Fluor 633–unlabeled (Fig 6, A) or Alexa Fluor 633–labeled (Fig 6, B-D) anti-DNP IgE was detected by using FITC anti-IgE. PMCs sensitized with Alexa Fluor 633–labeled anti-DNP (No Desens. group) were double positive for Alexa 633 (anti-DNP IgE) and FITC anti-IgE (all IgE on the cell surface), as determined by using flow cytometry (Fig 6, B). Moreover, both Alexa Fluor 633–labeled anti-DNP IgE and FITC anti-IgE were found primarily on the surface of these cells by using confocal microscopy (Fig 6, C, and see Fig E8 in this article’s Online Repository at www.jacionline.org). After DNP-HSA desensitization (DNP Desens. group) of PMCs sensitized with Alexa Fluor 633–labeled anti-DNP IgE, we detected reduced amounts of IgE (FITC) on the cell surface using flow cytometry (Fig 6, B) or confocal microscopy (Fig 6, C, and see Fig E8). These PMCs were Alexa Fluor 633 positive, as determined by using flow cytometry (Fig 6, B), and confocal analysis revealed that the Alexa Fluor 633–labeled anti-DNP IgE was primarily localized inside these cells after DNP-HSA desensitization (Fig 6, C, and see Fig E8). When PMCs that had or had not been desensitized were challenged with the target dose of DNP-HSA, the cells remained Alexa Fluor 633 positive by using flow cytometry (Fig 6, B), and confocal analysis again revealed that the Alexa Fluor 633–labeled anti-DNP IgE was primarily localized inside the cells (Fig 6, C, and see Fig E8); these cells became FITC negative as assessed by flow cytometry (Fig 6, B) and confocal microscopy (Fig 6, C, and see Fig E8), indicating that there was less IgE on the cell surface. In contrast to the aforementioned results obtained at 37°C (Fig 6, B), when PMCs sensitized with Alexa Fluor 633–labeled anti-DNP IgE were desensitized with DNP-HSA on ice to prevent receptor internalization,23 PMCs were double positive for Alexa Fluor 633 (anti-DNP IgE) and FITC (all IgE on the cell surface;Fig 6, D), supporting our findings in Fig 4, D. Measurement of β-hexosaminidase release indicated that PMCs sensitized with Alexa Fluor 633–labeled anti-DNP IgE degranulated in response to a single challenge with target DNP-HSA but were hyporesponsive to target DNP-HSA challenge after desensitization (Fig 6, E).
FIG 6.

Internalization of IgE during rapid desensitization. Primary isolated PMCs were sensitized with Alexa Fluor 633–unlabeled (A) or Alexa Fluor 633–labeled (B-E) anti-DNP IgE and then desensitized (0.78 → 50 ng/mL) and challenged (100 ng/mL) with DNP-HSA at 37°C (Fig 6, A-C and E) or on ice (Fig 6, D) by using the protocol in Fig E3. Representative flow cytometric dot plots (Fig 6, A, B, and D) or confocal microscopic images (Fig 6, C) showing staining for cell-surface IgE (detected with FITC anti-IgE) and Alexa Fluor 633–labeled anti-DNP IgE. Fig 6, E, β-Hexosaminidase release from PMCs stimulated as in Fig 6, B. Fig 6, A, B, and D, Four samples per group from 2 independent experiments, each using PMCs pooled from 3 to 5 mice; the average percentage of cells in each quadrant is shown. Fig 6, C, Four images per group from 2 independent experiments, each using PMCs pooled from 3 to 5 mice, were examined; one representative image is shown. **P < .01 and n.s. (not significant, P > .05).
We also examined the fate of antigen after our desensitization protocol using Alexa Fluor 633–labeled DNP-HSA. PMCs not sensitized with anti-DNP IgE exhibited some nonspecific binding of Alexa Fluor 633–labeled DNP-HSA (approximately 31%); however, the majority of cells were Alexa Fluor 633 low (approximately 68%) and had low levels of IgE (approximately 82%), as detected by using FITC anti-IgE, on the cell surface (Fig 7, A). When desensitization with Alexa Fluor 633–labeled DNP-HSA was attempted with PMCs on ice, we observed high levels of surface IgE (FITC), as well as Alexa Fluor 633–labeled DNP-HSA (Alexa Fluor 633; Fig 7, B), supporting our findings in Fig 4, D. When desensitization was performed at 37°C, IgE (FITC) levels on the cell surface were low, but the cells were DNP-HSA (Alexa Fluor 633) high, which is consistent with internalization of the DNP-HSA (Fig 7, C). After Alexa Fluor 633–labeled DNP-HSA challenge with or without desensitization, Alexa Fluor 633 levels remained high in the PMCs, but IgE (FITC) levels on the cell surface were reduced (Fig 7, C). We tried to investigate the localization of Alexa Fluor 633–labeled DNP-HSA by using confocal microscopy, but the signal from the Alexa Fluor 633–labeled DNP-HSA that was used in our desensitization step (0.78 → 50 ng/mL) was too weak to be efficiently detected by using confocal microscopy (data not shown). By measuring β-hexosaminidase release, we confirmed that degranulation was induced by a single challenge with Alexa Fluor 633–labeled DNP-HSA, but the target dose was not able to induce mediator release after desensitization with Alexa Fluor 633–labeled DNP-HSA (Fig 7, D).
FIG 7.
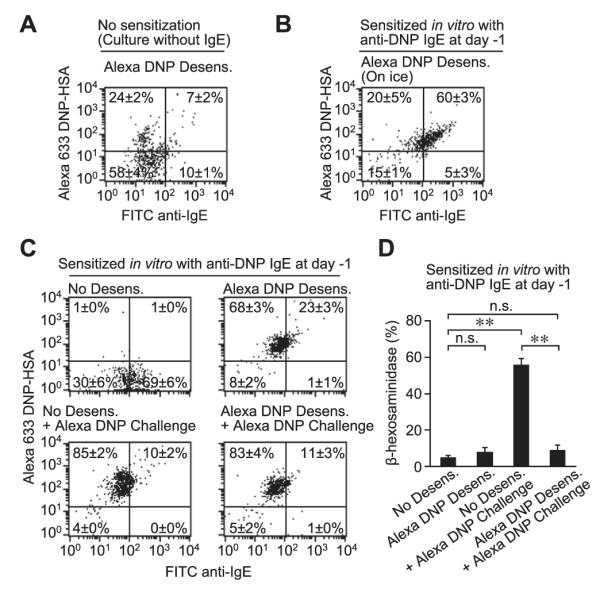
Internalization of antigen during rapid desensitization. Primary isolated PMCs were sensitized without (A) or with (B-D) anti-DNP IgE. The PMCs were desensitized (0.78 → 50 ng/mL) and challenged (100 ng/mL) with Alexa Fluor 633–labeled DNP-HSA at 37°C (Fig 7, A, C, and D) or on ice (Fig 7, B) by using the protocol in Fig E3. Fig 7, A through C, Representative dot plots showing staining for cell-surface IgE (detected by using FITC anti-IgE) and Alexa Fluor 633–labeled DNP-HSA. Fig 7, D, β-Hexosaminidase release from cells stimulated as in Fig 7, C. Fig 7, A-D, Four samples per group from 2 independent experiments, each using PMCs pooled from 3 to 5 mice; the average percentage of cells in each quadrant in shown. **P < .01 and n.s. (not significant, P > .05).
To test whether IgE internalization can be induced in an antigen-specific manner, cell-surface anti-DNP IgE was detected by staining with Alexa Fluor 633–labeled DNP-HSA on ice. PMCs were sensitized with both anti-DNP and anti-OVA IgE and then desensitized/challenged with DNP-HSA (see Fig E9, A, in this article’s Online Repository at www.jacionline.org) or OVA (see Fig E9, B). In PMCs that were not desensitized (No Desens. group), both total IgE (detected by staining with FITC anti-IgE antibody) and anti-DNP IgE (detected by staining with Alexa Fluor 633–labeled DNP-HSA) levels on the cell surface were high. After DNP-HSA desensitization (DNP Desens. group), total IgE (FITC) and anti-DNP IgE (Alexa 633) levels on the cell surface were reduced (see Fig E9, A). Conversely, OVA desensitization (OVA Desens. group) resulted in reductions in total IgE (FITC) levels on the cell surface, but anti-DNP IgE (Alexa Fluor 633) levels remained high (see Fig E9, B). These findings indicate that anti-DNP IgE molecules are not internalized by means of rapid desensitization with OVA, suggesting that IgE internalization occurs in an antigen-dependent manner. Moreover, after OVA challenge with or without OVA desensitization, anti-DNP IgE (Alexa Fluor 633) levels remained high on the PMC surface (see Fig E9, B).
DISCUSSION
We developed a rapid desensitization protocol in which intravenous administration of sequentially increasing doses of antigen (DNP-HSA or OVA) to mice sensitized with antigen-specific IgE can prevent antigen-induced PSA in vivo (Fig 1). Both MCs and basophils express the high-affinity IgE receptor FcεRI, and previous studies have shown that both cell types can be desensitized in vitro.13-17 However, our finding that antigen-induced hypothermia was not observed in IgE-sensitized MC-deficient C57BL/6-KitW-sh/W-sh mice (Fig 1, A and C), which have increased levels of blood basophils,26 together with recent publications showing that basophil depletion in mice (using antibodies27 or genetically engineered animals28) had no effect on antigen-induced hypothermia during PSA, suggest that MCs are the major effector cells targeted in our rapid desensitization protocol in vivo. Using our model, we showed (1) that rapid desensitization occurs in an antigen-specific manner (Fig 1) and (2) that this process is associated with a reduction in the number of IgE molecules on the MC surface (Fig 3). Our in vivo findings thus support the longstanding hypothesis that internalization of IgE molecules on FcεRI-bearing effector cells (ie, MCs in this model) is a key mechanism in rapid desensitization.16,19,20 We predict that basophils are also subject to antigen-specific desensitization by this mechanism in vivo, and it would be interesting to evaluate this in models in which basophils have a measurable role.
We also developed a rapid desensitization protocol similar to one reported by Sancho-Serra et al18 for the desensitization of mouse BMCMCs in the presence of calcium in vitro, which we used to investigate the desensitization of mouse PMCs in vitro. In support of our in vivo results (Fig 1), we found that rapid desensitization of PMCs can occur in an antigen-specific manner in vitro (Fig 2), a finding also reported by Sancho-Serra et al.18 In our model rapid desensitization of PMCs with sequentially increasing doses of antigen was associated with the internalization of antigen-specific IgE molecules from the MC surface in vitro (Figs 4-7), as we observed in vivo (Fig 3). In contrast, Sancho-Serra et al reported that IgE internalization was impaired in desensitized BMCMCs. Moreover, although Morales et al24 did not detect desensitization in BMCMCs from STAT6 knockout mice, we achieved successful desensitization of PMCs from STAT6 knockout mice in vitro using our desensitization protocol (see Fig E10 in this article’s Online Repository at www.jacionline.org).
One possible explanation for these differences might be heterogeneity in the MC populations analyzed. In vitro–derived BMCMCs from BALB/c mice were used in the study by Sancho-Serra et al,18 whereas primary isolated PMCs from C57BL/6 mice were used in ours. BMCMCs are relatively immature MCs that are phenotypically different from mature MC populations in vivo, such as PMCs.1,4 Moreover, FcεRI is not occupied with IgE on in vitro–derived BMCMCs (unless these cells are sensitized with exogenous IgE), whereas purified PMCs bear endogenous IgE on their surface, and this could influence some of the results obtained by using the different MC populations. For example, it has been reported that the mode of desensitization depends on the number of IgE molecules on the effector cells.13,14 It is unlikely that the differences in our studies are due to strain differences (C57BL/6 vs BALB/c) because, similar to our results obtained with C57BL/6 PMCs (Fig 4, C), BALB/c PMCs that were desensitized by using our protocol had significantly reduced surface IgE levels (see Fig E11, A, in this article’s Online Repository at www.jacionline.org), and challenge of these desensitized PMCs did not induce degranulation (see Fig E11, B) in vitro.
Second, the 2 groups used different IgEs. Anti-DNP IgE clone SPE-7 (0.25 μg/mL) was used in the reports by Sancho-Serra et al18 and Morales et al,24 whereas anti-DNP IgE clone ε-26 and anti-OVA IgE clone E-C1 were used in ours. It has been reported that the SPE-7 IgE antibody can adopt different antigen binding site conformations in the absence of DNP-HSA,29 it can exist as dimers or polymers in antibody preparations,30 and it can induce FcεRI internalization in BMCMCs in the absence of known antigen.25 SPE-7 can induce several effects in MCs in the absence of DNP-HSA: an increase in filamentous actin content,31 membrane ruffling,32 and adhesion to fibronectin.33 The differences we observed in FcεRI up-regulation (Fig 5, A), antigen-induced β-hexosaminidase release (Fig 5, B), and IgE internalization after antigen stimulation and/or rapid desensitization (Fig 5, C) when PMCs were treated or sensitized with anti-DNP clone SPE-7 versus ε-26 likely reflect the ability of SPE-7 to induce FcεRI internalization in the absence of known antigen. Although we detected some IgE internalization, as well as reduced antigen-induced degranulation, after desensitization of SPE-7–sensitized PMCs in vitro (Fig 5, C), the differences were much less pronounced than those observed when using anti-DNP clone ε-26. Thus we suggest that studies of antigen-induced IgE internalization in mouse MCs ideally should be performed with IgE antibodies other than or in addition to SPE-7.
Other results in our study are similar to those obtained by Sancho-Serra et al.18 For example, hyporesponsiveness to challenge with a target dose of anti-IgE antibody after desensitization with DNP-HSA (eg, Fig 2, P) was observed in both studies. Shalit and Levi-Schaffer19 also reported similar results in 1995 and speculated that the hyporesponsiveness to anti-IgE antibody after rapid desensitization with antigen was due to internalization of IgE molecules from the cell surface.16,19 We and Shalit and Levi-Schaffer19 concluded that IgE molecules are internalized after desensitization with antigen and that this might contribute to the mechanism of desensitization in our systems. By contrast, the studies by Sancho-Serra et al18 and Morales et al24 indicated that sufficient amounts of IgE remained on the BMCMC surface to permit anti-IgE–dependent activation.
Notably, in our system the internalization of IgE molecules (Fig 4, B, and see Fig E12 in this article’s Online Repository at www.jacionline.org) appears to be more sensitive to antigen stimulation than is MC degranulation (Fig 2, A, and see Fig E12). Given that this observation is consistent with findings indicating that some MC signaling responses can be induced at lower concentrations of antigen than are needed to provoke frank degranulation,34,35 it is possible that a suboptimal concentration of antigen-induced IgE internalization could serve as a platform to reduce the next level of antigen-induced response.
In summary, we demonstrate that in our mouse model of IgE-dependent PSA MCs are a key target cell of rapid antigen-dependent desensitization in vivo. Our in vivo and in vitro data with mouse MCs strongly support the long-standing hypothesis that antigen-specific internalization of IgE molecules from the surfaces of FcεRI-bearing effector cells is a key mechanism of rapid desensitization (see Fig E13 in this article’s Online Repository at www.jacionline.org).16,19,20 Rapid desensitization is used to prevent transiently severe IgE-mediated allergic reactions,6,7 and it has been used to protect subjects against accidental ingestion reactions during oral immunotherapy.36,37 Thus we hope that our in vivo and in vitro rapid desensitization protocols will represent useful tools for further mouse studies of this clinically relevant response.
METHODS
PSA reaction
Mice were sensitized (intravenously) with 100 μg/kg (Fig 1, A and B; Fig E1; Fig E2, A; and Fig E5) or 300 μg/kg (intraperitoneally, Figs 3 and E6) anti-DNP IgE (αDNP clone ε-26, generously provided by Dr Fu-Tong Liu, University of California–Davis), 100 μg/kg anti-OVA IgE (Chondrex, clone E-C1, intravenously; Fig 1, C and D, and Fig E2, B), or both 100 μg/kg anti-DNP and 100 μg/kg anti-OVA IgE (total 200 μg/kg IgE, intravenously; Fig 1, E and F). Sixteen to 24 hours later, mice were administered (intravenously) 70 μL of sterile, pyrogen-free, 0.9% NaCl (“saline”) with or without DNP-HSA (30-40 moles of DNP per mole of albumin; Sigma, St Louis, Mo) or OVA (Sigma) at various doses multiple times at 30-minute intervals after achievement of light anesthesia with isoflurane. Body temperature was measured with a rectal thermometer (Physitemp Instruments, Clifton, NJ) at 15-minute intervals (between or just before each injection of antigen). Serum was collected to measure mouse MCPT-1 concentrations (MCPT-1 ELISA kit; eBioscience, San Diego, Calif), peritoneal cells were collected by washing the peritoneal cavity with 10 mL of PBS (containing 0.1 mg/mL BSA) for flow cytometric or morphologic analysis, or both.
Measurement of PMC β-hexosaminidase release in vitro
Mouse PMCs were prepared as described previously.E1 Briefly, whole peritoneal cells were collected in RPMI (with 1 mg/mL BSA and 10 U/mL heparin; Gibco, Grand Island, NY) from mouse peritoneal cavities. The cells were mounted on 0.235 g/mL Histodenz (Sigma) and centrifuged at 400g for 15 minutes at room temperature. The cells at the bottom of the tube were collected. Eighty percent to 90% of the cells were PMCs, as determined by using toluidine blue metachromatic staining, as well as by using flow cytometry (c-Kit/IgE double positive, Fig E14). PMCs were sensitized with either 0.25 or 5 μg/mL anti-DNP IgE (clone ε-26; Fig 2, A-H and N-P; Fig 4, A-E; Fig 5; Fig 7; and Figs E7, E8, and E10-E12), 5 μg/mL anti-OVA IgE (Fig 2, I-K, and Fig 4, F), 5 μg/mL of both of these IgEs (total 10 μg/mL IgE; Fig 2, M, and Fig E9), 0.05 to 5 μg/mL anti-DNP IgE (clone SPE-7; Fig 5), or 5 μg/mL Alexa Fluor 633–labeled anti-DNP IgE (Fig 6) for 16 to 24 hours in Opti-MEM (with 10% FBS; Gibco). PMCs were washed once with Tyrode buffer (including 1.4 mmol/L Ca2+)E1 and then resuspended at 1 × 10⁶ cells/mL in 16 μL of Tyrode buffer and placed in individual 1.5-mL tubes in a 37°C hot water bath or on ice. PMCs were then treated without or with DNP-HSA, OVA, anti-IgE antibody (clone R35-75, BD Biosciences, San Jose, Calif; this is the same clone used to bind FcεRI-bound IgE in our flow cytometric experiments [Figs 4-7], and it has been used by others to cross-link FcεRI-bound IgE and activate β-hexosaminidase release from BMCMCsE2), or Alexa Fluor 633–labeled DNP-HSA (in 2 μL of Tyrode buffer) at 10-minute intervals. Details regarding antigen concentrations used at each step are shown in Fig E3. The reactions were stopped on ice 10 minutes after the last treatment, and β-hexosaminidase levels in the supernatants was measured, as described previously.E1 In some experiments PGD2 (PGD2 EIA kit; Cayman Chemical, Ann Arbor, Mich) or histamine (histamine EIA kit; Beckman Coulter, Fullerton, Calif) concentrations in the supernatants were also measured. Cell pellets were collected to measure remaining β-hexosaminidase (0.5% Triton-X100 treatment) levels, assess cell-surface molecules by using flow cytometry, and/or for histologic analysis.
Morphologic analysis
Cells were resuspended in PBS containing 50% FBS (5 × 10⁴ cells per slide). Cytospin preparations were prepared (Cytospin3; Shandon, Thermo Fisher Scientific, Uppsala, Sweden) and then stained with Giemsa (Sigma). The extent of MC degranulation in the peritoneal cavity was quantified, as described previously.E3 Briefly, MCs were classified by using histomorphometry (×1000 magnification) as extensively degranulated (>50% of cytoplasmic granules exhibiting staining alterations, fusion, and/or exteriorization), moderately degranulated (10% to 50% of granules affected), or not degranulated (<10% granules affected).E3 Sections were assessed in a blinded manner.
Alexa Fluor 633 labeling
DNP-HSA or anti-DNP IgE was labeled with Alexa Fluor 633 by using the Alexa Fluor 633 labeling kit (Molecular Probes, Eugene, Ore). After labeling, the concentration of Alexa Fluor 633–labeled DNP-HSA or anti-DNP IgE was measured with the DC protein assay kit (Bio-Rad Laboratories, Hercules, Calif), with DNP-HSA or anti-DNP IgE as standards, respectively.
Flow cytometry
Cells were resuspended (3 × 10⁵ cells/mL) in FACS buffer (PBS containing 1 mg/mL BSA and 1 mmol/L EDTA) and incubated for 10 minutes on ice with 5 mg/mL anti-mouse CD16/32 mAb (BioLegend, San Diego, Calif) to block Fcγ receptors (ie, nonspecific binding). Cells were then stained with 2.5 μg/mL FITC anti-mouse IgE (clone R35-75, BD Biosciences), 1 μg/mL APC-eFluor 780 anti-mouse CD117 (c-Kit, clone 2B8, eBioscience), or 100 ng/mL Alexa Fluor 633–labeled DNP-HSA for 45 minutes on ice and analyzed on a FACSCalibur flow cytometer (BD Biosciences). In the experiments using whole peritoneal cells (Fig 3, B, and Fig E5), we analyzed all cells without gating. In the experiments using purified (by using Histodenz density gradient) and cultured (with or without IgE for 16-24 hours) PMCs (Figs 4-7, E7, and E9-E12), cells were gated based on forward scatter/side scatter (gate 1 in Fig E14, A) to exclude non-MCs (gate 2 in Fig E14, B). In preliminary experiments we confirmed that the cells in gate 1 (Fig E14, A) were c-Kit/IgE double-positive MCs (Fig E14, B) and that greater than 99% of whole perito-neal cells or isolated PMCs were viable (ie, propidium iodide negative; data not shown). Data were analyzed with FlowJo software (TreeStar, Ashland, Ore). Geometric means were computed to derive the MFI of staining.
Confocal microscopy
Cells were sensitized with 5 μg/mL Alexa Fluor 633–labeled anti-DNP IgE (Fig 6, D, and Fig E8) for 16 to 24 hours in Opti-MEM and then desensitized/challenged with DNP-HSA. Cells were resuspended (3 × 10⁵ cells/mL) in PBS (containing 1 mg/mL BSA) and incubated for 10 minutes on ice with 5 μg/mL anti-mouse CD16/32 mAb to block Fcγ receptors and then stained with 2.5 μg/mL FITC anti-mouse IgE for 45 minutes on ice. Cells were washed and resuspended in cold PBS. Cells were transferred onto poly-D-ly-sine–coated cover glass bottom dishes (FluoroDish; World Precision Instruments, Sarasota, Fla) for 30 minutes on ice and then fixed with 5% paraformaldehyde in PBS for 10 minutes on ice. After 1 wash with PBS, cells were mounted with Mowiol (Sigma) aqueous mounting medium with 2% n-propyl gallate (Sigma). Cells were imaged at room temperature with the 63×/1.4 NA oil-immersion objective of a TCS SP5 confocal system (Leica, Wetzlar, Germany) and processed with Leica LAS software version 1.5.1, build 869. Single-channel images were exported to Adobe Photoshop (Adobe Systems, San Jose, Calif), in which whole image colors were balanced and images were cropped and overlaid. Line profiles of images to represent fluorescence intensity at various points across the cell were analyzed by using the measurement module BZ-H1ME (KEYENCE, Tokyo, Japan).
Supplementary Material
FIG E1. Rapid desensitization can prevent PSA reactions in vivo if mice are challenged with the target dose of antigen 1 or 3 days after the last desensitization dose. A and B, Mice were sensitized (intravenously) with 100 μg/kg anti-DNP IgE. Body temperature was measured at the indicated time points after injection (intravenously) with sequentially increasing amounts of DNP-HSA (Desensitization). Body temperature was measured at the indicated time points after injection (intravenously) with a target dose of DNP-HSA (Challenge) injected 1 (Fig E1, A) or 3 (Fig E1, B) days after the last desensitization dose. N = 4 to 8 mice per group from 2 to 3 independent experiments. **P < .01 and n.s. (not significant, P > .05). Body temperatures at 15 minutes after 1.5 mg/kg DNP-HSA challenge were compared by using 1-way ANOVA, followed by the Bonferroni test. i.v., Intravenously.
FIG E2. Evidence that exposure to appropriate, gradually increasing doses of antigen are needed to effectively desensitize mice to a target dose of antigen in vivo. Mice were sensitized (intravenously) with 100 μg/kg anti-DNP (A) or 100 μg/kg anti-OVA (B) IgE. The next day, body temperature was measured at the indicated time points after injection (intravenous) with the indicated concentrations of DNP-HSA (Fig E2, A) or OVA (Fig E2, B). N = 2 to 4 mice per group from 1 to 2 independent experiments. *P < .05. Body temperatures at 45 minutes were compared by using the unpaired Student t test. i.v., Intravenously.
FIG E3. Details of in vitro experimental protocols. A, Example of the protocol for analyzing the desensitization, followed in some experiments by challenge, of mouse peritoneal mast cells (PMCs) in vitro. Samples of PMCs in Tyrode’s buffer received sequentially, at the times indicated in the Figure, small volumes (“Additional solutions”) of either Tyrode’s buffer (as a control) or Tyrode’s buffer containing antigen (DNP-HSA) (or, in other experiments shown in Fig E3, B or C, Alexa 633-labeled DNP-HSA, ovalbumin [OVA] or anti-IgE [α-IgE]). This yielded samples (“Sample solutions”) of PMCs in Tyrode’s buffer containing the final amounts and concentrations of antigen or α-IgE shown in yellow. B and C, Details of the in vitro experimental protocols used in various Figures.
FIG E4. Evidence that exposure to appropriate, gradually increasing doses of antigen are needed to effectively desensitize mice to a target dose of antigen in vitro. Purified PMCs were sensitized with 5 μg/mL anti-DNP IgE and challenged in a 2-step protocol (without washing between) with the indicated concentrations of DNP-HSA. Percentage of β-hexosaminidase release was measured after 20 minutes. N = 4 per group. **P < .01 and n.s. (not significant, P > .05).
FIG E5. Intravenous injection of anti-DNP IgE (100 μg/kg) does not efficiently sensitize PMCs in vivo. A, Representative dot plots of surface IgE levels and c-Kit expression on peritoneal cells isolated from individual naive (No sensitization) or anti-DNP IgE–sensitized mice. Nine mice, each of which produced similar results, were tested for each group. The average percentage of cells in each quadrant from 9 individual mice is shown in red. B, MFI of cell-surface IgE molecules in c-Kit+ PMCs in Fig E5, A. Data were normalized by using MFI from naive mice as 100%; to test for statistical significance, values were compared with a hypothetical value of 100% by using the 1-sample t test. C, Extent of PMC degranulation (percentage of MCs exhibiting extensive [>50% of granules in that cell exhibiting evidence of degranulation], moderate [10% to 50% of granules affected], or no [none; <10% granules affected] degranulation was quantified by using Giemsa-stained slides); comparisons between the indicated experimental conditions were tested for statistical significance by using the χ2 test. *P < .05 and n.s. (not significant, P > .05). i.v., Intravenously.
FIG E6. Pilot experiment testing responses to various doses of antigen challenge in sensitized mice. Mice were sensitized (intraperitoneally) with 300 μg/kg anti-DNP IgE. The next day, body temperature was measured after a single challenge (intravenously) with DNP-HSA. N = 1 to 2 mice per group from 1 experiment. i.p., Intraperitoneally; i.v., intravenously.
FIG E7. IgE sensitization blocks binding of anti-FcεRIα antibody (clone MAR-1) to FcεRIα. PMCs were cultured without (left) or with (right) 5 μg/mL anti-DNP IgE for 16 to 24 hours and then stained with FITC anti-IgE antibody and Alexa Fluor 647 anti-FcεRIα antibody. Representative dot plots of surface IgE and FcεRIα levels are shown. The average percentage of cells in each quadrant is shown; averages were calculated from 6 samples per group from 2 independent experiments, each using PMCs pooled from 3 to 5 mice.
FIG E8. A and B, Confocal microscopic images of IgE internalization during rapid desensitization shown in color (Fig E8, A) or black and white (Fig E8, B; for easier visualization of signal). Primary isolated PMCs were sensitized with 5 μg/mL Alexa Fluor 633–labeled anti-DNP IgE and then desensitized with 0.78 → 50 ng/mL DNP-HSA. Representative confocal images showing staining for cell-surface IgE (detected by using FITC anti-IgE) and Alexa Fluor 633–labeled anti-DNP IgE; FITC (left panels) and Alexa Fluor 633 (right panels) signals are shown in separate panels to facilitate visualization of each fluorophore. Four images per group from 2 independent experiments, each using PMCs pooled from 3 to 5 mice, were examined; one representative image is shown in each panel. C, Line profiles of fluorescence intensity, depicting the intensity of fluorescence measured at various points along the cell transects shown in Fig E8, A.
FIG E9. Internalization of antigen-specific IgE during rapid desensitization. Primary isolated PMCs were sensitized with both anti-DNP and anti-OVA IgE and then desensitized (0.78 → 50 ng/mL DNP-HSA [A] or 125 → 8,000 ng/mL OVA [B]) and challenged (100 ng/mL DNP-HSA [Fig E9, A] or 16,000 ng/mL OVA [Fig E9, B]) by using the protocol in Fig E3. After desensitization/challenge, the PMCs were stained with FITC anti-IgE antibody and Alexa Fluor 633–labeled DNP-HSA on ice. Representative dot plots show total IgE (FITC) and anti-DNP IgE (Alexa Fluor 633) levels on the cell surface. N = 6 per group from 3 independently isolated populations of PMCs (each pooled from 3-5 mice).
FIG E10. Rapid desensitization of STAT6 knockout PMCs in vitro. Primary isolated PMCs from C57BL/6 wild-type (WT) control mice and STAT6 knockout (KO) mice were sensitized with 5 μg/mL anti-DNP IgE and treated the next day with DNP-HSA by using the desensitization protocol shown in Fig 2 and Fig E3. A, MFI of cell-surface IgE normalized by using the MFI from WT unstimulated PMCs (gray bar) as 100%; values were compared with a hypothetical value of 100% by using the 1-sample t test to test for statistical significance. B, β-Hexosaminidase release. Fig E10, A and B, N = 6 samples per group from 2 independent experiments, each using PMCs pooled from 3 to 5 mice. **P < .01 and n.s. (not significant, P > .05).
FIG E11. Rapid desensitization of BALB/c PMCs in vitro. Primary isolated PMCs from BALB/c mice were sensitized with 5 μg/mL anti-DNP IgE and treated the next day with DNP-HSA by using the desensitization protocol shown in Fig 2 and E3. A, The MFI of cell-surface IgE normalized by using the MFI from wild-type unstimulated PMCs (gray bar) as 100%; values were compared with a hypothetical value of 100% by using the 1-sample t test to test for statistical significance. B, β-Hexosaminidase release. N = 6 samples per group from 2 independent experiments, each using PMCs pooled from 3 to 5 mice. **P < .01 and n.s. (not significant, P > .05).
FIG E12. Susceptibility of PMCs to antigen-induced degranulation and IgE internalization. Purified PMCs were sensitized with 5 μg/mL anti-DNP IgE and then challenged with a single dose of DNP-HSA (0, 1.6, 6.3, 25, or 100 ng/mL). Percentage β-hexosaminidase release (from Fig 2, A) and cell-surface IgE levels (from Fig 4, B) are plotted on the same graph.
FIG E13. Our hypothesized mechanism of rapid desensitization of MCs. A, An optimal concentration of antigen A can activate MCs sensitized with anti–antigen A IgE. B, Sequentially increasing the concentration of antigen A reduces anti–antigen A IgE levels on the MC surface (through internalization of anti-antigen A IgE bound to antigen A). C, Rapid desensitization is associated with substantial internalization of IgE from the MC surface in an antigen-specific manner. Accordingly, in a subject sensitized to both antigen A and antigen B, antigen B can still activate MCs that have been desensitized to antigen A.
FIG E14. Flow cytometric PMC gating. For flow cytometric analysis of PMCs (Figs 4-7, E7, and E9-E12), samples were gated as shown in (A) (gate 1 in forward/side scatter plots) to select c-Kit and IgE double-positive PMCs. B, Greater than 99% of the cells in gate 1 (from Fig E14, A) are c-Kit+ PMCs.
Key messages.
The MC is an important target cell of rapid desensitization in a mouse model of antigen- and IgE-dependent systemic anaphylaxis in vivo.
Antigen-specific rapid desensitization in mouse MCs in vivo or in vitro is associated with substantial internalization of antigen-specific IgE from the MC surface.
Acknowledgments
We thank Joseph D. Hernandez for helpful discussions and critical reading of the manuscript.
Supported by grants from the National Institutes of Health (AI070813, AI023990, and CA072074; to S.J.G.).
T. Oka has been supported by one or more grants from the National Institutes of Health (NIH; AI070813, AI023990, and CA072074) and is employed by Daiichi-Sankyo Co, Ltd. M. Tsai and S. J. Galli have been supported by one or more grants from the NIH (AI070813, AI023990, and AI072074). J. Kalesnikoff has been supported by one or more grants from the NIH, is employed by Stanford University, and has received one or more payments for lecturing from or is on the speakers’ bureau for UC Berkeley Extension.
Abbreviations used
- BMCMC
Bone marrow–derived cultured mast cell
- DNP
2,4-Dinitrophenyl
- FITC
Fluorescein isothiocyanate
- HSA
Human serum albumin
- MC
Mast cell
- MCPT-1
Mast cell protease 1
- MFI
Mean fluorescence intensity
- OVA
Ovalbumin
- PGD2
Prostaglandin D2
- PMC
Peritoneal mast cell
- PSA
Passive systemic anaphylaxis
- STAT6
Signal transducer and activator of transcription 6
Footnotes
Disclosure of potential conflict of interest: E. J. Rios declares no relevant conflicts of interest.
REFERENCES
- 1.Metcalfe DD, Baram D, Mekori YA. Mast cells. Physiol Rev. 1997;77:1033–79. doi: 10.1152/physrev.1997.77.4.1033. [DOI] [PubMed] [Google Scholar]
- 2.Turner H, Kinet JP. Signalling through the high-affinity IgE receptor Fc epsilonRI. Nature. 1999;402:B24–30. doi: 10.1038/35037021. [DOI] [PubMed] [Google Scholar]
- 3.Rivera J, Gilfillan AM. Molecular regulation of mast cell activation. J Allergy Clin Immunol. 2006;117:1214–26. doi: 10.1016/j.jaci.2006.04.015. [DOI] [PubMed] [Google Scholar]
- 4.Galli SJ, Tsai M. IgE and mast cells in allergic disease. Nat Med. 2012;18:693–704. doi: 10.1038/nm.2755. [DOI] [PMC free article] [PubMed] [Google Scholar]
- 5.Ring J, Grosber M, Mohrenschlager M, Brockow K. Anaphylaxis: acute treatment and management. Chem Immunol Allergy. 2010;95:201–10. doi: 10.1159/000315953. [DOI] [PubMed] [Google Scholar]
- 6.Castells MC, Tennant NM, Sloane DE, Hsu FI, Barrett NA, Hong DI, et al. Hyper-sensitivity reactions to chemotherapy: outcomes and safety of rapid desensitization in 413 cases. J Allergy Clin Immunol. 2008;122:574–80. doi: 10.1016/j.jaci.2008.02.044. [DOI] [PubMed] [Google Scholar]
- 7.Cernadas JR, Brockow K, Romano A, Aberer W, Torres MJ, Bircher A, et al. General considerations on rapid desensitization for drug hypersensitivity—a consensus statement. Allergy. 2010;65:1357–66. doi: 10.1111/j.1398-9995.2010.02441.x. [DOI] [PubMed] [Google Scholar]
- 8.Akdis CA. Therapies for allergic inflammation: refining strategies to induce tolerance. Nat Med. 2012;18:736–49. doi: 10.1038/nm.2754. [DOI] [PubMed] [Google Scholar]
- 9.Castells M, Sancho-Serra MC, Simarro M. Hypersensitivity to antineoplastic agents: mechanisms and treatment with rapid desensitization. Cancer Immunol Immunother. 2012;61:1575–84. doi: 10.1007/s00262-012-1273-x. [DOI] [PMC free article] [PubMed] [Google Scholar]
- 10.Eberlein-Konig B, Ullmann S, Thomas P, Przybilla B. Tryptase and histamine release due to a sting challenge in bee venom allergic patients treated successfully or unsuccessfully with hyposensitization. Clin Exp Allergy. 1995;25:704–12. doi: 10.1111/j.1365-2222.1995.tb00007.x. [DOI] [PubMed] [Google Scholar]
- 11.Plewako H, Wosinska K, Arvidsson M, Bjorkander J, Skov PS, Hakansson L, et al. Basophil interleukin 4 and interleukin 13 production is suppressed during the early phase of rush immunotherapy. Int Arch Allergy Immunol. 2006;141:346–53. doi: 10.1159/000095461. [DOI] [PubMed] [Google Scholar]
- 12.Romano A, Torres MJ, Castells M, Sanz ML, Blanca M. Diagnosis and management of drug hypersensitivity reactions. J Allergy Clin Immunol. 2011;127(suppl):S67–73. doi: 10.1016/j.jaci.2010.11.047. [DOI] [PubMed] [Google Scholar]
- 13.Sobotka AK, Dembo M, Goldstein B, Lichtenstein LM. Antigen-specific desensitization of human basophils. J Immunol. 1979;122:511–7. [PubMed] [Google Scholar]
- 14.MacGlashan DW, Jr, Lichtenstein LM. The transition from specific to nonspecific desensitization in human basophils. J Immunol. 1981;127:2410–4. [PubMed] [Google Scholar]
- 15.Ishizaka T, Sterk AR, Daeron M, Becker EL, Ishizaka K. Biochemical analysis of desensitization of mouse mast cells. J Immunol. 1985;135:492–501. [PubMed] [Google Scholar]
- 16.Shalit M, Pickholz D, Levi-Shaffer F. Mast cells retain their responsiveness upon continuous and repetitive exposure to antigen. Immunology. 1993;79:319–24. [PMC free article] [PubMed] [Google Scholar]
- 17.MacGlashan D, Jr, Miura K, Lavens-Phillips S. Pharmacology of IgE-mediated desensitization of human basophils: effects of protein kinase C and src-family kinase inhibitors. Biochem Pharmacol. 2000;60:1717–27. doi: 10.1016/s0006-2952(00)00490-1. [DOI] [PubMed] [Google Scholar]
- 18.Sancho-Serra MC, Simarro M, Castells M. Rapid IgE desensitization is antigen specific and impairs early and late mast cell responses targeting FcepsilonRI internalization. Eur J Immunol. 2011;41:1004–13. doi: 10.1002/eji.201040810. [DOI] [PubMed] [Google Scholar]
- 19.Shalit M, Levi-Schaffer F. Challenge of mast cells with increasing amounts of antigen induces desensitization. Clin Exp Allergy. 1995;25:896–902. doi: 10.1111/j.1365-2222.1995.tb00033.x. [DOI] [PubMed] [Google Scholar]
- 20.MacGlashan D., Jr Subthreshold desensitization of human basophils re-capitulates the loss of Syk and FcepsilonRI expression characterized by other methods of desensitization. Clin Exp Allergy. 2012;42:1060–70. doi: 10.1111/j.1365-2222.2012.04013.x. [DOI] [PMC free article] [PubMed] [Google Scholar]
- 21.Oka T, Kalesnikoff J, Starkl P, Tsai M, Galli SJ. Evidence questioning cromolyn’s effectiveness and selectivity as a ‘mast cell stabilizer’ in mice. Lab Invest. 2012;92:1472–82. doi: 10.1038/labinvest.2012.116. [DOI] [PMC free article] [PubMed] [Google Scholar]
- 22.Reber LL, Marichal T, Galli SJ. New models for analyzing mast cell functions in vivo. Trends Immunol. 2012;33:613–25. doi: 10.1016/j.it.2012.09.008. [DOI] [PMC free article] [PubMed] [Google Scholar]
- 23.Kalesnikoff J, Rios EJ, Chen CC, Alejandro Barbieri M, Tsai M, Tam SY, et al. Roles of RabGEF1/Rabex-5 domains in regulating FcepsilonRI surface expression and FcepsilonRI-dependent responses in mast cells. Blood. 2007;109:5308–17. doi: 10.1182/blood-2007-01-067363. [DOI] [PMC free article] [PubMed] [Google Scholar]
- 24.Morales AR, Shah N, Castells M. Antigen-IgE desensitization in signal transducer and activator of transcription 6-deficient mast cells by suboptimal doses of antigen. Ann Allergy Asthma Immunol. 2005;94:575–80. doi: 10.1016/S1081-1206(10)61136-2. [DOI] [PubMed] [Google Scholar]
- 25.Kitaura J, Song J, Tsai M, Asai K, Maeda-Yamamoto M, Mocsai A, et al. Evidence that IgE molecules mediate a spectrum of effects on mast cell survival and activation via aggregation of the FcepsilonRI. Proc Natl Acad Sci U S A. 2003;100:12911–6. doi: 10.1073/pnas.1735525100. [DOI] [PMC free article] [PubMed] [Google Scholar]
- 26.Piliponsky AM, Chen CC, Grimbaldeston MA, Burns-Guydish SM, Hardy J, Kalesnikoff J, et al. Mast cell-derived TNF can exacerbate mortality during severe bacterial infections in C57BL/6-KitW-sh/W-sh mice. Am J Pathol. 2010;176:926–38. doi: 10.2353/ajpath.2010.090342. [DOI] [PMC free article] [PubMed] [Google Scholar]
- 27.Tsujimura Y, Obata K, Mukai K, Shindou H, Yoshida M, Nishikado H, et al. Basophils play a pivotal role in immunoglobulin-G-mediated but not immunoglobulin-E-mediated systemic anaphylaxis. Immunity. 2008;28:581–9. doi: 10.1016/j.immuni.2008.02.008. [DOI] [PubMed] [Google Scholar]
- 28.Sawaguchi M, Tanaka S, Nakatani Y, Harada Y, Mukai K, Matsunaga Y, et al. Role of mast cells and basophils in IgE responses and in allergic airway hyperresponsiveness. J Immunol. 2012;188:1809–18. doi: 10.4049/jimmunol.1101746. [DOI] [PubMed] [Google Scholar]
- 29.James LC, Roversi P, Tawfik DS. Antibody multispecificity mediated by conformational diversity. Science. 2003;299:1362–7. doi: 10.1126/science.1079731. [DOI] [PubMed] [Google Scholar]
- 30.Kalesnikoff J, Huber M, Lam V, Damen JE, Zhang J, Siraganian RP, et al. Monomeric IgE stimulates signaling pathways in mast cells that lead to cytokine production and cell survival. Immunity. 2001;14:801–11. doi: 10.1016/s1074-7613(01)00159-5. [DOI] [PubMed] [Google Scholar]
- 31.Oka T, Hori M, Tanaka A, Matsuda H, Karaki H, Ozaki H. IgE alone-induced actin assembly modifies calcium signaling and degranulation in RBL-2H3 mast cells. Am J Physiol Cell Physiol. 2004;286:C256–63. doi: 10.1152/ajpcell.00197.2003. [DOI] [PubMed] [Google Scholar]
- 32.Pandey V, Mihara S, Fensome-Green A, Bolsover S, Cockcroft S. Monomeric IgE stimulates NFAT translocation into the nucleus, a rise in cytosol Ca2+, degranulation, and membrane ruffling in the cultured rat basophilic leukemia-2H3 mast cell line. J Immunol. 2004;172:4048–58. doi: 10.4049/jimmunol.172.7.4048. [DOI] [PubMed] [Google Scholar]
- 33.Lam V, Kalesnikoff J, Lee CW, Hernandez-Hansen V, Wilson BS, Oliver JM, et al. IgE alone stimulates mast cell adhesion to fibronectin via pathways similar to those used by IgE + antigen but distinct from those used by Steel factor. Blood. 2003;102:1405–13. doi: 10.1182/blood-2002-10-3176. [DOI] [PubMed] [Google Scholar]
- 34.Gonzalez-Espinosa C, Odom S, Olivera A, Hobson JP, Martinez ME, Oliveira-Dos-Santos A, et al. Preferential signaling and induction of allergy-promoting lymphokines upon weak stimulation of the high affinity IgE receptor on mast cells. J Exp Med. 2003;197:1453–65. doi: 10.1084/jem.20021806. [DOI] [PMC free article] [PubMed] [Google Scholar]
- 35.Kitaura J, Xiao W, Maeda-Yamamoto M, Kawakami Y, Lowell CA, Kawakami T. Early divergence of Fc epsilon receptor I signals for receptor up-regulation and internalization from degranulation, cytokine production, and survival. J Immunol. 2004;173:4317–23. doi: 10.4049/jimmunol.173.7.4317. [DOI] [PubMed] [Google Scholar]
- 36.Buchanan AD, Green TD, Jones SM, Scurlock AM, Christie L, Althage KA, et al. Egg oral immunotherapy in nonanaphylactic children with egg allergy. J Allergy Clin Immunol. 2007;119:199–205. doi: 10.1016/j.jaci.2006.09.016. [DOI] [PubMed] [Google Scholar]
- 37.Skripak JM, Wood RA. Peanut and tree nut allergy in childhood. Pediatr Allergy Immunol. 2008;19:368–73. doi: 10.1111/j.1399-3038.2008.00723.x. [DOI] [PubMed] [Google Scholar]
REFERENCES
- E1.Oka T, Kalesnikoff J, Starkl P, Tsai M, Galli SJ. Evidence questioning cromolyn’s effectiveness and selectivity as a ‘mast cell stabilizer’ in mice. Lab Invest. 2012;92:1472–82. doi: 10.1038/labinvest.2012.116. [DOI] [PMC free article] [PubMed] [Google Scholar]
- E2.Sancho-Serra MC, Simarro M, Castells M. Rapid IgE desensitization is antigen specific and impairs early and late mast cell responses targeting FcepsilonRI internalization. Eur J Immunol. 2011;41:1004–13. doi: 10.1002/eji.201040810. [DOI] [PubMed] [Google Scholar]
- E3.Metz M, Piliponsky AM, Chen CC, Lammel V, Abrink M, Pejler G, et al. Mast cells can enhance resistance to snake and honeybee venoms. Science. 2006;313:526–30. doi: 10.1126/science.1128877. [DOI] [PubMed] [Google Scholar]
Associated Data
This section collects any data citations, data availability statements, or supplementary materials included in this article.
Supplementary Materials
FIG E1. Rapid desensitization can prevent PSA reactions in vivo if mice are challenged with the target dose of antigen 1 or 3 days after the last desensitization dose. A and B, Mice were sensitized (intravenously) with 100 μg/kg anti-DNP IgE. Body temperature was measured at the indicated time points after injection (intravenously) with sequentially increasing amounts of DNP-HSA (Desensitization). Body temperature was measured at the indicated time points after injection (intravenously) with a target dose of DNP-HSA (Challenge) injected 1 (Fig E1, A) or 3 (Fig E1, B) days after the last desensitization dose. N = 4 to 8 mice per group from 2 to 3 independent experiments. **P < .01 and n.s. (not significant, P > .05). Body temperatures at 15 minutes after 1.5 mg/kg DNP-HSA challenge were compared by using 1-way ANOVA, followed by the Bonferroni test. i.v., Intravenously.
FIG E2. Evidence that exposure to appropriate, gradually increasing doses of antigen are needed to effectively desensitize mice to a target dose of antigen in vivo. Mice were sensitized (intravenously) with 100 μg/kg anti-DNP (A) or 100 μg/kg anti-OVA (B) IgE. The next day, body temperature was measured at the indicated time points after injection (intravenous) with the indicated concentrations of DNP-HSA (Fig E2, A) or OVA (Fig E2, B). N = 2 to 4 mice per group from 1 to 2 independent experiments. *P < .05. Body temperatures at 45 minutes were compared by using the unpaired Student t test. i.v., Intravenously.
FIG E3. Details of in vitro experimental protocols. A, Example of the protocol for analyzing the desensitization, followed in some experiments by challenge, of mouse peritoneal mast cells (PMCs) in vitro. Samples of PMCs in Tyrode’s buffer received sequentially, at the times indicated in the Figure, small volumes (“Additional solutions”) of either Tyrode’s buffer (as a control) or Tyrode’s buffer containing antigen (DNP-HSA) (or, in other experiments shown in Fig E3, B or C, Alexa 633-labeled DNP-HSA, ovalbumin [OVA] or anti-IgE [α-IgE]). This yielded samples (“Sample solutions”) of PMCs in Tyrode’s buffer containing the final amounts and concentrations of antigen or α-IgE shown in yellow. B and C, Details of the in vitro experimental protocols used in various Figures.
FIG E4. Evidence that exposure to appropriate, gradually increasing doses of antigen are needed to effectively desensitize mice to a target dose of antigen in vitro. Purified PMCs were sensitized with 5 μg/mL anti-DNP IgE and challenged in a 2-step protocol (without washing between) with the indicated concentrations of DNP-HSA. Percentage of β-hexosaminidase release was measured after 20 minutes. N = 4 per group. **P < .01 and n.s. (not significant, P > .05).
FIG E5. Intravenous injection of anti-DNP IgE (100 μg/kg) does not efficiently sensitize PMCs in vivo. A, Representative dot plots of surface IgE levels and c-Kit expression on peritoneal cells isolated from individual naive (No sensitization) or anti-DNP IgE–sensitized mice. Nine mice, each of which produced similar results, were tested for each group. The average percentage of cells in each quadrant from 9 individual mice is shown in red. B, MFI of cell-surface IgE molecules in c-Kit+ PMCs in Fig E5, A. Data were normalized by using MFI from naive mice as 100%; to test for statistical significance, values were compared with a hypothetical value of 100% by using the 1-sample t test. C, Extent of PMC degranulation (percentage of MCs exhibiting extensive [>50% of granules in that cell exhibiting evidence of degranulation], moderate [10% to 50% of granules affected], or no [none; <10% granules affected] degranulation was quantified by using Giemsa-stained slides); comparisons between the indicated experimental conditions were tested for statistical significance by using the χ2 test. *P < .05 and n.s. (not significant, P > .05). i.v., Intravenously.
FIG E6. Pilot experiment testing responses to various doses of antigen challenge in sensitized mice. Mice were sensitized (intraperitoneally) with 300 μg/kg anti-DNP IgE. The next day, body temperature was measured after a single challenge (intravenously) with DNP-HSA. N = 1 to 2 mice per group from 1 experiment. i.p., Intraperitoneally; i.v., intravenously.
FIG E7. IgE sensitization blocks binding of anti-FcεRIα antibody (clone MAR-1) to FcεRIα. PMCs were cultured without (left) or with (right) 5 μg/mL anti-DNP IgE for 16 to 24 hours and then stained with FITC anti-IgE antibody and Alexa Fluor 647 anti-FcεRIα antibody. Representative dot plots of surface IgE and FcεRIα levels are shown. The average percentage of cells in each quadrant is shown; averages were calculated from 6 samples per group from 2 independent experiments, each using PMCs pooled from 3 to 5 mice.
FIG E8. A and B, Confocal microscopic images of IgE internalization during rapid desensitization shown in color (Fig E8, A) or black and white (Fig E8, B; for easier visualization of signal). Primary isolated PMCs were sensitized with 5 μg/mL Alexa Fluor 633–labeled anti-DNP IgE and then desensitized with 0.78 → 50 ng/mL DNP-HSA. Representative confocal images showing staining for cell-surface IgE (detected by using FITC anti-IgE) and Alexa Fluor 633–labeled anti-DNP IgE; FITC (left panels) and Alexa Fluor 633 (right panels) signals are shown in separate panels to facilitate visualization of each fluorophore. Four images per group from 2 independent experiments, each using PMCs pooled from 3 to 5 mice, were examined; one representative image is shown in each panel. C, Line profiles of fluorescence intensity, depicting the intensity of fluorescence measured at various points along the cell transects shown in Fig E8, A.
FIG E9. Internalization of antigen-specific IgE during rapid desensitization. Primary isolated PMCs were sensitized with both anti-DNP and anti-OVA IgE and then desensitized (0.78 → 50 ng/mL DNP-HSA [A] or 125 → 8,000 ng/mL OVA [B]) and challenged (100 ng/mL DNP-HSA [Fig E9, A] or 16,000 ng/mL OVA [Fig E9, B]) by using the protocol in Fig E3. After desensitization/challenge, the PMCs were stained with FITC anti-IgE antibody and Alexa Fluor 633–labeled DNP-HSA on ice. Representative dot plots show total IgE (FITC) and anti-DNP IgE (Alexa Fluor 633) levels on the cell surface. N = 6 per group from 3 independently isolated populations of PMCs (each pooled from 3-5 mice).
FIG E10. Rapid desensitization of STAT6 knockout PMCs in vitro. Primary isolated PMCs from C57BL/6 wild-type (WT) control mice and STAT6 knockout (KO) mice were sensitized with 5 μg/mL anti-DNP IgE and treated the next day with DNP-HSA by using the desensitization protocol shown in Fig 2 and Fig E3. A, MFI of cell-surface IgE normalized by using the MFI from WT unstimulated PMCs (gray bar) as 100%; values were compared with a hypothetical value of 100% by using the 1-sample t test to test for statistical significance. B, β-Hexosaminidase release. Fig E10, A and B, N = 6 samples per group from 2 independent experiments, each using PMCs pooled from 3 to 5 mice. **P < .01 and n.s. (not significant, P > .05).
FIG E11. Rapid desensitization of BALB/c PMCs in vitro. Primary isolated PMCs from BALB/c mice were sensitized with 5 μg/mL anti-DNP IgE and treated the next day with DNP-HSA by using the desensitization protocol shown in Fig 2 and E3. A, The MFI of cell-surface IgE normalized by using the MFI from wild-type unstimulated PMCs (gray bar) as 100%; values were compared with a hypothetical value of 100% by using the 1-sample t test to test for statistical significance. B, β-Hexosaminidase release. N = 6 samples per group from 2 independent experiments, each using PMCs pooled from 3 to 5 mice. **P < .01 and n.s. (not significant, P > .05).
FIG E12. Susceptibility of PMCs to antigen-induced degranulation and IgE internalization. Purified PMCs were sensitized with 5 μg/mL anti-DNP IgE and then challenged with a single dose of DNP-HSA (0, 1.6, 6.3, 25, or 100 ng/mL). Percentage β-hexosaminidase release (from Fig 2, A) and cell-surface IgE levels (from Fig 4, B) are plotted on the same graph.
FIG E13. Our hypothesized mechanism of rapid desensitization of MCs. A, An optimal concentration of antigen A can activate MCs sensitized with anti–antigen A IgE. B, Sequentially increasing the concentration of antigen A reduces anti–antigen A IgE levels on the MC surface (through internalization of anti-antigen A IgE bound to antigen A). C, Rapid desensitization is associated with substantial internalization of IgE from the MC surface in an antigen-specific manner. Accordingly, in a subject sensitized to both antigen A and antigen B, antigen B can still activate MCs that have been desensitized to antigen A.
FIG E14. Flow cytometric PMC gating. For flow cytometric analysis of PMCs (Figs 4-7, E7, and E9-E12), samples were gated as shown in (A) (gate 1 in forward/side scatter plots) to select c-Kit and IgE double-positive PMCs. B, Greater than 99% of the cells in gate 1 (from Fig E14, A) are c-Kit+ PMCs.