Background: Effective involvement of VKORC1L1 in vitamin K epoxide reductase activity, target of vitamin K antagonists (VKAs), is still unclear.
Results: VKORC1L1 is not inhibited by VKAs and catalyzes VKOR activity in extrahepatic tissues.
Conclusion: During long term anticoagulation the limited unwanted side effects of VKAs are due to VKORC1L1.
Significance: Potential pharmaco-toxicologic effects of specific VKORC1L1 inhibitors should be assessed.
Keywords: Drug Resistance, Enzyme Inhibitors, Enzyme Kinetics, Hemostasis, Vitamin K, VKORC1, VKORC1L1, Vitamin K Antagonist, Vitamin K Epoxide Reductase
Abstract
Vitamin K is involved in the γ-carboxylation of the vitamin K-dependent proteins, and vitamin K epoxide is a by-product of this reaction. Due to the limited intake of vitamin K, its regeneration is necessary and involves vitamin K 2,3-epoxide reductase (VKOR) activity. This activity is known to be supported by VKORC1 protein, but recently a second gene, VKORC1L1, appears to be able to support this activity when the encoded protein is expressed in HEK293T cells. Nevertheless, this protein was described as being responsible for driving the vitamin K-mediated antioxidation pathways. In this paper we precisely analyzed the catalytic properties of VKORC1L1 when expressed in Pichia pastoris and more particularly its susceptibility to vitamin K antagonists. Vitamin K antagonists are also inhibitors of VKORC1L1, but this enzyme appears to be 50-fold more resistant to vitamin K antagonists than VKORC1. The expression of Vkorc1l1 mRNA was observed in all tissues assayed, i.e. in C57BL/6 wild type and VKORC1-deficient mouse liver, lung, and testis and rat liver, lung, brain, kidney, testis, and osteoblastic cells. The characterization of VKOR activity in extrahepatic tissues demonstrated that a part of the VKOR activity, more or less important according to the tissue, may be supported by VKORC1L1 enzyme especially in testis, lung, and osteoblasts. Therefore, the involvement of VKORC1L1 in VKOR activity partly explains the low susceptibility of some extrahepatic tissues to vitamin K antagonists and the lack of effects of vitamin K antagonists on the functionality of the vitamin K-dependent protein produced by extrahepatic tissues such as matrix Gla protein or osteocalcin.
Introduction
Vitamin K-dependent γ-glutamyl carboxylase (GGCX)2 converts glutamate to a carboxylated glutamate (Gla) of a limited number of protein called vitamin K-dependent proteins (VKDPs) (Fig. 1). These proteins correspond either to proteins involved in the coagulation process, coagulation factor II, VII, IX, and X and protein C, S, and Z synthesized in the liver or to proteins produced by extrahepatic tissues such as osteocalcin (OC) (1), matrix Gla protein (MGP) (2), periostin 1 (3), Gas6 protein (4), and Gla-rich protein (5).
FIGURE 1.
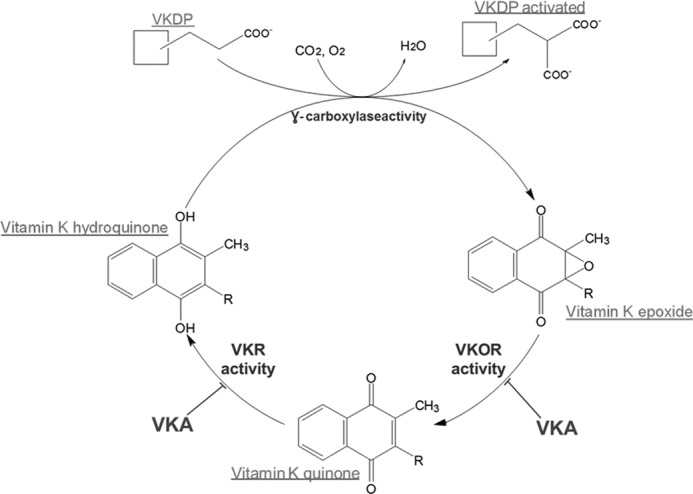
The vitamin K cycle.
The extent of the γ-carboxylation is crucial for these proteins. γ-Carboxylated MGP is a major inhibitor of vascular calcification whereas the undercarboxylated form is inactive (6). On the other hand, undercarboxylated OC appears to act as a hormone produced and secreted by the bone and targeting the pancreas to increase insulin production (7, 8) whereas carboxylated OC accumulates in the bone and binds strongly and selectively to hydroxyapatite in an association in which the γ-carboxyglutamyl side chains interact directly with the mineral surface.
Whereas GGCX produces Gla residues in the substrate protein, the co-substrate of GGCX, vitamin K hydroquinone (vit KH2), is oxygenated into vitamin K 2,3-epoxide (vit K>O) (9) (Fig. 1). Because the dietary intake of vitamin K (vit K) is limited, vit K>O must be recycled to vit KH2 before it can be reused. In this way, one molecule of vit K can assume approximately 500 carboxylation reactions (10). This reaction is catalyzed by the vitamin K epoxide reductase (VKOR) activity. This activity is inhibited in a noncompetitive manner by vitamin K antagonists (VKAs) (11) (Fig. 1). In 2004, two groups simultaneously described the gene VKORC1 (12, 13), which encodes the VKORC1 protein. The recombinant VKORC1 protein expressed either in HEK293T cells (12) or in baculovirus (14) or in Pichia pastoris (15, 16) effectively catalyzes the VKOR activity and is inhibited by VKAs.
In vivo, VKAs actively inhibit VKORC1 in the liver and thus limit the γ-carboxylation of hepatic VKDPs, resulting in an intense anticoagulant effect. Surprisingly, limited side effects such as arterial calcifications or modifications in energetic metabolism were observed in human (17, 18) although these VKAs are used extensively worldwide. The number of dispensed outpatient prescriptions for warfarin increased by 45%, from 21 million in 1998 to nearly 31 million in 2004 (19). Nevertheless, arterial calcifications were observed in human only after many years of VKA treatment (20, 21). In laboratory animals, ectopic calcifications were observed in mice ApoE−/− treated by warfarin (20). Similarly, OC depletion in bone was observed consecutively to the use of warfarin (22, 23). Nevertheless, the dose of warfarin used in both studies was completely disproportionate compared with the therapeutic dose used in human medicine. Indeed, the dose was, respectively, ∼60 mg/kg/day and ∼77 mg/kg/day whereas the human posology is 5 mg/human per day, which is about 0.1 mg/kg/day. In rats, a similar dosage, 0.08 mg/kg/day, is sufficient to obtain 50% mortality due to excessive bleeding if repeated for 90 days. As a consequence, extrahepatic tissues seem to present a low susceptibility to VKA compared with liver. Pharmacokinetics or limited entry in cells could be considered as an explanation of this phenomenon. A limited susceptibility of VKOR activity to VKAs could be another explanation.
Until 2011, VKORC1 protein was considered as the only protein supporting VKOR activity. Nevertheless, vertebrate genomes include two paralogous enzymes, VKORC1 and VKORC1-like 1 (VKORC1L1), likely resulting from a gene duplication of an early common VKOR ancestor. In 2011, Westhofen et al. demonstrated that the VKORC1L1 gene encodes a protein able to reduce vit K>O to vit K when VKORC1L1 is expressed in HEK293T cells (24). Nevertheless, this VKOR activity was described to present a low enzymatic efficiency. Westhofen et al. suggested that this enzyme preferably reduced vit K to vit KH2. Therefore, VKORC1L1 was proposed to be responsible for driving vitamin K-mediated intracellular antioxidation pathways critical to cell survival by generating vit KH2 (24), a potent biological antioxidant, without considering its involvement in the γ-carboxylation of VKDPs. The aim of this study was to determine whether VKORC1L1 may assume VKOR activity in extrahepatic tissues and thus rescue VKOR activity in the absence or inhibition of VKORC1 protein.
EXPERIMENTAL PROCEDURES
Animals
Male OFA Sprague-Dawley rats (9 weeks old) and male C57BL/6 mice were obtained from a commercial breeder (Charles River, L'arbresles, France) and acclimated for a minimal period of 5 days. Food and water were available ad libitum. VKORC1 knock-out male mice (25) were obtained from the Institute of Transfusion Medicine and Immunohematology (Frankfurt, Germany). Mice were maintained alive for 9 weeks by daily oral administration of vit K1. Depending on the weight of the mice, they received a dose between 50 mg/kg body weight (newborns) and 5 mg/kg body weight for the adult mice. Rats and mice were killed by decapitation. Liver, lung, kidney, brain, and testis were removed quickly and used immediately for RNA extraction.
Osteosarcoma Cell Culture
The rat osteosarcoma cell lines ROS 17/2.8 were a generous gift from Merck and were used between passages 4 and 8. Cells were grown in 75-cm2 culture plates (Falcon, VWR International, Strasbourg, France) with DMEM (Invitrogen) supplemented with 10% (v/v) heat-inactivated fetal bovine serum (Perbio Science, Brébières, France) and 100 units/ml penicillin/streptomycin (Invitrogen). The cultures were incubated at 37 °C in a humidified atmosphere of 95% air and 5% CO2. Cells were subcultured twice a week. When grown to confluence, cells were harvested and resuspended in RNAprotect Cell Reagent (Qiagen) for RNA extraction or in Hepes-glycerol buffer (50 mm Hepes, pH 7.4, containing 20% glycerol) for preparation of cell by sonication.
Total RNA Extraction and cDNA Synthesis
Total RNA was extracted from five different tissues (liver, testis, lung, brain, and kidney) first with TRIzol reagent (Invitrogen) and then by using the SV Total RNA Isolation System (Promega). For each tissue or cell culture, three separate RNA extractions were made. RNA concentration and purity were analyzed using a UV-160A spectrophotometer (Shimadzu, Roucaire, France), measuring spectral absorption at 260 and 280 nm. cDNA templates were synthesized from 100 ng of total RNA in a final volume of 20 μl containing 500 pmol of oligo(dT)18 and 200 units of Moloney murine leukemia virus reverse transcriptase (Invitrogen) according to the manufacturer's protocol.
Quantitative Real-time PCRs
Quantitative real time-PCRs were performed with the MX3000P qPCR Machine (Stratagene) using primers for Vkorc1, Vkorc1L1, Ggcx, or Nqo1. Primer sequences for Vkorc1 amplification were 5′-TCCCGCGTCTTCTCCTCT-3′ (forward) and 5′-CGTCCCCTCAAGCAACCTA-3′ (reverse). Primer sequences for Vkorc1l1 amplification were 5′-CGAGCCAAACAGTGTCTTTGGACTTA-3′ (forward) and 5′-TGTGGTGACGCAGATGATGCAA-3′ (reverse). Gapdh was used as a housekeeping gene. Sequences of the Gapdh primers were as follows: 5′-CAGAACATCATCCCTGCATC-3′ (forward) and 5′-CTGCTTCACCACCTTCTTGA-3′ (reverse). The housekeeping gene was amplified under the same conditions used for the amplification of the target genes. Briefly, in a final volume of 20 μl, 5 ng of cDNA was added to an optimal amplification reaction mixture containing 5× HOT BIOAmp Evagreen® qPCR Mix (Biofidal, Vaux-en-Velin, France) and a 200 nm concentration of each primer. Thermal cycling was as follows: activation of the HOT BIOAmp® DNA polymerase at 95 °C for 15 min and 40 cycles of amplification (95 °C for 30 s, 60 °C for 40 s, and 72 °C for 30 s). To determine the specificity of amplification, analysis of product melting was conducted after the 40 cycles of amplification: a melting curve was obtained by increasing the temperature at a rate of 0.01 °C/s from 60 to 95 °C. In these conditions, Vkorc1 and Vkorc1l1 amplification efficiencies were similar (respectively, 101 and 99%) and allowed the comparison of their relative expression. The point at which the PCR product is first detected above a fixed threshold, the thermal cycle threshold (Ct), was determined for each sample in duplicate, and the average Ct of duplicate sample was calculated. To determine the quantity of the target gene-specific transcripts present in different tissues relative to the control, their respective Ct values were normalized by subtracting the Ct value obtained from the Gapdh control (rCt = Ct target − Ct control), and the relative concentration was determined using 2−rCt.
Plasmid Constructions
Human and rat VKORC1 and VKORC1L1 coding sequences fused with a c-myc tag via a flexible (GGS)3 in its 3′-extremity was optimized for heterologous expression in yeast and synthesized by GenScript (Piscataway, NJ). Synthesized nucleotide sequences included EcoRI and XbaI restriction sites at their 5′- and 3′-extremities, respectively. These nucleotide sequences were subcloned into pPICZ-B (Invitrogen) and sequenced on both strands.
Heterologous Expression in P. pastoris
Heterologous expressions of VKORC1 and VKORC1L1 proteins were performed in P. pastoris as described previously (15, 16). pPICZ-VKORC1 or VKORC1L1 vectors were individually transformed into the P. pastoris SMD1168 yeast strain using the P. pastoris Easy Comp Transformation kit (Invitrogen). Transformants were selected on YPD plates (1% (w/v) yeast extract, 2% (w/v) peptone, 2% (w/v) dextrose) containing 100 μg/ml zeocin (Invitrogen). The cells were grown in BMGY medium (1% (w/v) yeast extract, 2% (w/v) peptone, 100 mm potassium phosphate, pH 6.0, 1.34% (w/v) yeast nitrogen base, and 1% (v/v) glycerol). Expression was induced by methanol (1%, v/v) for 48 h at 30 °C in a rotary shaker (200 rpm). Yeast cells were collected by centrifugation (3000 × g for 10 min) and immediately frozen at −20 °C.
Subcellular Fractionation of Recombinant Yeast Cells
Yeast microsomes were prepared from thawed yeast cells by differential centrifugation. Briefly, yeast cells were resuspended in 50 mm phosphate buffer, pH 7.4, containing 1.15% (w/v) KCl. Yeast cells were broken with zircon beads using Dispermat® LC30 (VMA-GETZMANN) (15 min at 3500 rpm) continuously at 4 °C and further submitted to differential centrifugation. The 100,000 × g pellet corresponding to the membrane fraction was resuspended by Potter homogenization in Hepes glycerol buffer (50 mm Hepes, 20% glycerol, pH 7.4). Protein concentrations were evaluated by the method of Bradford using bovine serum albumin as a standard. Microsomes were frozen at −80 °C and used for kinetic analysis.
Immunoblot Analysis
Expression level quantification of VKORC1 and VKORC1L1 proteins in microsomal fractions was determined by Western blotting as described previously (16). Microsomal proteins were separated on 12% SDS-polyacrylamide gel electrophoresis, transferred onto Immobilon-P membranes, and probed with anti-c-myc antibodies (Invitrogen). The resulting immunocomplexes were visualized using alkaline phosphatase-conjugated anti-mouse immunoglobulins as secondary antibodies and a 5-bromo-4-chloro-3-indolyl phosphate/nitro blue tetrazolium solution. Quantification of the stained bands was performed by densitometry using the Scion Image software. The relative intensity of the signal was correlated with the quantity of microsomal proteins. The relation was linear from 0 to 50 μg for microsomal proteins.
To evaluate the expression level of VKORC1 and VKORC1L1 proteins, the expression of wild type human VKORC1 was designated as the basal expression. For the quantification of rat VKORC1 or human VKORC1L1 or rat VKORC1L1, the same unique pool of yeast microsomes containing human VKORC1 was used. Therefore, its expression factor was by definition 1. The expression level of rat VKORC1 or human or rat VKORC1L1 was evaluated by comparison with the expression of human VKORC1. For this purpose, various amounts (from 0 to 20 μg) of microsomal proteins containing human VKORC1 and various amounts (depending on the expression level) of microsomal proteins containing rat VKORC1 or human or rat VKORC1L1 were analyzed on the same Western blot. Two linear relations (relative intensity = a × quantity of microsomes loaded) were obtained, the first one for microsomes containing human VKORC1 (characterized by a specific slope ahVKORC1), the second one for microsomes containing rat VKORC1 or human or rat VKORC-1L1 (characterized by a slope atarget). The ratio atarget/ahVKORC1 allowed us to determine the expression factor characterizing the expression level of rat VKORC1 or human or rat VKORC1L1 in the microsomal fraction compared with the expression level of the human VKORC1.
VKOR Activity Assays and Kinetics
Microsomal VKOR activity was assayed as described previously (15, 16). Briefly, standard reactions were performed in 200 mm Hepes buffer, pH 7.4, containing 150 mm KCl, 1 mm dithiothreitol, 0.25 to 2 g·liter−1 of total proteins containing membrane VKORC1. The reaction was started by the addition of vit K1>O solution in 1% Triton X-100 and incubated at 37 °C for 30 min. In these conditions, the reaction was linear according to the time of incubation and the quantity of incubated proteins. After incubation at 37 °C for 30 min, the reaction was stopped by adding 4 ml of iced 1:1 isopropyl alcohol/hexane solution. After centrifugation at 5000 × g for 10 min, the hexane layer was removed and dried under nitrogen. The dry residue was immediately dissolved in 0.2 ml of isopropyl alcohol, and the reaction product was analyzed by liquid chromatography-mass spectrometry.
The LC-APCI/MS/MS used was a 1100 Series LC/MSD ion Trap VL with an atmospheric pressure chemical ionization (APCI) interface and a LCMS Chemstation software from Agilent Technologies (Palo Alto, CA). Chromatographic separation was performed using a SunFire reverse phase C8 column (4.6 mm × 150 mm, 5 μm; Waters) with a mobile phase of methanol, 0.1% acetic acid (95:5) in isocratic conditions. The column temperature was 45 °C. The flow rate in the LC column was 1 ml/min. The injection volume was 20 μl. The temperature of the autosampler tray was set to 5 °C, and the samples were protected from the daylight. Detection was by MS/MS with atmospheric pressure chemical ionization source in positive mode. Nebulizer pressure was set to 60 psi, dry gas temperature to 350 °C, dry gas flow to 5 liters/min, and vaporizer temperature to 400 °C. Capillary voltage was set to 4000 V, corona needle to 4000 nA, and CID to 1 V. Collision gas in the trap was helium with a pressure of 0.6 * 10−5 mbar. Identification criteria for vit K1 are the retention time (tr = 4.1 min) and the product ion 451 → 187 (m/z (+) = 187). Identification criteria for vit K1>O are the retention time (tr = 3.4 min) and the product ion 467 → 307 (m/z (+) = 307). Linearity and accuracy were tested from 25 to 2000 ng/ml (n = 20). The response was linear throughout the concentration range tested with a coefficient of correlation (r2) above 0.99. Accuracy was between 80 and 120% of the theoretical concentrations.
Km, Vmax, and Ki values were obtained from at least three separate experiments performed on two different batches of protein. The estimation of Km and Vmax values was achieved by the incubation of at least nine different concentrations of vit K>O (from 0.003 to 0.2 mm) to the standard reaction. Incubations were performed in duplicate. Data were fitted by nonlinear regression to the Michaelis-Menten model using the R-fit program.
To evaluate the inhibiting effect of warfarin on VKOR activity, Ki was determined after the addition of various concentrations of anticoagulant to the standard reaction in the presence of increasing amounts of vit K>O (from 0.003 to 0.2 mm) using anticoagulant concentrations from approximately 0.05 to 20× Ki. Data were fitted by nonlinear regression to the noncompetitive inhibition model v = (Vmax/(1 + (I/Ki))) * (S/(Km + S)) using the R-fit program.
RESULTS
Vkorc1 and Vkorc1l1 mRNA Distribution in Rat Tissues
The presence of mRNA for Vkorc1 or Vkorc1l1 was assessed by real-time PCR in various tissues (i.e. liver, lung kidney, brain, and testis) from 9-week-old male OFA Sprague-Dawley rats. Fig. 2 shows patterns of the expression of mRNA encoding both enzymes but also the other enzymes involved in the vitamin K cycle (i.e. GGCX and NQO1) in these tissues. The presence of Vkorc1, Vkorc1l1, Ggcx, and Nqo1 mRNA was systematically detected in all of the tissues screened in this study. As expected, Vkorc1 was strongly expressed in the liver. In the other tissues, its expression was much lower (i.e. 4- to 8-fold lower in the kidney/lung/testis and 30-fold lower in the brain). Vkorc1l1 was also detected in all the tissues. Nevertheless, the levels of Vkorc1l1 expression were much more uniform between tissues with variations from 1 to 7 and between. Because PCR efficiencies for Vkorc1 and Vkorc1l1 are identical, comparison of Vkorc1 and Vkorc1l1 expression levels was possible. In liver, expression of Vkorc1 mRNA was highly predominant (i.e. 10-fold higher) compared with Vkorc1l1 mRNA expression (Fig. 2). In lung and kidney, Vkorc1 was a little more expressed than Vkorc1l1, whereas in brain and testis Vkorc1 was a little less expressed than Vkorc1l1 (Fig. 2). Expression of VKORC1 and VKORC1L1 mRNA was almost not influenced by the age (Fig. 3).
FIGURE 2.
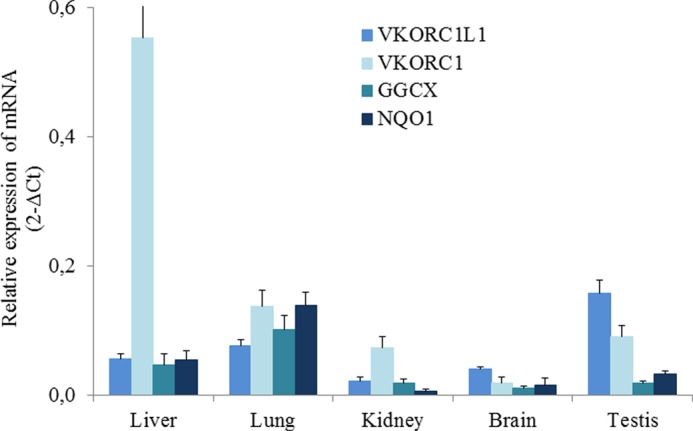
Analysis of expression of VKORC1, VKORC1L1, GGCX, and NQO1 mRNA in 9-week-old-male OFA Sprague-Dawley rats. Total RNA (100 ng) isolated from liver, lung, kidney, brain, and testis was used to quantify by real-time PCR mRNA expression of the four enzymes involved in the vitamin K cycle. Each data point represents the mean of four animals ± S.D. (error bars). Three separate determinations were made for each animal.
FIGURE 3.
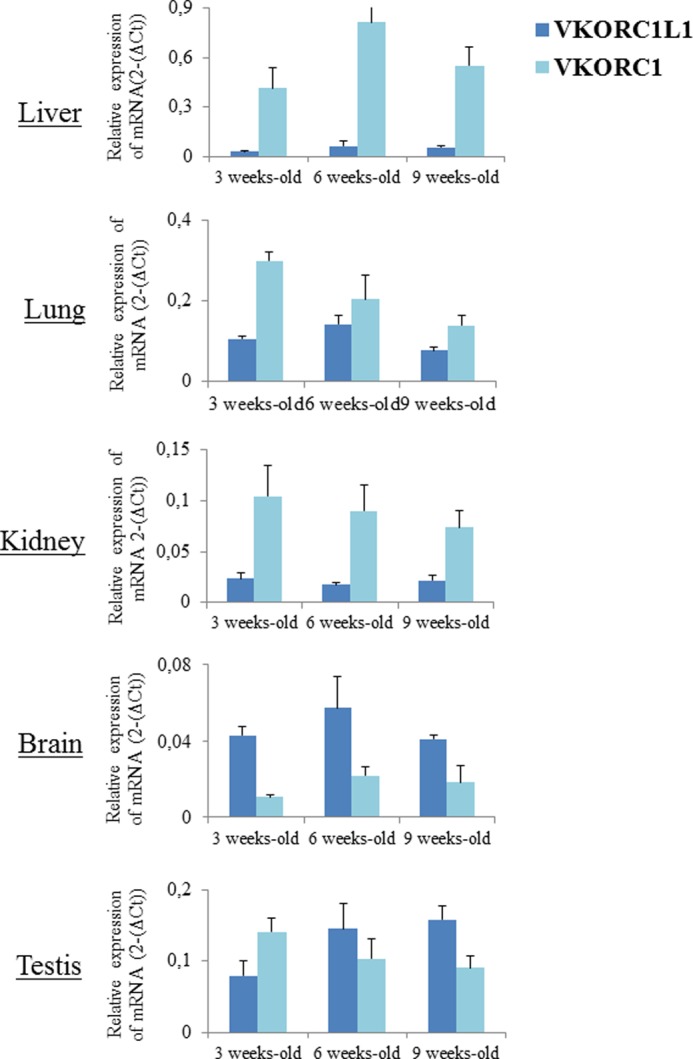
Evolution of VKORC1 and VKORC1L1 in different rat tissues as a function of age. Total RNA (100 ng) isolated from liver, lung, kidney, brain, and testis was used to quantify by real-time PCR mRNA expression of Vkorc1 and Vkorc1l1. Each data point represents the mean of four animals ± S.D. (error bars). Three separate determinations were made for each animal.
Vkorc1 and Vkorc1l1 mRNA Distribution in Rat Osteosarcoma Cell Lines ROS 17/2.8
Because OC, a crucial VKDP involved in bone metabolism and glucose homeostasis, is secreted by osteoblasts, the expression of the enzymes involved in vitamin K cycle was explored in cells with phenotype of osteoblast-like, ROS 17/2.8. This phenotype was confirmed by the detection of mRNA encoding the alkaline phosphatase and OC (Fig. 4). In these cells, the presence of mRNA for all of the enzymes involved in the vitamin K cycle (i.e. VKORC1, VKORC1-L1, GGCX, and NQO1) was detected whatever the number of passages was (from 4 to 8) (Fig. 4). Vkorc1l1 mRNA were little more expressed than Vkorc1 mRNA, as described in rat testis.
FIGURE 4.
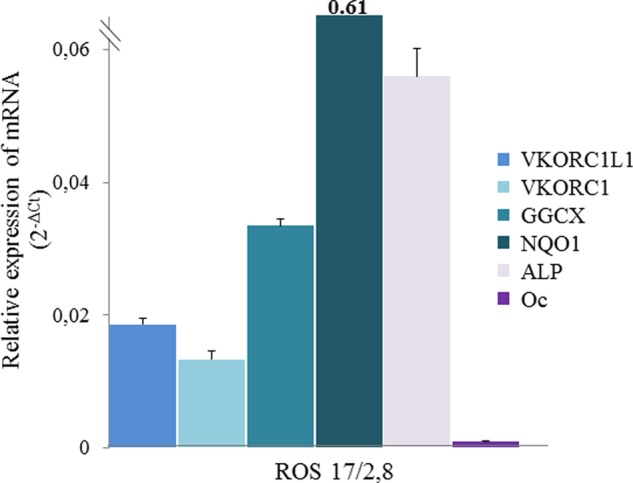
Analysis of expression of VKORC1, VKORC1L1, GGCX, and NQO1 in osteoblastic cells ROS 17/2.8 cells. ROS cells were cultured in DMEM supplemented with 10% FBS and 100 units/ml penicillin/streptomycin. Total RNA isolated from ROS cells was used to quantify by real-time PCR mRNA expression for the four enzymes involved in the vitamin K cycle and for OC and alkaline phosphatase (ALP). Each data point represents the mean of four different cultures of ROS 17/2.8 cells ± S.D. (error bars). Three separate determinations were made for each culture.
VKORC1L1 mRNA Expression Is Not Modified in VKORC1-deficient Animals
Expression of Vkorc1l1 mRNA was assessed in VKORC1 knock-out mice compared with wild type mice (Fig. 5). In wild type mice, Vkorc1 and Vkorc1l1 were expressed in liver, lung, and testis, and their distribution was similar to that described above for rats. In liver, expression of Vkorc1 mRNA was highly predominant (i.e. 5-fold higher) compared with Vkorc1l1. In lung, Vkorc1 was a little more expressed than Vkorc1l1. In testis Vkorc1 was less expressed than Vkorc1l1. In VKORC1-deficient mice, Vkorc1l1 expression was unchanged compared with wild type mice, whereas Vkorc1 mRNA was effectively not expressed.
FIGURE 5.
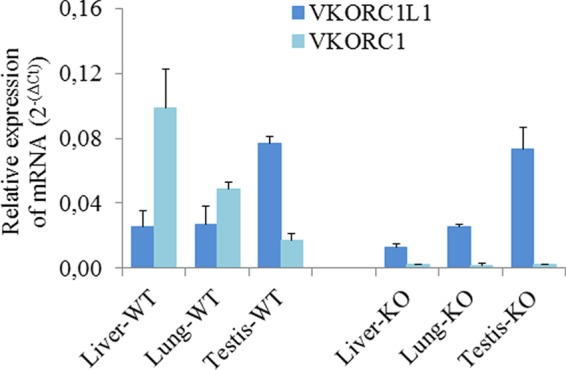
Analysis of VKORC1L1 expression in different tissues of adult male VKORC1-deficient mice compared with wild type mice. Total RNA (100 ng) isolated from liver, lung, kidney, brain, and testis was used to quantify by real-time PCR mRNA expression of Vkorc1 and Vkorc1l1 enzymes involved in the vitamin K cycle. Each data point represents the mean of three animals ± S.D. (error bars). Three separate determinations were made for each animal.
VKORC1L1, an Enzyme Highly Resistant to Vitamin K Antagonists
To assess the functional properties of VKORC1L1 enzymes, human and rat VKORC1L1 proteins were overexpressed in P. pastoris, as described for human and rat VKORC1 (15, 16). All of the recombinant proteins were efficiently expressed in microsomes of P. pastoris with the same expected molecular mass of ∼20-kDa. Depending on the expressed protein, the levels of expression in the microsomal fraction were different. Because recombinant human and rat VKORC1 and VKORC1L1 proteins were expressed as c-myc-fused proteins, quantification of each recombinant protein in membrane fractions was performed by Western blotting using anti-c-myc antibodies compared with the expression of recombinant human VKORC1, as described under “Experimental Procedures” (16). Depending on the expressed protein, the expression factor comprised between 0.3 to 2.5 compared with the expression of recombinant humanVKORC1 in yeast microsomes.
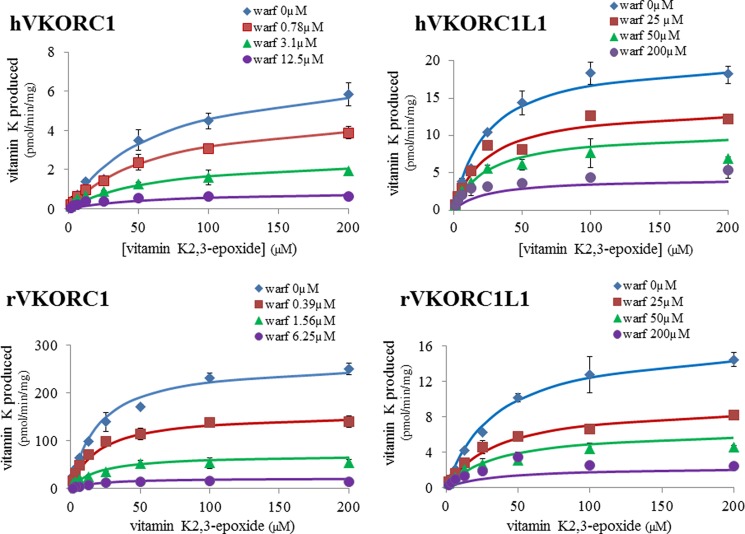
As shown previously, VKORC1L1 proteins were able to reduce vit K>O in vit KH2 (24). The reaction rates of recombinant human and rat VKORC1L1 toward vit K1>O followed the Michaelis-Menten model, allowing the determination of kinetic parameters (Table 1). Vmax values indicated in this table are Vmax calculated after normalization of the expression by immunoblot analysis. The Km values of recombinant VKORC1L1 enzymes were similar to those of the recombinant VKORC1 enzymes. Except for the recombinant rat VKORC1, the Vmax values of all of the recombinant enzymes (i.e. hVKORC1, hVKORC1L1, and rVKORC1L1) were also similar (Table 1).
TABLE 1.
Apparent kinetic parameters toward vit K1>O and inhibition constants toward warfarin obtained for yeast microsomes expressing recombinant VKORC1 or VKORC1L1 proteins
To determine the VKOR activity, standard reactions were performed in 200 mm Hepes buffer, pH 7.4, containing 150 mm KCl and 0.25–2 g·liter−1 microsomal proteins expressing membrane wild type or mutant VKORC1. The Vmax values determined at saturating concentration of vitamin K epoxide substrate were evaluated after normalization of the recombinant protein expression level by immunoquantification by Western blotting as described under “Experimental Procedures.” Each data point represents the mean ± S.D. of three individual determinations.
| Protein | Km | Vmax | Vmax/Km | Ki |
|---|---|---|---|---|
| μm | pmol·min−1·mg−1 total protein | nl·min−1·mg−1 total protein | μm | |
| hVKORC1 | 21.5 ± 4.2 | 7.4 ± 0.5 | 344 | 1.8 ± 0.2 |
| hVKORC1L1 | 24.1 ± 3.0 | 20.7 ± 0.9 | 859 | 52.0 ± 3.0 |
| rVKORC1 | 19.6 ± 1.6 | 266.7 ± 8.8 | 13607 | 0.6 ± 0.04 |
| rVKORC1L1 | 35.0 ± 3.0 | 16.8 ± 0.5 | 480 | 32.6 ± 1.9 |
For human and rat VKORC1L1 proteins, susceptibility to VKA was determined using warfarin, a VKA largely used in human medicine. Warfarin was able to inhibit the VKOR activity catalyzed by VKORC1L1 enzymes, but with concentration much stronger than those used to inhibit the VKORC1-dependent activity (Fig. 6). Modeling of the data using noncompetitive equation gave a correct fit (Fig. 6), as described for VKORC1 enzymes (15, 16), allowing the determination of Ki parameters (Table 1). VKORC1L1 enzymes were 30–50-fold more resistant to the action of warfarin than VKORC1 enzymes.
FIGURE 6.
Inhibition by warfarin of VKOR activity catalyzed by human or rat wild type recombinant VKORC1 or VKORC1L1. VKOR activity versus vit K1>O (from 0 to 200 μm) was determined in the presence of four different concentrations of warfarin incubated with microsomes from recombinant yeast expressing human or rat wild type VKORC1 or VKORC1L1. Each data point represents the mean ± S.D. (error bars) of two determinations.
VKORC1L1, an Enzyme Catalyzing VKOR Activity in Some Tissues
Because Vkorc1l1 transcripts were significantly detected in testis and not detected in liver of VKORC1-deficient mice, VKOR activity was evaluated in both tissues using a saturating concentration of vit K1>O (Fig. 7). VKOR activity in VKORC1-deficient mice liver microsomes was almost undetectable (i.e. 0.9 pmol·min−1·mg−1 of total proteins) and represented only 2.9% of VKOR activity measured in liver of wild type mice. On the contrary, VKOR activity in VKORC1-deficient mice testis microsomes was clearly detected (i.e. 4.1 pmol·min−1·mg−1 of total proteins) and represented 35% of the total activity measured in testis of wild type mice (Fig. 7). This activity was almost totally inhibited by 100 μm warfarin.
FIGURE 7.
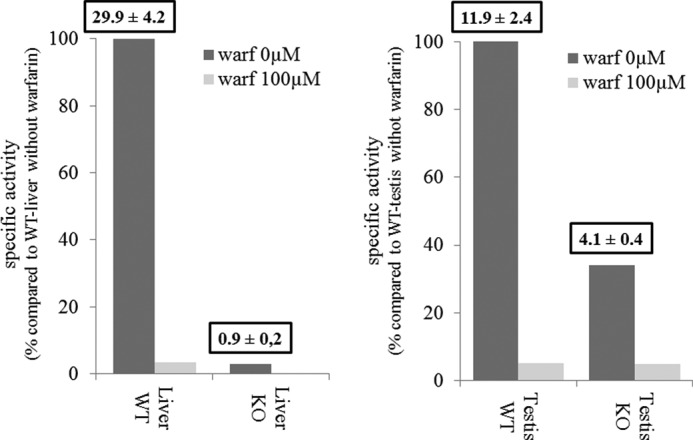
Analysis of VKOR activity in liver and testis of male VKORC1-deficient mice compared with wild type mice. VKOR activity was evaluated in the presence of 200 μm of K1>O in the presence of 0 or 100 μm warfarin. Results are expressed as percentages of activity compared with wild type mice liver or testis. Above bars are indicated the specific activities (pmol·min−1·mg−1 of total protein) determined in the corresponding tissue.
Susceptibility to Vitamin K Antagonists Depends on the Tissue
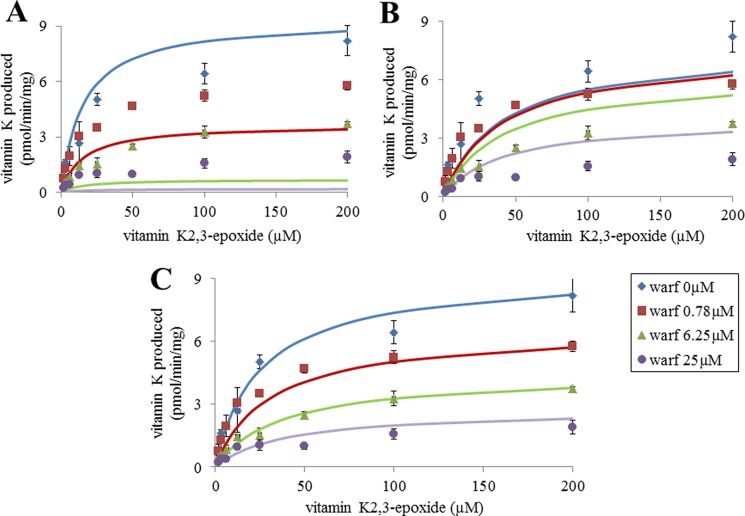
Because transcripts corresponding to VKORC1 and VKORC1L1 were detected in rat liver, lung, kidney, brain, and testis, the presence of VKOR activity was assessed in these organs using a saturating concentration of vit K1>O (Fig. 8). VKOR activity was detected in all of the tissues, with the highest activity detected in liver, then in testis, kidney, brain, and lung. However and surprisingly, VKOR activity in testis was only 2-fold lower compared with liver. Comparative susceptibility to VKA of the VKOR activity detected in these different tissues was assessed using warfarin. In the presence of 0.78 μm warfarin, the percentage of residual VKOR activity was different between tissues. In liver, 0.78 μm warfarin inhibited 70% of the total VKOR activity whereas in testis, the same concentration of warfarin inhibited only 30% of the total VKOR activity, suggesting a different susceptibility to VKA among tissues. To explore this hypothesis further, VKOR activity in the different tissues was evaluated with increasing concentrations of vit K1>O (from 0 to 200 μm) in the presence of different concentrations of warfarin. Figs. 6 and 7 show the results obtained, respectively, in liver and testis. In liver, 0, 0.20, 0.78, and 6.25 μm warfarin was used to inhibit the VKOR activity (Fig. 9). The experimental results obtained in liver were perfectly fitted by nonlinear regression using the noncompetitive inhibition model and the Km and Ki parameters determined for recombinant rat VKORC1 (i.e. 19.6 and 0.6 μm). In testis, 0, 0.78, 6.25, and 25 μm warfarin was used to inhibit the VKOR activity (Fig. 10). As described in liver, warfarin inhibited the VKOR activity in a noncompetitive manner. Nevertheless, it was not possible to fit by nonlinear regression the experimental results obtained in testis using the noncompetitive model and the Km and Ki parameters determined for recombinant rat VKORC1, corresponding to an exclusive expression of VKORC1 (Fig. 10A). In the same way, it was not possible to fit these experimental results considering an exclusive expression of VKORC1L1 (Fig. 10B). The only way to fit the experimental results perfectly was to consider in testis a mixed expression of VKORC1 and VKORC1L1 and to optimize the percentage of the VKOR activity catalyzed by VKORC1 and the percentage of the VKOR activity catalyzed by VKORC1L1. The best fit was obtained in testis for a ratio of 45% of the VKOR activity supported by VKORC1 and 55% supported by VKORC1L1 (Fig. 10C). Table 2 presents the percentages of the VKOR activity supported by VKORC1 and VKORC1L1 in testis, but also in the other tissues considered in this study (i.e. lung, kidney, and brain) and in ROS 17/2.8 cells.
FIGURE 8.
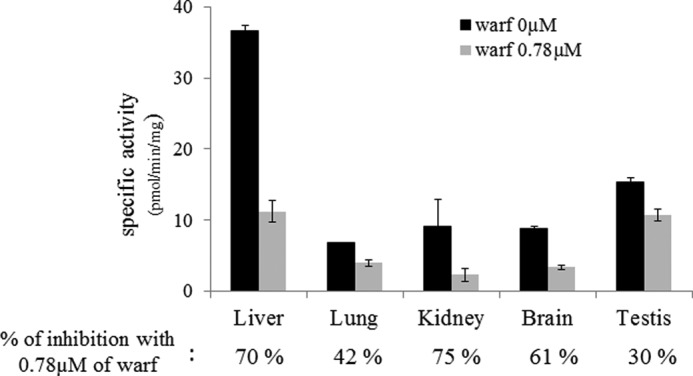
Analysis of VKOR activity in different tissues of male OFA Sprague-Dawley rats. VKOR activity was evaluated in the presence of 200 μm vit K1>O with 0 or 0.78 μm warfarin. Each bar represents the mean ± S.D. (error bars) of three individual determinations. Percentages of inhibition of the VKOR activity with 0.78 μm warfarin are indicated below each tissue tested.
FIGURE 9.
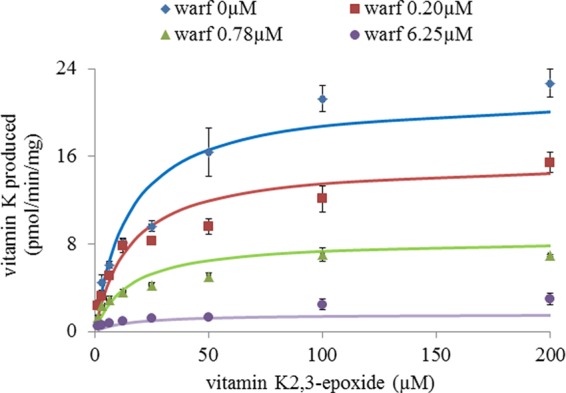
Inhibition by warfarin of VKOR activity in liver of male OFA Sprague-Dawley rats. VKOR activity versus vit K1>O (from 0 to 200 μm) was determined in the presence of four different concentrations of warfarin incubated with rat liver microsomes. Each data point represents the mean ± S.D. (error bars) of two determinations. The experimental results were fitted by nonlinear regression using the noncompetitive inhibition model, and the Km and Ki parameters were determined for recombinant rat VKORC1 (i.e. 19.6 and 0.6 μm).
FIGURE 10.
Inhibition by warfarin of VKOR activity in testis of OFA Sprague-Dawley rats. VKOR activity versus vit K1>O (from 0 to 200 μm) was determined in the presence of four different concentrations of warfarin incubated with rat liver microsomes. Each data point represents the mean ± S.D. (error bars) of two determinations. A, the experimental results were fitted by nonlinear regression using the noncompetitive inhibition model, and the Km and Ki parameters were determined for recombinant rat VKORC1 (i.e. 19.6 and 0.6 μm). B, the experimental results were fitted by nonlinear regression using the noncompetitive inhibition model, and the Km and Ki parameters were determined for recombinant rat VKORC1L1 (i.e. 35 and 33 μm). C, the experimental results were fitted considering a mixed expression of VKORC1 and VKORC1L1 in testis by nonlinear regression using the noncompetitive inhibition model, the catalytic parameters of recombinant rVKORC1 and rVKORC1L1. The best fit was obtained in testis for a ratio of 45% of the VKOR activity supported by VKORC1 and 55% supported by VKORC1L1.
TABLE 2.
VKOR activity supported by VKORC1L1 enzyme in different tissues of male OFA Sprague-Dawley rats
Percentages of the VKOR activity catalyzed by VKORC1 or VKORC1L1 were evaluated by inhibition of the VKOR activity by warfarin at varying concentrations of vit K1>O and by modeling of the experimental results by nonlinear regression using the noncompetitive inhibition equation, the respective Km and Ki values determined for recombinant VKORC1 and VKORC1L1 proteins and considering a mixed expression of VKORC1 and VKORC1L1 in the tissue.
| VKOR activity | Liver | Lung | Kidney | Brain | Testis | ROS 17/2.8 |
|---|---|---|---|---|---|---|
| % | % | % | % | % | % | |
| Supported by VKORC1L1 | 4 | 22 | 1 | 9 | 55 | 69 |
| Supported by VKORC1 | 96 | 78 | 99 | 91 | 45 | 32 |
DISCUSSION
VKORC1L1 Also Supports VKOR Activity
VKORC1 and VKORC1L1 were described to be able to catalyze the VKOR activity that corresponds to the reduction of vit K>O generated during the γ-carboxylation of VKDPs, in vit K (12, 13, 24). Therefore, in this study, we expressed human and rat VKORC1L1 as c-myc-fused proteins in the same expression system which previously allowed us to characterize completely the rat and human VKORC1 and all their spontaneous mutants (15, 16). It was thus possible to compare the catalytic efficiencies (Vmax/Km) of VKORC1L1 proteins with those of VKORC1 proteins. Rat VKORC1L1 catalyzes the reduction of vit K>O in vit K with a catalytic efficiency 30-fold lower than that of rat VKORC1 whereas human VKORC1L1 is able to catalyze this reaction with a catalytic efficiency 2-fold higher than that of human VKORC1, suggesting an important role of VKORC1L1 in human.
VKORC1L1 Is an Enzyme Resistant to VKA
VKOR activity is specifically inhibited by VKA such as warfarin. VKORC1 protein was demonstrated to be strongly inhibited by VKA. On the other hand, the susceptibility of VKORC1L1 enzyme to these molecules was not clearly characterized. In this study, the reduction of vit K>O in vit K catalyzed by human or rat VKORC1L1 was shown to be widely less susceptible to VKA than that catalyzed by VKORC1 proteins. Indeed, 30–50-fold more anticoagulants are necessary to inhibit VKORC1L1 compared with VKORC1. Despite this particular property of VKORC1L1 compared with VKORC1, its involvement in the recycling of vitamin K was never considered. In the following, the natural resistance of VKORC1L1 to VKA is used to estimate the involvement of VKORC1L1 in VKOR activity in the different tissues.
VKORC1L1 Does Not Support VKOR Activity in the Liver
In liver our results demonstrate the quasi-exclusive participation of VKORC1 in the VKOR activity. Indeed, expression of Vkorc1l1 mRNA in the liver is negligible compared with that of Vkorc1 mRNA (∼10-fold lower). Moreover, inhibition of the VKOR activity in liver by warfarin perfectly follows a noncompetitive inhibition model involving the exclusive participation of VKORC1. Finally, in VKORC1-deficient mice liver, VKOR activity is almost undetectable. These results are in agreement with the phenotype described for Vkorc1−/− mice. Homozygous Vkorc1−/− mice die in 2–20 days after birth by extensive bleeding due to a total deficiency of the γ-carboxylation of the clotting factors in liver (25), confirming the exclusive involvement of VKORC1 in the liver.
VKORC1L1 Is Involved in VKOR Activity in Extrahepatic Tissues
Unlike the VKDPs involved in the coagulation process, which are synthesized in the liver, the VKDPs involved in the other physiological processes are produced by extrahepatic tissues. It is thus necessary to differentiate the VKOR activity detected in liver and the VKOR activity detected in extrahepatic tissues. In this study, we show clearly that VKOR activity is systematically detected in extrahepatic tissues. In lung where the presence of MGP was described previously (26–28) and in kidney where the presence of the urinary prothrombin fragment 1 was described (29, 30), VKOR activity is, respectively, 5- and 4-fold lower than that of liver. In testis where MGP is also expressed (data not shown), this activity is only 2-fold lower compared with liver. In osteosarcoma cell lines which are known to produce OC, another VKDP, VKOR activity was also detected in this study.
In the extrahepatic tissues considered herein (i.e. lung, kidney, testis, brain, osteoblastic cells) expression of Vkorc1 mRNA is systematically much lower than that detected in liver. On the other hand, expression of Vkorc1l1 mRNA is equivalent, even superior to that detected in the liver. As a consequence, expression of Vkorc1l1 mRNA in some tissues such as testis is more elevated than that of Vkorc1 mRNA. Antibodies against VKORC1L1 being unavailable, the effective expression of VKORC1L1 protein was evaluated by the characterization of the VKOR activity in these extrahepatic tissues. In testis of VKORC1-deficient mice, VKOR activity is still detected despite the knock-out of the Vkorc1 gene. This demonstrates the involvement of another enzyme, certainly VKORC1L1, able to catalyze the reduction of vit K1>O to vit K1. In mouse testis this enzyme catalyzes 35% of the total VKOR activity detected in wild type mice testis and seems to be inhibited by high concentration of warfarin. In rat tissues, to evaluate the part of the VKOR activity catalyzed by VKORC1L1, an inhibition profile of the VKOR activity by warfarin was performed. In rat testis, inhibition of VKOR activity by warfarin follows a noncompetitive inhibition model (Vmax different but Km similar) as obtained for liver. Nevertheless, and contrary to the liver, the modeling of the results by nonlinear regression using the noncompetitive inhibition equation and the VKORC1 kinetic parameters was absolutely not possible. The same modeling using the VKORC1L1 kinetic parameters was also not possible. Only a noncompetitive inhibition model with a mixed expression of VKORC1 and VKORC1L1 allowed us to fit the data perfectly and thus, estimate the parts of the VKOR activity supported by VKORC1 enzyme (∼45%) and by VKORC1L1 enzyme (∼55%). A similar approach was realized for the other tissues or cells. In lung and osteoblastic cells ROS 17/2.8, VKOR activity is also a mixed activity supported by VKORC1 (i.e. respectively, 78 and 32%, in lung and ROS 17/2.8 cells) and VKORC1L1 (i.e. respectively, 22 and 68%, in lung and ROS 17/2.8 cells).
Differences in phenotypes were observed between Vkorc1−/− mice (25) and Ggcx−/− mice (31), despite the central positions of VKORC1 and GGCX in the vitamin K cycle. Ggcx knock-out leads to massive embryonic lethality (31), whereas Vkorc1 knock-out does not (25). Spohn et al. suggested that these differences in phenotype may be due to a complete deficiency of the γ-carboxylation in Ggcx−/− animals, whereas a partial γ-carboxylation of VKDP not involved in coagulation, but involved in other physiological processes, would be rescued by another pathway in Vkorc1−/− animals (25). In this study, we clearly demonstrated that VKORC1L1 is able to support VKOR activity and may constitute an alternative pathway to VKORC1 in some tissues in Vkorc1−/− animals.
Warfarin Resistance of Extrahepatic Tissues May Be Explained by VKORC1L1
During long term anticoagulation therapy, effects on VKDPs involved in coagulation process are observed whereas effects on VKDPs produced in extrahepatic tissues are not apparent or quite difficult to observe. Indeed, to induce arterial calcification by warfarin in rats, excessive doses of anticoagulants widely superior to the therapeutic doses were used in the various studies previously published (20, 32, 33). Price et al. (33) had to treat rats twice a day with 150 mg/kg warfarin (∼4000-fold higher than the therapeutic dose used in human medicine) to induce rapid calcification of the elastic lamellae in the media of major arteries and in aortic heart valves. In other soft tissues known to also express MGP at a high rate, no calcification was observed in the different studies. When rats were treated with a warfarin dose given once every 24 h, a complete absence of artery calcification was noted (22, 23, 34, 35). Some of these studies described a depletion of OC in bone consecutively to the inhibition of γ-carboxylation of this VKDP (22, 23, 35, 36). Nevertheless, these various experiments were performed in rats receiving a vitamin K-depleted diet, and undercarboxylated OC in plasma and OC in bone are considered as very good markers of the deficiency in vit K. It is thus very difficult to interpret these experiences. Finally, the only in vivo study easily interpretable and close to human therapeutic conditions is the study performed on healthy nonhuman primates by Binkley et al. (37). In this study, adult male rhesus monkeys received 1.5 mg/day menadione in the diet and 0.15 mg/kg/day warfarin (i.e. corresponding approximately to 2-fold the dose routinely used in human) during a 30-month period. The International Normalized Ratio of these animals increased from 0.7 to 2.5–3.5. On the other hand, long term warfarin anticoagulation almost did not affect serum OC. Circulating undercarboxylated OC was described to be able to stimulate secretion of insulin and to increase tissues susceptibility to insulin (7, 8) and to influence male fertility (38). During long term anticoagulation therapy in human, modifications of glucose homeostasis or fertility were not reported.
In this study, we demonstrate that when VKORC1L1 is expressed in a tissue, a higher concentration of anticoagulant is needed in this tissue to obtain the same inhibition than that observed in liver where only VKORC1 is expressed. Therefore, we postulate that during a long term anticoagulation therapy, vit K in some extrahepatic tissues such as testis is still recycled by VKORC1L1, avoiding unwanted side effects by allowing the synthesis of VKDP not involved in the coagulation process, but involved in other physiological processes such as OC, MGP, or Gas6.
This work was supported by Agence Nationale pour la Recherche Grant RODENT 2009-CESA-008-03 and by Direction Générale de l'Enseignement et de la Recherche (DGER).
- GGCX
- γ-glutamyl carboxylase
- Gla
- carboxylated glutamate
- MGP
- matrix Gla protein
- OC
- osteocalcin
- vit K
- vitamin K
- VKA
- vitamin K antagonist
- VKDP
- vitamin K-dependent protein
- vit KH2
- vitamin K hydroquinone
- vit K>O
- vitamin K 2-3 epoxide
- VKOR
- vitamin K epoxide reductase
- VKORC1
- vitamin K epoxide reductase complex subunit 1
- VKORC1L1
- VKORC1-like 1.
REFERENCES
- 1. Price P. A., Poser J. W., Raman N. (1976) Primary structure of the γ-carboxyglutamic acid-containing protein from bovine bone. Proc. Natl. Acad. Sci. U.S.A. 73, 3374–3375 [DOI] [PMC free article] [PubMed] [Google Scholar]
- 2. Price P. A., Urist M. R., Otawara Y. (1983) Matrix Gla protein, a new γ-carboxyglutamic acid-containing protein which is associated with the organic matrix of bone. Biochem. Biophys. Res. Commun. 117, 765–771 [DOI] [PubMed] [Google Scholar]
- 3. Coutu D. L., Wu J. H., Monette A., Rivard G. E., Blostein M. D., Galipeau J. (2008) Periostin, a member of a novel family of vitamin K-dependent proteins, is expressed by mesenchymal stromal cells. J. Biol. Chem. 283, 17991–18001 [DOI] [PubMed] [Google Scholar]
- 4. Nakano T., Kawamoto K., Kishino J., Nomura K., Higashino K., Arita H. (1997) Requirement of γ-carboxyglutamic acid residues for the biological activity of Gas6: contribution of endogenous Gas6 to the proliferation of vascular smooth muscle cells. Biochem. J. 323, 387–392 [DOI] [PMC free article] [PubMed] [Google Scholar]
- 5. Viegas C. S., Simes D. C., Laizé V., Williamson M. K., Price P. A., Cancela M. L. (2008) Gla-rich protein (GRP), a new vitamin K-dependent protein identified from sturgeon cartilage and highly conserved in vertebrates. J. Biol. Chem. 283, 36655–36664 [DOI] [PMC free article] [PubMed] [Google Scholar]
- 6. Schurgers L. J., Teunissen K. J., Knapen M. H., Kwaijtaal M., van Diest R., Appels A., Reutelingsperger C. P., Cleutjens J. P., Vermeer C. (2005) Novel conformation-specific antibodies against matrix γ-carboxyglutamic acid (Gla) protein: undercarboxylated matrix Gla protein as marker for vascular calcification. Arterioscler. Thromb. Vasc. Biol. 25, 1629–1633 [DOI] [PubMed] [Google Scholar]
- 7. Lee N. K., Sowa H., Hinoi E., Ferron M., Ahn J. D., Confavreux C., Dacquin R., Mee P. J., McKee M. D., Jung D. Y., Zhang Z., Kim J. K., Mauvais-Jarvis F., Ducy P., Karsenty G. (2007) Endocrine regulation of energy metabolism by the skeleton. Cell 130, 456–469 [DOI] [PMC free article] [PubMed] [Google Scholar]
- 8. Ferron M., Hinoi E., Karsenty G., Ducy P. (2008) Osteocalcin differentially regulates beta cell and adipocyte gene expression and affects the development of metabolic diseases in wild-type mice. Proc. Natl. Acad. Sci. U.S.A. 105, 5266–5270 [DOI] [PMC free article] [PubMed] [Google Scholar]
- 9. Oldenburg J., Marinova M., Müller-Reible C., Watzka M. (2008) The vitamin K cycle. Vitam. Horm. 78, 35–62 [DOI] [PubMed] [Google Scholar]
- 10. Chatrou M. L., Reutelingsperger C. P., Schurgers L. J. (2011) Role of vitamin K-dependent proteins in the arterial vessel wall. Hamostaseologie 31, 251–257 [DOI] [PubMed] [Google Scholar]
- 11. Lasseur R., Longin-Sauvageon C., Videmann B., Billeret M., Berny P., Benoit E. (2005) Warfarin resistance in a French strain of rats. J. Biochem. Mol. Toxicol. 19, 379–385 [DOI] [PubMed] [Google Scholar]
- 12. Rost S., Fregin A., Ivaskevicius V. (2004) Mutations in VKORC1 cause warfarin resistance and multiple coagulation factor deficiency type 2. Nature 427, 537–541 [DOI] [PubMed] [Google Scholar]
- 13. Li T., Chang C. Y., Jin D. Y., Lin P. J., Khvorova A., Stafford D. W. (2004) Identification of the gene for vitamin K epoxide reductase. Nature 427, 541–544 [DOI] [PubMed] [Google Scholar]
- 14. Chu P. H., Huang T. Y., Williams J., Stafford D. W. (2006) Purified vitamin K epoxide reductase alone is sufficient for conversion of vitamin K epoxide to vitamin K and vitamin K to vitamin KH2. Proc. Natl. Acad. Sci. U.S.A. 103, 19308–19313 [DOI] [PMC free article] [PubMed] [Google Scholar]
- 15. Hodroge A., Longin-Sauvageon C., Fourel I., Benoit E., Lattard V. (2011) Biochemical characterization of spontaneous mutants of rat VKORC1 involved in the resistance to antivitamin K anticoagulants. Arch. Biochem. Biophys. 515, 14–20 [DOI] [PubMed] [Google Scholar]
- 16. Hodroge A., Matagrin B., Moreau C., Fourel I., Hammed A., Benoit E., Lattard V. (2012) VKORC1 mutations detected in patients resistant to vitamin K antagonists are not all associated with a resistant VKOR activity. J. Thromb. Haemost. 10, 2535–2543 [DOI] [PubMed] [Google Scholar]
- 17. Stenova E., Steno B., Killinger Z., Baqi L., Payer J. (2011) Effect of long-term oral anticoagulant therapy on bone mineral density and bone turnover markers: a prospective 12 month study. Bratisl. Lek. Listy. 112, 71–76 [PubMed] [Google Scholar]
- 18. Villines T. C., O'Malley P. G., Feuerstein I. M., Thomas S., Taylor A. J. (2009) Does prolonged warfarin exposure potentiate coronary calcification in humans? Results of the warfarin and coronary calcification study. Calcif. Tissue Int. 85, 494–500 [DOI] [PubMed] [Google Scholar]
- 19. Wysowski D. K., Nourjah P., Swartz L. (2007) Bleeding complications with warfarin use: a prevalent adverse effect resulting in regulatory action. Arch. Intern. Med. 167, 1414–1419 [DOI] [PubMed] [Google Scholar]
- 20. Schurgers L. J., Joosen I. A., Laufer E. M. (2012) Vitamin K-antagonists accelerate atherosclerotic calcification and induce a vulnerable plaque phenotype. PLOS One 7, e43229. [DOI] [PMC free article] [PubMed] [Google Scholar]
- 21. Knapen M. H., Schurgers L. J., Shearer M. J., Newman P., Theuwissen E., Vermeer C. (2012) Association of vitamin K status with adiponectin and body composition in healthy subjects: uncarboxylated osteocalcin is not associated with fat mass and body weight. Br. J. Nutr. 108, 1017–1024 [DOI] [PubMed] [Google Scholar]
- 22. Price P. A., Williamson M. K. (1981) Effects of warfarin on bone: studies on the vitamin K-dependent protein of rat bone. J. Biol. Chem. 256, 12754–12759 [PubMed] [Google Scholar]
- 23. Price P. A., Williamson M. K., Haba T., Dell R. B., Jee W. S. (1982) Excessive mineralization with growth plate closure in rats on chronic warfarin treatment. Proc. Natl. Acad. Sci. U.S.A. 79, 7734–7738 [DOI] [PMC free article] [PubMed] [Google Scholar]
- 24. Westhofen P., Watzka M., Marinova M., Hass M., Kirfel G., Müller J., Bevans C. G., Müller C. R., Oldenburg J. (2011) Human vitamin K 2,3-epoxide reductase complex subunit 1-like 1 (VKORC1L1) mediates vitamin K-dependent intracellular antioxidant function. J. Biol. Chem. 286, 15085–15094 [DOI] [PMC free article] [PubMed] [Google Scholar]
- 25. Spohn G., Kleinridders A., Wunderlich F. T. (2009) VKORC1 deficiency in mice causes early postnatal lethality due to severe bleeding. Thromb. Haemost. 101, 1044–1050 [PubMed] [Google Scholar]
- 26. Rannels S. R., Cancela L. L., Wolpert E. B., Price P. A. (1993) Matrix Gla protein mRNA expression in cultured type II pneumocytes. Am. J. Physiol. 265, L270-L278 [DOI] [PubMed] [Google Scholar]
- 27. Gilbert K. A., Rannels S. R. (2004) Matrix GLA protein modulates branching morphogenesis in fetal rat lung. Am. J. Physiol. Lung Cell Mol. Physiol. 286, L1179–1187 [DOI] [PubMed] [Google Scholar]
- 28. Cadavid J. C., DiVietro M. L., Torres E. A., Fumo P., Eiger G. (2011) Warfarin-induced pulmonary metastatic calcification and calciphylaxis in a patient with end-stage renal disease. Chest 139, 1503–1506 [DOI] [PubMed] [Google Scholar]
- 29. Stapleton A. M., Timme T. L., Ryall R. L. (1998) Gene expression of prothrombin in the human kidney and its potential relevance to kidney stone disease. Br. J. Urol. 81, 666–671; discussion 671–672 [DOI] [PubMed] [Google Scholar]
- 30. Grover P. K., Dogra S. C., Davidson B. P., Stapleton A. M., Ryall R. L. (2000) The prothrombin gene is expressed in the rat kidney: implications for urolithiasis research. Eur. J. Biochem. 267, 61–67 [DOI] [PubMed] [Google Scholar]
- 31. Zhu A., Sun H., Raymond R. M. (2007) Fatal hemorrhage in mice lacking γ-glutamyl carboxylase. Blood 109, 5270–5275 [DOI] [PMC free article] [PubMed] [Google Scholar]
- 32. Schurgers L. J., Spronk H. M., Soute B. A., Schiffers P. M., DeMey J. G., Vermeer C. (2007) Regression of warfarin-induced medial elastocalcinosis by high intake of vitamin K in rats. Blood 109, 2823–2831 [DOI] [PubMed] [Google Scholar]
- 33. Price P. A., Faus S. A., Williamson M. K. (1998) Warfarin causes rapid calcification of the elastic lamellae in rat arteries and heart valves. Arterioscler. Thromb. Vasc. Biol. 18, 1400–1407 [DOI] [PubMed] [Google Scholar]
- 34. Price P. A., Williamson M. K., Lothringer J. W. (1981) Origin of the vitamin K-dependent bone protein found in plasma and its clearance by kidney and bone. J. Biol. Chem. 256, 12760–12766 [PubMed] [Google Scholar]
- 35. Price P. A., Kaneda Y. (1987) Vitamin K counteracts the effect of warfarin in liver but not in bone. Thromb. Res. 46, 121–131 [DOI] [PubMed] [Google Scholar]
- 36. Hara K., Kobayashi M., Akiyama Y. (2005) Comparison of inhibitory effects of warfarin on γ-carboxylation between bone and liver in rats. J. Bone Miner. Metab. 23, 366–372 [DOI] [PubMed] [Google Scholar]
- 37. Binkley N., Krueger D., Engelke J., Suttie J. (2007) Vitamin K deficiency from long-term warfarin anticoagulation does not alter skeletal status in male rhesus monkeys. J. Bone Miner. Res. 22, 695–700 [DOI] [PubMed] [Google Scholar]
- 38. Oury F., Sumara G., Sumara O. (2011) Endocrine regulation of male fertility by the skeleton. Cell 144, 796–809 [DOI] [PMC free article] [PubMed] [Google Scholar]


