Abstract
Background
During carotid endarterectomy (CEA), hemodynamic stability and adequate fluid management are crucial to prevent perioperative cerebral stroke, myocardial infarction and hyperperfusion syndrome. Both pulse pressure variation (PPV) and stroke volume variation (SVV), dynamic preload indices derived from the arterial waveform, are increasingly advocated as predictors of fluid responsiveness in mechanically ventilated patients. The aim of this study was to evaluate the accuracy of PPV and SVV for predicting fluid responsiveness in patients undergoing CEA.
Methods
Twenty seven patients undergoing CEA were enrolled in this study. PPV, SVV and cardiac output (CO) were measured before and after fluid loading of 500 ml of hydroxyethyl starch solution. Fluid responsiveness was defined as an increase in CO ≥ 15%. The ability of PPV and SVV to predict fluid responsiveness was assessed using receiver operating characteristic (ROC) analysis.
Results
Both PPV and SVV measured before fluid loading are associated with changes in CO caused by fluid expansion. The ROC analysis showed that PPV and SVV predicted response to volume loading (area under the ROC curve = 0.854 and 0.841, respectively, P < 0.05). A PPV ≥ 9.5% identified responders (Rs) with a sensitivity of 71.4% and a specificity of 90.9%, and a SVV ≥ 7.5% identified Rs with a sensitivity of 92.9% and a specificity of 63.6%.
Conclusions
Both PPV and SVV values before volume loading are associated with increased CO in response to volume expansion. Therefore, PPV and SVV are useful predictors of fluid responsiveness in patients undergoing CEA.
Keywords: Arterial blood pressure, Cardiac output, Carotid endarterectomy, Fluid therapy, Stroke volume
Introduction
Carotid endarterectomy (CEA) is performed in patients with stenotic lesions of common carotid artery and its internal and external branches. Most of the patients undergoing CEA are old and have cardiovascular diseases such as hypertension, coronary artery disease and peripheral vascular disease [1]. In these patients, preoperative fasting and induction of general anesthesia may decrease intravascular volume, blood pressure, and organ perfusion pressure. Therefore, hypovolemia can increase the risk of cerebral ischemic or infarction, particularly in patients with severe stenosis of carotid artery. But excessive fluid administration also can produce complications such as postoperative hypertension and hyperperfusion syndrome resulting in worse neurologic outcomes [2]. Consequently, optimal monitoring of intravascular volume status is required to maintain intraoperative hemodynamic stability and prevent postoperative adverse outcomes.
Central venous pressure (CVP) and pulmonary capillary wedge pressure (PCWP) are conventionally advocated to assess circulating blood volume, but several studies have documented that these cardiac filling pressures cannot accurately reflect changes in preload [3] and reliably predict fluid responsiveness [4-6]. In addition, central venous catheterization for measurement of CVP or PCWP is not usually performed during CEA because major blood loss or fluid shift is rare and there are relatively high risks of accidental carotid artery puncture and embolization of thrombotic material or debris from the plaque resulting in stroke or transient neurologic symptoms [7].
On the other hand, arterial catheterization is routinely performed and the analysis of arterial pressure curve is still the simplest and most effective way to assess hemodynamic status during CEA [7]. Several studies found that dynamic variables derived from the arterial pressure waveform such as pulse pressure variation (PPV) and stroke volume variation (SVV) are reliable indicators for prediction of fluid responsiveness in mechanically ventilated patients with various clinical conditions [4,5,8].
Although predicting fluid responsiveness for optimal fluid management is essential to maintain cerebral and myocardial perfusion during CEA, research is sparse evaluating the validity of these dynamic preload indices to predict fluid responsiveness in patients with carotid artery stenosis. Therefore, we investigated the ability of PPV and SVV derived from radial arterial pressure to predict fluid responsiveness using receiver operating characteristics (ROC) curve analysis in patients undergoing CEA under general anesthesia.
Materials and Methods
This prospective study was approved by the Institutional Review Board of this hospital and written informed consent was obtained from each patients. We recruited into our study 27 American Society of Anesthesiologists physical status II-III patients undergoing CEA. Patients with a history of arrhythmia, significant valvulopathy, intracardiac shunt or pulmonary hypertension, left ventricular ejection fraction less than 40%, respiratory disorders that would result in high peak airway pressure were excluded. Patients with ABI (ankle brachial index) value ≤ 0.9 in one extremity on preoperative vascular tests were defined as peripheral artery disease patients [9]. After the patient arrived in operating room, basic anesthesia monitors including pulse oximetry, three-lead electrocardiography and non-invasive arterial pressure were applied. Anesthesia was induced with thiopental (4-5 mg/kg), and neuromuscular block was achieved using vecuronium bromide (0.1 mg/kg). After endotracheal intubation, lungs were mechanically ventilated using tidal volumes of 8 ml/kg of ideal body weight, an inspired oxygen fraction of 0.5, and no positive end-expiratory pressure. The respiratory rate was adjusted to maintain end-tidal carbon dioxide at 35 to 40 mmHg.
After induction of anesthesia, a 20 or 22 G arterial catheter was inserted into the radial artery. Arterial pressure was measured using the FloTrac transducer (Edwards Lifescience, Irvine, CA, USA) coupled both a Philips® IntelliVue MP70 monitor (Philips Medical Systems, Boeblingen, Germany) and Vigileo monitors (Edwards Lifescience, Irvine, CA, USA). The pressure transducer was zeroed at the mid-axillary level to atmospheric pressure. Automated PPV was measured by a Philips® IntelliVue MP70 monitor in the following manner [10], from the arterial pressure waveform alone with no need for airway pressure acquisition. The maximum pulse pressure (PPmax), minimum PP (PPmin), and mean PP (PPmean) are determined over a window of 8 second, and the values from four consecutive windows (32 seconds) measure the averaged PPV (%) as (PPmax - PPmin) / PPmean. An automated calculation of SVV was displayed in realtime by the FloTac/Vigileo system. The algorithm used in this study has been previously published [11,12]. The algorithm first assessed pulse pressure by calculating the standard deviation of the instantaneous arterial pressure (100 values per second over 20 seconds) around its mean value. The pulse pressure, and thus the standard deviation, is proportional to the SV, through a conversion factor which incorporates the effects of both resistance and compliance, via manually entered patient data and arterial waveform analysis. The SVV is then assessed using the following formula: SVV (%) = (SVmax - SVmin) / SVmean, where SVmax, SVmin, and SVmean are, respectively, the maximum, minimum, and mean SV determined by the system during a time window of 20 seconds. In our study, the values of automated PPV and SVV provided by the two monitors were recorded before and after fluid loading for statistical analysis. Cardiac output (CO) was calculated from SV × heart rate (HR) and used to discriminate responder (Rs) and non-responder (NRs) patients after fluid loading.
After the start of the operation and hemodynamic stabilization, fluid loading was performed with 500 ml of 6% hydroxyethyl starch solution (Voluven, Fresenius Kabi, Stans, Switzerland) within 10 minutes. Two sets of measurements were performed during the hemodynamically steady state without uses of vasoactive and inotropic drugs: the first before fluid loading and the second within 5 minutes after fluid expansion. HR, systolic blood pressure (SBP), diastolic blood pressure (DBP), mean arterial pressure (MAP), CO, PPV, and SVV were simultaneously recorded. Patients were regarded as Rs to fluid loading when CO increases were ≥ 15% or as NRs when CO increases were < 15% [10,13].
Statistical analyses were performed using SPSS 18.0 (SPSS Inc., an IBM Company, Illinois, USA). All hemodynamic data were analyzed as continuous variables and presented as mean ± SD. Normality of continuous variables was tested using the Shapiro-Wilk test. Continuous variables with normal distribution were tested using Student's t-test, paired t-test or Pearson's correlation analysis, whereas non-normally distributed variables were analyzed with Mann-Whitney test, Wilcoxon's signed rank test or Spearman correlation analysis. Therefore, the comparisons of HR, SBP, DBP, MAP, and SVV before fluid loading between Rs and NRs were analyzed using Student's t-test and the comparisons of CO and PPV before fluid loading between the two groups were analyzed using Mann-Whitney test. To compare before and after fluid loading within each group, a paired t-test was used for HR, SBP, DBP and MAP, and Wilcoxon's signed rank test was performed for PPV and SVV. The correlation between changes in CO response to fluid loading and PPV and SVV before fluid loading was assessed using Spearman's correlation coefficient. For the purpose of evaluating the ability of SVV and PPV to predict fluid responsiveness, areas under the ROC curves of responders (area under the curve [AUC] = 0.5: no prediction possible; AUC = 1.0: best possible prediction) were calculated and compared [14]. P < 0.05 were considered to be statistically significant.
Results
Twenty seven patients were initially enrolled in this study. Two patients were excluded from the analysis for newly developed cardiac arrhythmia during the study. The characteristics and preoperative findings of the 25 final studied patients are presented in Table 1. Fourteen patients were classified as Rs to fluid loading and eleven patients were defined as NRs. There were no significant differences in demographic data between the two groups.
Table 1.
Patient Characteristics and Preoperative Findings
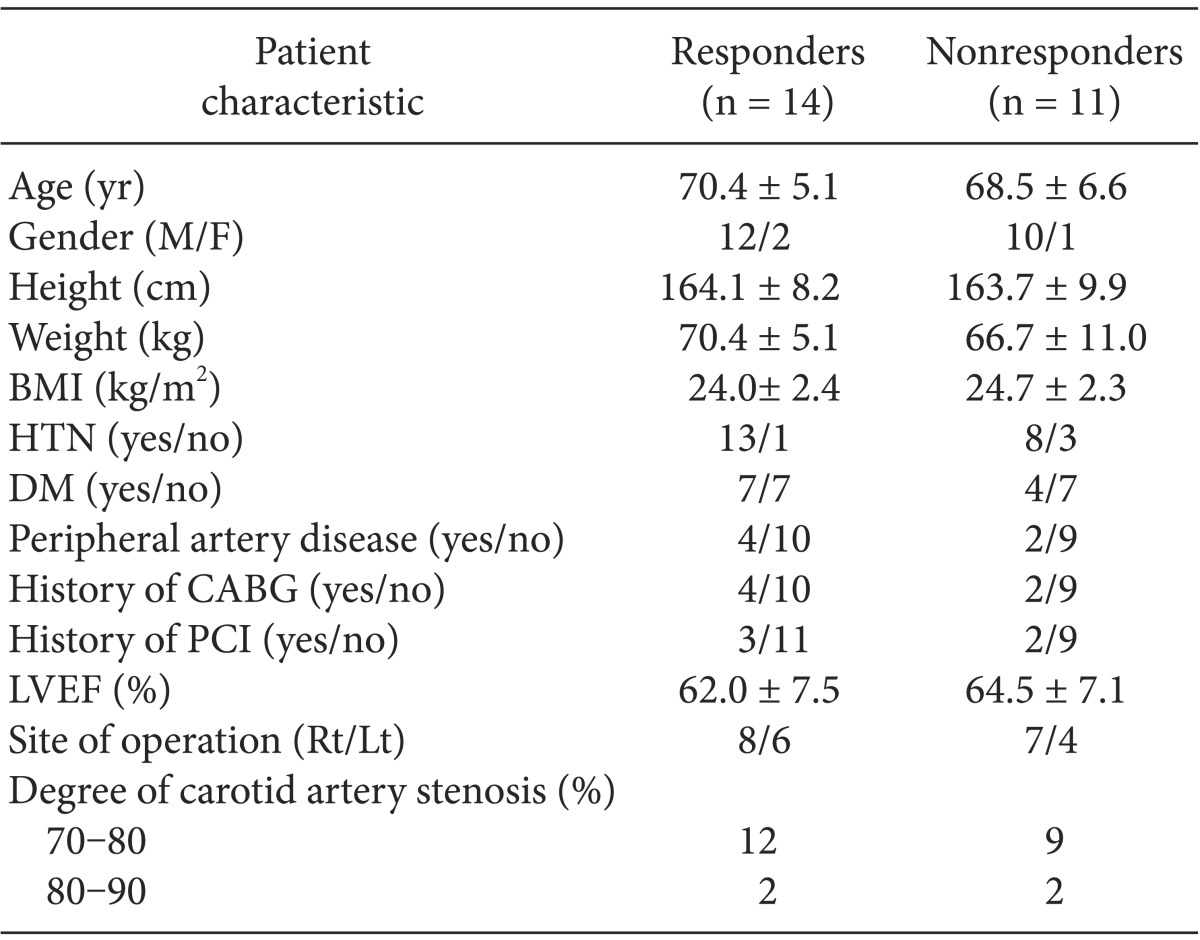
Data are presented as means ± SDs or the number. Responders were patients whose CO increased ≥ 15% after fluid loading; nonresponders were patients whose CO increased < 15% after fluid loading. BMI: body mass index, CABG: coronary artery bypass graft, PCI: percutaneous coronary artery intervention, LVEF: left ventricular ejection fraction.
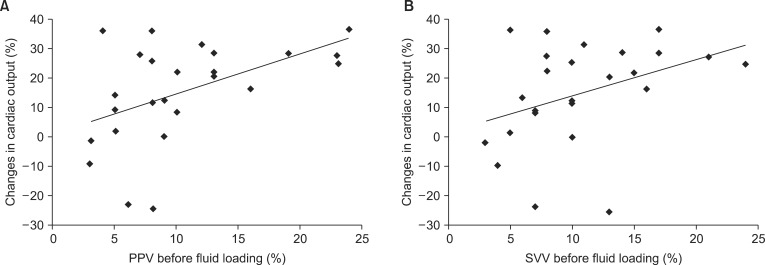
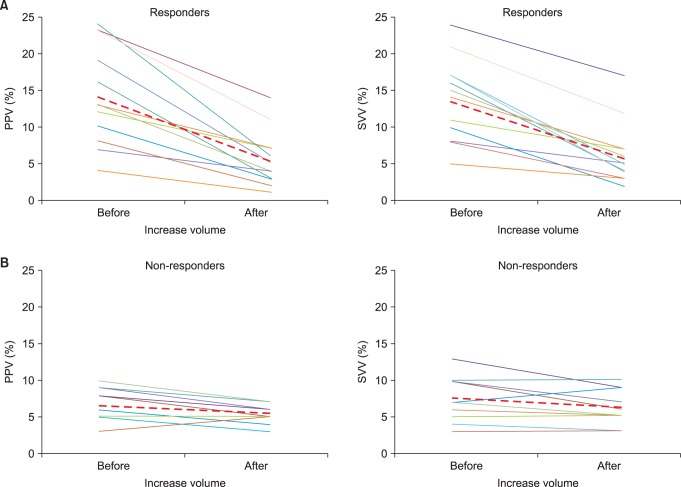
Hemodynamic variables in Rs and NRs before and after fluid challenge are outlined in Table 2. Before fluid loading, PPV and SVV were significantly higher in Rs than in NRs (13.8 ± 6.4 vs 6.5 ± 2.5 and 13.4 ± 5.4 vs 7.5 ± 3.0, respectively, P < 0.05 for all). There were no significant differences in other baseline hemodynamic data between Rs and NRs. PPV before and after fluid loading was strongly correlated with SVV before fluid loading (Spearman's correlation coefficient = 0.925 and 0.751, respectively, P < 0.05). As shown in Fig. 1, both PPV and SVV before fluid loading were correlated with the changes in CO induced by fluid expansion (Spearman's correlation coefficient = 0.480 and 0.435, respectively, P < 0.05 for both). After fluid loading, Rs showed significant decrease in PPV (13.8 to 5.3%) and SVV (13.4 to 5.9%) (Fig. 2A) and significant increase in CO. However, NRs showed no significant changes in PPV, SVV (Fig. 2B) and CO.
Table 2.
Hemodynamic Variables before and after Fluid Loading in Responders and Non-responders

Data are expressed as means ± SD. SBP: systolic blood pressure, DBP: diastolic blood pressure, MAP: mean arterial pressure, CO: Cardiac output, PPV: pulse pressure variation, SVV: stoke volume variation. *P value: before and after volume expansion in responders, †P value: before and after volume expansion in non-responders, ‡P value: before volume expansion in responders and non-responders. §P value < 0.05 in comparison with the values before fluid loading in responders. ∥P value < 0.01 in comparison with the responder values before fluid loading. There were significant differences in PPV and SVV before fluid loading between responders and non-responders. There were significant decrease in PPV and SVV and significant increase in cardiac output after fluid expansion in responders.
Fig. 1.
Relationships between the percentage changes in cardiac output related to fluid loading and PPV before fluid loading (A), SVV before fluid loading (B). Spearman's correlation coefficients (ρ) for PPV and SVV were 0.480 and 0.435, respectively. PPV: pulse pressure variation, SVV: stoke volume variation.
Fig. 2.
The PPV and SVV before and after fluid loading in the responders (A) and nonresponders (B). Each line delineates changes of raw values for PPV and SVV before and after PPV and SVV in each patient. Red dotted line represents mean values (SD) for PPV and SVV before and after fluid loading. The mean values (SD) for PPV and SVV before fluid loading were 13.8 (6.4) and 13.4 (5.4) and the mean values (SD) for PPV and SVV after fluid loading were 5.3 (3.6) and 5.9 (4.0) in responders. The mean values (SD) for PPV and SVV before fluid loading were 6.5 (2.5) and 7.5 (3.0) and the mean values (SD) for PPV and SVV after fluid loading were 5.5 (1.6) and 6.2 (2.6) in non-responders. PPV: pulse pressure variation, SVV: stoke volume variation.
In addition, the AUC and ROC curve of PPV and SVV, showing the ability of the hemodynamic parameters to discriminate between Rs and NRs, are presented in Table 3 and Fig. 3, respectively. There was no significant difference between the AUC of PPV and SVV (0.854 vs 0.841, respectively, P < 0.05 for both). A PPV ≥ 9.5% identified Rs with a sensitivity of 71.4% and a specificity of 90.9%, and a SVV ≥ 7.5% identified Rs with a sensitivity of 92.9% and a specificity of 63.6% (Fig. 4).
Table 3.
ROC Analysis of Baseline PPV and SVV as Predictions of CO Increase ≥ 15% after Fluid Loading in Patients Undergoing Carotid Endarterectomy

ROC: receiver operating characteristic. AUC: areas under the receiver operating characteristic curve, PPV: pulse pressure variation, SVV: stoke volume variation, CO: Cardiac output, AUC: areas under the receiver operating characteristic curve. *P value < 0.01, There was no significant difference between the AUC of PPV and SVV.
Fig. 3.
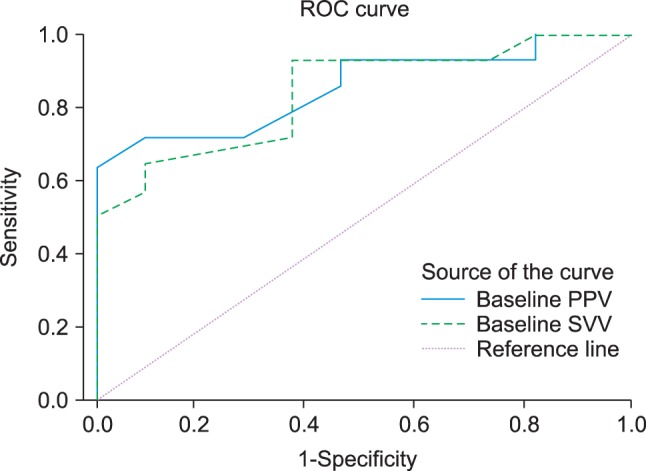
ROC curves comparing the ability of PPV and SVV before fluid loading to discriminate between responders and non-responders. ROC: receiver operating characteristic, PPV: pulse pressure variation, SVV: stoke volume variation.
Fig. 4.
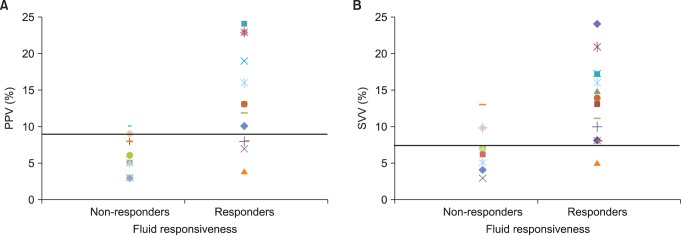
Dot diagram plot for (A) PPV and (B) SVV of responders (Rs) and non-responders (NRs). Each symbol represents individual values of PPV and SVV before fluid loading. Horizontal straight line represents the optimal threshold values in predicting fluid responsiveness. A PPV ≥ 9.5% identified Rs with a sensitivity of 71.4% and a specificity of 90.9%, and a SVV ≥ 7.5% identified Rs with a sensitivity of 92.9% and a specificity of 63.6%. PPV: pulse pressure variation, SVV: stoke volume variation.
Discussion
Our study demonstrated that both PPV and SVV could be used to predict the effects of volume expansion in patients undergoing CEA with carotid artery stenosis. In addition, an increase in CO response to volume expansion was associated with a decrease in both PPV and SVV.
Because patients undergoing CEA are at risk of adverse cardiovascular events that may lead to perioperative cerebral infarction and exacerbation of coronary artery disease including myocardial infarction, several studies have examined methods to maintain hemodynamic stability have been performed. Jellish et al. [15] proposed that total intravenous anesthetic technique using remifentanil and propofol provides the greater hemodynamic stability, lesser myocardial ischemia, and better postoperative outcomes than inhalational technique using isoflurane and small dose fentanyl during CEA. Lee et al. [16] showed that intravascular volume expansion with a colloid solution reduces the need for vasopressor drugs during prereperfusion period. However, to our knowledge, there were few studies concerning reliable indicators for optimizing intraoperative volume status during CEA. Because excessive volume administration as well as hypovolemia would be extremely detrimental during CEA, studies about precise indicators of intravascular volume status are required to detect who may benefit from fluid challenge or not. Among several monitoring for measuring intravascular volume status, PPV and SVV can be measured using intra-arterial catheter that is routine monitoring during CEA. Furthermore, new devices such as FloTrac/Vigileo and Intellivue MP monitor have been introduced for automated and continuous measurement of either PPV or SVV by peripheral arterial line [10-12]. In the present study, PPV and SVV were automatically and continuously measured using these two new devices and the authors found that the PPV and SVV are accurate predictors of fluid responsiveness in patients with carotid artery stenosis. The results of the present study were in accordance with two recent studies that investigated and compared accuracy of PPV and SVV in predicting the effects of fluid challenge in patients with hemodynamic instability during major abdominal surgery and in septic shock patients, respectively [17,18].
ROC analysis was performed to evaluate diagnostic accuracy of PPV and SVV for discriminating between the Rs and the NRs. AUC is the most frequently used ROC index and interpreted as the average value of sensitivity for all possible values of specificity. According to an earlier study evaluating the diagnostic accuracy of two dynamic preload indices in mechanically ventilated patients after liver transplantation, both PPV and SVV were reliable predictors for predicting the effects of fluid challenge with the AUC values of 0.98 and 0.95, respectively [10]. Our diagnostic accuracy of two dynamic variables with AUC of 0.854 and 0.841 were considered to have good diagnostic accuracy.
In several previous studies that evaluated the ability of PPV and SVV for predicting fluid responsiveness, patients with extensive peripheral vascular disease have been excluded from participants of studies [17-19]. Also, a review article suggested that SVV cannot be used in patients with condition such as peripheral vascular disease [20]. However, patients with carotid artery stenosis are high risk patients for peripheral vascular diseases. In present study, some of patients undergoing CEA actually had peripheral vascular disease as well as carotid artery stenosis. These patients were included in the study to evaluate the ability of PPV and SVV as preload indicators. Optimal threshold values in predicting fluid responsiveness were 9.5% for PPV and 7.5% for SVV in our study and our threshold values were lower than thresholds values of other studies that investigated the validity of PPV and SVV to predict fluid responsiveness [17,18]. Although precise mechanisms are unknown, inclusion of the patients with peripheral vascular disease to subjects of study may lead to our lower threshold values discriminating Rs and NRs.
In regard to the only intravascular volume status, PPV is more cost-effective than SVV, because the transducer for SVV measurement is costly. Therefore, if the appropriate monitor is available, PPV could be the preferred preload indicator particularly in patients with preserved ventricular systolic function.
There are several limitations to our study. First, the authors did not evaluate the effectiveness of PPV and SVV in predicting fluid responsiveness in comparison with those of CVP and PCWP. Second, Rs and NRs to volume expansion were defined by CO obtained through Vigileo systems (CO-Vigileo). We did not use pulmonary artery catheter (PAC) or transthoracic echocardiography (TTE) to measure CO, because they were not usually suitable during CEA. However, Biais et al. [10] reported that there are significant correlations between the changes in CO-Vigileo and the changes in CO-TTE and in CO-PAC. Finally, the authors did not evaluate the accuracy of PPV and SVV to predict fluid responsiveness according to existence of peripheral vascular disease.
In conclusion, our findings suggest that both PPV and SVV can be useful predictors of increased CO in response to volume expansion in patients with carotid artery stenosis undergoing CEA under general anesthesia. Additional study remains to be done whether goal directed fluid management on the reference to the estimation of these dynamic indicators derived from the arterial pressure waveform may lead to improvement of the postoperative outcomes in patients undergoing CEA.
Footnotes
This article is a Master's Thesis by Kyung Mi Kim.
References
- 1.Ederle J, Dobson J, Featherstone RL, Bonati LH, van der Worp HB, de Borst GJ, et al. Carotid artery stenting compared with endarterectomy in patients with symptomatic carotid stenosis (International Carotid Stenting Study): an interim analysis of a randomised controlled trial. Lancet. 2010;375:985–997. doi: 10.1016/S0140-6736(10)60239-5. [DOI] [PMC free article] [PubMed] [Google Scholar]
- 2.Wilke HJ, 2nd, Ellis JE, McKinsey JF. Carotid endarterectomy: perioperative and anesthetic considerations. J Cardiothorac Vasc Anesth. 1996;10:928–949. doi: 10.1016/s1053-0770(96)80060-7. [DOI] [PubMed] [Google Scholar]
- 3.Kumar A, Anel R, Bunnell E, Habet K, Zanotti S, Marshall S, et al. Pulmonary artery occlusion pressure and central venous pressure fail to predict ventricular filling volume, cardiac performance, or the response to volume infusion in normal subjects. Crit Care Med. 2004;32:691–699. doi: 10.1097/01.ccm.0000114996.68110.c9. [DOI] [PubMed] [Google Scholar]
- 4.Michard F, Boussat S, Chemla D, Anguel N, Mercat A, Lecarpentier Y, et al. Relation between respiratory changes in arterial pulse pressure and fluid responsiveness in septic patients with acute circulatory failure. Am J Respir Crit Care Med. 2000;162:134–138. doi: 10.1164/ajrccm.162.1.9903035. [DOI] [PubMed] [Google Scholar]
- 5.Michard F, Teboul JL. Predicting fluid responsiveness in ICU patients: a critical analysis of the evidence. Chest. 2002;121:2000–2008. doi: 10.1378/chest.121.6.2000. [DOI] [PubMed] [Google Scholar]
- 6.Osman D, Ridel C, Ray P, Monnet X, Anguel N, Richard C, et al. Cardiac filling pressures are not appropriate to predict hemodynamic response to volume challenge. Crit Care Med. 2007;35:64–68. doi: 10.1097/01.CCM.0000249851.94101.4F. [DOI] [PubMed] [Google Scholar]
- 7.Ellis JE, Roizen MF, Mantha S, Schwarze ML, Lubarsky DA, Kenaan CA. Anesthesia for vascular surgery. In: Barash PG, Cullen BF, Stoelting RK, editors. Clinical anesthesia. 5th ed. Philadelphia: Lippincott Williams & Wilkins; 2006. pp. 933–973. [Google Scholar]
- 8.Berkenstadt H, Margalit N, Hadani M, Friedman Z, Segal E, Villa Y, et al. Stroke volume variation as a predictor of fluid responsiveness in patients undergoing brain surgery. Anesth Analg. 2001;92:984–989. doi: 10.1097/00000539-200104000-00034. [DOI] [PubMed] [Google Scholar]
- 9.Signorelli SS, Anzaldi M, Fiore V, Simili M, Puccia G, Libra M, et al. Patients with unrecognized peripheral arterial disease (PAD) assessed by ankle-brachial index (ABI) present a defined profile of proinflammatory markers compared to healthy subjects. Cytokine. 2012;59:294–298. doi: 10.1016/j.cyto.2012.04.038. [DOI] [PubMed] [Google Scholar]
- 10.Biais M, Nouette-Gaulain K, Cottenceau V, Revel P, Sztark F. Uncalibrated pulse contour-derived stroke volume variation predicts fluid responsiveness in mechanically ventilated patients undergoing liver transplantation. Br J Anaesth. 2008;101:761–768. doi: 10.1093/bja/aen277. [DOI] [PubMed] [Google Scholar]
- 11.Manecke GR. Edwards FloTrac sensor and Vigileo monitor: easy, accurate, reliable cardiac output assessment using the arterial pulse wave. Expert Rev Med Devices. 2005;2:523–527. doi: 10.1586/17434440.2.5.523. [DOI] [PubMed] [Google Scholar]
- 12.Manecke GR, Jr, Auger WR. Cardiac output determination from the arterial pressure wave: clinical testing of a novel algorithm that does not require calibration. J Cardiothorac Vasc Anesth. 2007;21:3–7. doi: 10.1053/j.jvca.2006.08.004. [DOI] [PubMed] [Google Scholar]
- 13.Reuter DA, Felbinger TW, Schmidt C, Kilger E, Goedje O, Lamm P, et al. Stroke volume variations for assessment of cardiac responsiveness to volume loading in mechanically ventilated patients after cardiac surgery. Intensive Care Med. 2002;28:392–398. doi: 10.1007/s00134-002-1211-z. [DOI] [PubMed] [Google Scholar]
- 14.Hanley JA, McNeil BJ. A method of comparing the areas under receiver operating characteristic curves derived from the same cases. Radiology. 1983;148:839–843. doi: 10.1148/radiology.148.3.6878708. [DOI] [PubMed] [Google Scholar]
- 15.Jellish WS, Sheikh T, Baker WH, Louie EK, Slogoff S. Hemodynamic stability, myocardial ischemia, and perioperative outcome after carotid surgery with remifentanil/propofol or isoflurane/fentanyl anesthesia. J Neurosurg Anesthesiol. 2003;15:176–184. doi: 10.1097/00008506-200307000-00004. [DOI] [PubMed] [Google Scholar]
- 16.Lee JJ, Kim GH, Kim GS, Lee BD. The effects of intravascular volume expansion on the stability of hemodynamic responses in patients undergoing carotid endarterectomy. Korean J Anesthesiol. 2004;47:351–355. [Google Scholar]
- 17.Derichard A, Robin E, Tavernier B, Costecalde M, Fleyfel M, Onimus J, et al. Automated pulse pressure and stroke volume variations from radial artery: evaluation during major abdominal surgery. Br J Anaesth. 2009;103:678–684. doi: 10.1093/bja/aep267. [DOI] [PubMed] [Google Scholar]
- 18.Khwannimit B, Bhurayanontachai R. Prediction of fluid responsiveness in septic shock patients: comparing stroke volume variation by FloTrac/Vigileo and automated pulse pressure variation. Eur J Anaesthesiol. 2012;29:64–69. doi: 10.1097/EJA.0b013e32834b7d82. [DOI] [PubMed] [Google Scholar]
- 19.Lahner D, Kabon B, Marschalek C, Chiari A, Pestel G, Kaider A, et al. Evaluation of stroke volume variation obtained by arterial pulse contour analysis to predict fluid responsiveness intraoperatively. Br J Anaesth. 2009;103:346–351. doi: 10.1093/bja/aep200. [DOI] [PubMed] [Google Scholar]
- 20.Zhang Z, Lu B, Sheng X, Jin N. Accuracy of stroke volume variation in predicting fluid responsiveness: a systematic review and meta-analysis. J Anesth. 2011;25:904–916. doi: 10.1007/s00540-011-1217-1. [DOI] [PubMed] [Google Scholar]


