Abstract
Wavelength dependent study of a laser dye: Rhodamine-6G (Rh6G) by using spectrally resolved photon-echo spectroscopy is presented. The coherence and population dynamics of Rh6G solution in methanol changes as the excitation wavelength is tuned near its absorption maxima of 528 nm. Specifically, the central wavelength of the femtosecond laser pulse was set to 535 nm and to 560 nm while the respective spectra of the photon-echo signals were collected. This gives information on how the ultrafast dynamics of the Rh6G molecule changes with a change in the excitation wavelength.
Keywords: Rhodamine-6G, Photon-echo spectroscopy, Coherence, Population dynamics
1. Introduction
Multiple laser pulses at specific delays incident on any nonlinear media can induce a nonlinear polarization, which establishes a definite phase relationship (i.e., coherence) between the ground and excited states [1-3]. Such induced polarization has detailed information about the dynamics of the molecule in time as well as in the frequency domain. The laser pulses can modulate and probe the phase relationship between these interacting states. This phase relationship is strongly dependent on the molecular environment, electronic vibrational coupling and the structure of the molecule. Multiple sets of energy levels in the vibrational manifold can be excited and probed by using different wavelengths of pump and probe pulses. A study of the photo-induced dynamics of the molecule can be performed by changing the pump and probe wavelength as the redistribution of electrons within the vibrational manifold depends on their position in the energy ladder. By applying multiple femtosecond pulses on the system with independent time delays, one can extract their complex dynamical and spectroscopic information, such as, population relaxation time, dephasing time (homogeneous broadening), inhomogeneous broadening and vibrational structure of the transient species [4,5]. Any experimental scheme for eliminating inhomogenous broadening is often referred to as a photon-echo experiment. By temporally and spectrally resolving the photon-echo signal, one can determine the nonlinear polarization induced in a sample by three consecutive or instantaneous femtosecond pulses. The electronic dynamics of the ground and excited states can be investigated by suitable selection of wavelengths of the three laser pulses, which allows different sets of energy levels to be selected. Such ultrafast nonlinear coherent spectroscopic technique has several important applications as it has the potential to overcome the effects of inhomogeneous broadening and can remove spectral congestion to isolate features associated with intermolecular rearrangements.
The spectral measurement of photon-echo signal gives amplitude information at each frequency. However, this slow detection process does not allow the phase to be recorded at each frequency. To overcome this, in four-wave-mixing experiments, the generated signal is mixed with a local oscillator pulse to get complete information about the evolution of the system during the third time interval through a heterodyne temporal detection or by mixing the signal with a local oscillator in a monochromator to result in spectral interferometry. The absolute phase of the generated signal is not needed for investigating the dynamics of the molecular processes. A complete characterization of the amplitude and phase of the photon-echo signal through heterodyne detection or through spectral interferometry while scanning the coherence time can result in the coherent two-dimensional spectra [6-11].
In this paper, we apply the spectrally resolved photon-echo (SRPE) technique to Rhodamine-6G (Rh6G) to characterize its coherence and population dynamics. The Rh6G is known to undergo rapid intra-band population relaxation although it has a long excited state lifetime of the order nanoseconds depending on solvents [12,13]. Although the presence of rapid intra-band population relaxation is not quite ideal for comparing theoretical results [4,5] with our experimental results, Rh6G is still a very good example to illustrate the advantages of spectrally resolving the transient grating signal. Additionally, Rh6G is a very commonly used laser dye, a biological fluorescence marker, as well as a fluorescence quantum yield standard [14-24]. Before getting into the details of the experimental nonlinear study on Rh6G, let us first discuss the important linear spectroscopic details of Rh6G.
2. Absorption spectroscopy of Rh6G in methanol
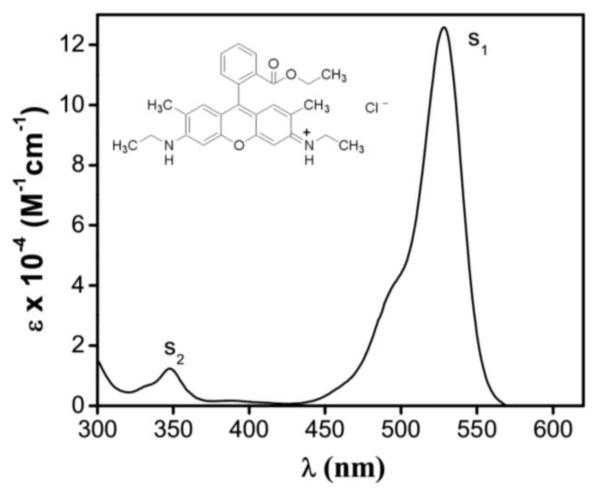
The steady-state absorption spectrum of Rh6G in methanol is shown in Figure 1. Laser fluence dependent study of fluorescence quantum yield for Rh6G in methanol was performed by using a photo-thermal method [25], where Rh6G was considered as a simple two-level electronic system with singlet ground and excited states. Three different timescales were used in this simple model for explaining the experimental results: (a) an excited state lifetime (T1e), (b) an effective dephasing time (T2) and (c) a vibrational (intraband) relaxation time (T1υ). Both T1e and T1υ were found to be dependent on the fluence of the applied pulses and their proposed timescales were: 2×10⁻⁹ s > T1e > 0.35×10⁻⁹ s and 10−12 s > T1υ > 2×10− s, when T2 was set to 30 fs based on previously measured T2 timescales of 70–90 fs for Rhodamine dyes in different solvents using four-wave-mixing experiments [26]. These time-resolved photon-echo experiments discussed until now are distinct from our spectrally resolved three-pulse photon-echo experiments that we discuss next.
Figure 1.
Absorption spectrum of Rhodamine 6G (Rh6G) in methanol. Inset shows the molecular structure of Rh6G.
The advantages of the three pulse photon-echo spectra [5] lies in the fact that it contains information about the optical dephasing, T2, which decays rapidly with increase in the coherence time, t12, and the line-broadening factor that includes inhomogeneous broadening, T2*. In addition, information about the population relaxation, T1 is also contained in this echo signal.
3. Experimental Details
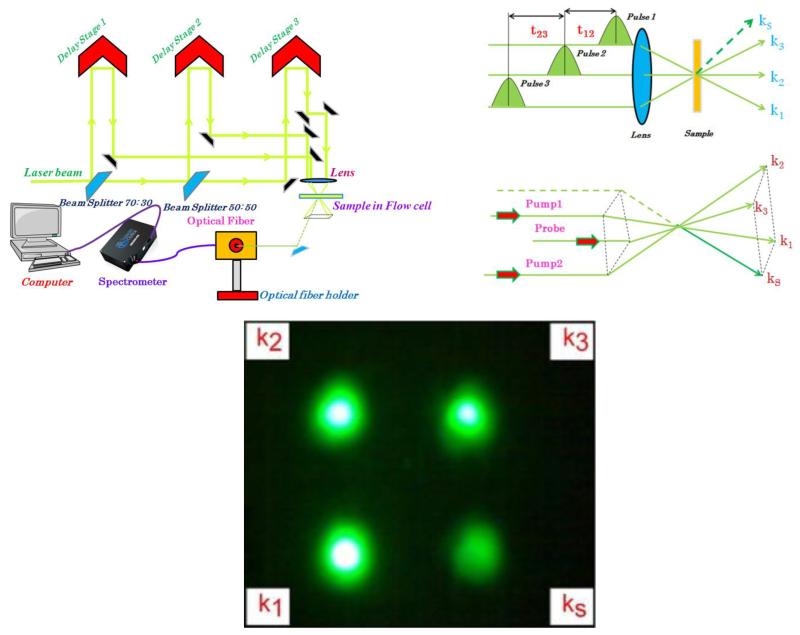
For our experiments, the Rh6G was purchased from Sigma Aldrich and dissolved in methanol in 10−4 molar concentration. We used a commercial Ti: Sapphiremulti-pass amplifier (ODIN, Quantronix Corp.) that was pumped by a Nd:YAGlaser operating at 1 KHz (Corona, Coherent Inc.). This amplified laser was seeded by a 94 MHz train of Ti: Sapphire oscillator pulses having a pulse width of 20 fs at 800 nm. The amplified laser generated 1 kHz pulses with a pulse-width of 40 fs at the central wavelength of 806 nm. This amplified pulse was used to pump a commercial computer-controlled travelling-wave optical parametric amplifier (TOPAS, Light Conversion Ltd.). In the optical parametric amplifier (OPA), a small fraction of the pump from multi-pass amplifier was used to generate the parametric super fluorescence seed in a thick beta barium borate (BBO) crystal. The OPA generated pulses with 50 fs pulse-width that were tuneable across the visible region of the spectrum. The output of the OPA is divided into three-beams of nearly equal intensity and focused in a square or box-car geometry into a flow-cell having a path-length of 0.2 mm, from where the echo signal appears at the fourth corner of the square (Figure 2). This echo signal is collected through an optical fibre-coupled Ocean-optics Spectrometer (HR-2000).
Figure 2.
Boxcar phase matching geometry of the four-wave mixing experiment. Three parallel beams, pump 1, pump 2 and probe are arranged parallel to each other so that the laser spots form the three corners of a rectangle in a plane perpendicular to their path. A lens with axis passing through the center of this rectangle is used to focus the beams onto the sample under study. Diffracted beam emerges along the fourth corner of the square.
The centre-wavelengths of the OPA were tuned to 560 nm and at 535 nm while collecting the data from the Rh6G solution in methanol. As shown in Figure 1, Rh6G solution in methanol has its S1 absorption peak at 528 nm. Let us now discuss the necessary theoretical framework required for explaining our experimental results.
4. Theoretical background
Photon-echo experiments are based on non-collinear four-wave-mixing geometry with a specific phase matching condition, where the incident beams propagate non-collinearly as shown in Figure 2. In our experiment, three pulses with electric field Ej(t) having central frequency ωj that is associated with the wave vector skj, where j = 1, 2, and 3, are focused on the sample in box-car geometry. The first pulse k1 creates a coherence between the ground and the excited states beyond which the dephasing process starts; the second pulse k2 interacts with the freely evolving system giving rise to a population grating in the space either in the ground or the excited states, whose spacing depends on the time interval between the first and second pulse, i.e. coherence time t12. The third pulse k3 puts the system back in the second coherent state and this time duration between the second the third pulse gives the population time t23. After rephasing, the photon-echo signal is generated in the direction: ks = −k1+k2+k3. The noncollinearity of the geometry leads to a spatially separated photon-echo signal. The total external field E (t) for such four-wave mixing interaction is given by:
| (1) |
wherer is the position vector. However, for the generated signal, we are more interested in the third-order nonlinear polarization P(3), which is related to the corresponding response function R(3) through the relation [10]:
| (2) |
The nonlinear response function R(3)is a linear combination of the rephasing (Ra) and non-rephasing (Rb) response of the macroscopic dipole moment
| (3) |
| (4a) |
| (4b) |
where R1 to R4 and their complex conjugates are nonlinear response functions.
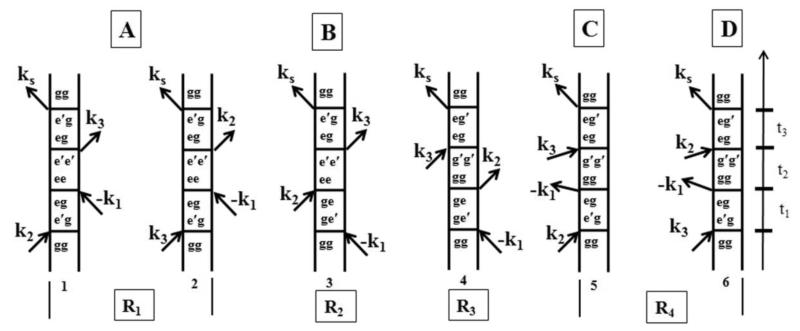
In order to understand our three-pulse photon-echo experiments, it is useful to invoke the nonlinear optical response theory involving the Feynman diagram, which explains these nonlinear response functions. Figure 3 (diagrams 1 to 4.1) shows the Feynman diagrams representing the possible three-pulse interactions for the phase-matching direction [5]. Here, the vertical lines represent the time evolution of the ket and bra of the density matrix and the time evolution is from the bottom to top. Interactions with the light are represented by arrows. An arrow pointing towards the system represents absorption, while an arrow pointing away from the system represents a de-excitation. Each diagram in Figure 3 has a sign (−1)n, where n is the number of interactions from the right side of the Feynman diagram (the bra side). When an arrow points to the right, it represents the contribution of the electric field E(t)exp(− iωt + ik.r) to the polarization while an arrow pointing to the left represents an electric field E*(t)exp(+iωt – ik.r) contribution. The emitted light, i.e., the last interaction resulting in the fourth pulse, has a frequency and wave vector corresponding to the sum of the input frequencies and wave vectors considering appropriate signs. Let us consider the simplest case of a two-level system with ground state S0 comprising of two vibrational levels ∣g〉 and ∣g’〉 and an excited state S1 with two vibrational levels ∣e〉 and ∣e’〉. When the time ordering of the pulses is k1, k2, k3 (Figure 3: diagrams 2, 3) and the three laser pulses are tuned to ∣g〉→∣e’〉, the first pulse k1 creates optical coherences ρ=∣e〉〈g∣ and ρ=∣g〉〈e∣ and the second pulse k2 generates population in the excited state ρ=∣e’〉〈e’∣ (diagram 2) or a second-order population in the ground state ρ=∣g’〉〈g’∣ (diagram 4), which are both coupled to ρ=∣g〉〈e’∣ and ρ=∣e’〉〈g∣. The third pulse k3 converts the populations back into optical coherences ρ=∣g〉〈e’∣ and ρ=∣e’〉〈g∣, in which the phases of the frequency components are opposite to those of the initial optical coherence contributions resulting in the photon-echo signal. This photon-echo signal is produced by the rephasing of the macroscopic polarization at time period t=t12 after the third pulse in the phase matching direction ks=−k1+k2+k3 for an inhomogeneously broadened ensemble. For any two level-system with inhomogeneous broadening, there is a Gaussian distribution given by [1]
| (5) |
where Γ is 1/e half-width. The relevant nonlinear response functions for these pathways are R2 and R3. R1 and R2 describe the evolution of the excited state population during t23 while R3 and R4 describe the evolution of the ground state population. When the first interaction is k2 (diagrams 1.1, 4.1) the third pulse creates a contribution to the optical coherences (ρ=∣e’〉〈g∣ and ρ=∣e’〉〈g∣) and in which the phases of first coherent state is same as that of second coherent state, resulting in a free induction decay signal. The nonlinear response functions in this case are R1 and R4. The free induction decay (FID) signal would have peaked at negative delay times for an inhomogeneous system. The nonlinear response function is given by:
| (6a) |
| (6b) |
where ω12 is the transition frequency, γ12=1/T2 and γ1= 1/T1, T1 is the lifetime of excited state and T2 is the dephasing time of the transition. The measured nonlinear signal is given by:
| (7) |
Figure 3.
Double sided Feynman diagram: The response function corresponding to the phase matching direction ks=−k1+k2+k3 are shown as Feynman diagrams. An arrow pointing to the right represents the contribution of E(t)exp(−iωt + ik.r) to the third order polarization and an arrow pointing to left represents E*(t)exp (+iωt − ik.r) contribution.
We assume the signal in the direction with frequency ks = k3 + k2 − k1 with frequencyωs= ω1 = ω2 = ω3. The spectrum of the signal gives information about the dynamics of the molecule. The frequency domain third order nonlinear polarization is obtained by the Fourier transformation of P(3)in the temporal domain, i.e.
| (8) |
The frequency domain representation of the field radiated by the polarization P(3) is given by:
| (9) |
Where n(ω) is the real part of the refractive index of the sample at frequency ω and l is the length of the sample and c is the speed of light. The intensity of the SRPE signal is then given by [11]:
| (10) |
Where λd is the wavelength detected by the spectrometer.
The population grating is formed by the spatially periodic intensity pattern that is formed by a temporal overlap of the first pulse with the second pulse in the sample. For two level systems, a physical picture based on scattering of the third pulse from this grating induced by the two pulses is useful [27]. The detected spectrum can be written in the form:
| (11) |
where η(λd, t12, t23) is the efficiency of the population grating which is proportional to the [exp(−t23/τlife) – exp(−t23/τrise)], where τrise and τlife are the respective rise-time and lifetime of the population grating, and IPR(λd)is the spectral density of the probe pulse.
5. Results and Discussion
As mentioned in the last section on theoretical framework, our experiments essentially measure SD(λd, t12, t23) as given by eqn. (11), which is the experimental spectra over λd wavelengths, collected either as a function of population time (t23) for various fixed coherence times (t12), or vice versa (Figures 4-7). For our data analysis, we have taken the lifetime of the population grating as the recovery time of the ground state, which is very long for the Rhodamine dyes (typically >100 ps). As expected from the previous section, for all our experimental data at short t23, a broadening on both the sides of the spectrum is observed when the lifetime of both the excited levels is short and photon-echo makes a large contribution to the signal. In fact, the theoretical calculations with short lifetimes for both excited levels reveal the obvious result that the shorter excitation wavelength involves higher excited-state vibrational levels. The broadening of the photon-echo spectrum on the long wavelength side can be seen at short timescales if the lifetime of the lower excited state is long. Specifically, at zero time delay irrespective of coherence or population time, the spectra mainly exhibit FID component along with weak photon-echo and population grating components, which arise from the temporal overlap of the first two pulses. For a positive direction of t23, the spectra show a strong photon-echo signal, both with changing t23 as well as with varying t12. The population grating components exhibit a red-shift in wavelength and an increased broadening in the spectra for excitation wavelengths close to maximum absorption. An increase in red-shift with increasing t23 reflects the dynamics of the population. Finally, an integrated plot for all the collected data is presented in Figure 8, where oscillating quantum beat resulting from vibrational coherences generated by femtosecond laser pulses are also observed. For most of our data analysis, however, excepting at zero delays (irrespective of t23,t12), there is no non-zero contribution of η(λd, t12, t23), so we can safely use eqn. (10) for our data analysis and focus on the SRPE characteristics.
Figure 4.
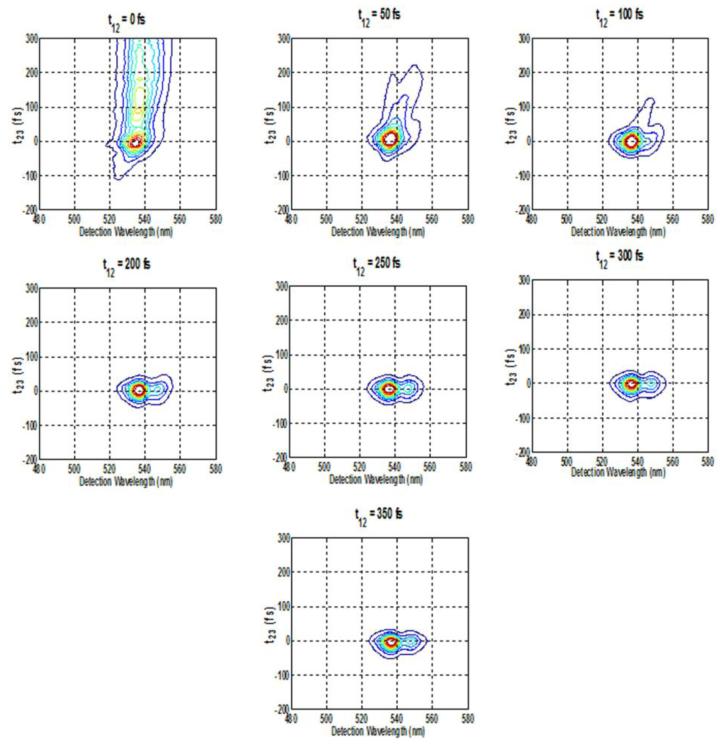
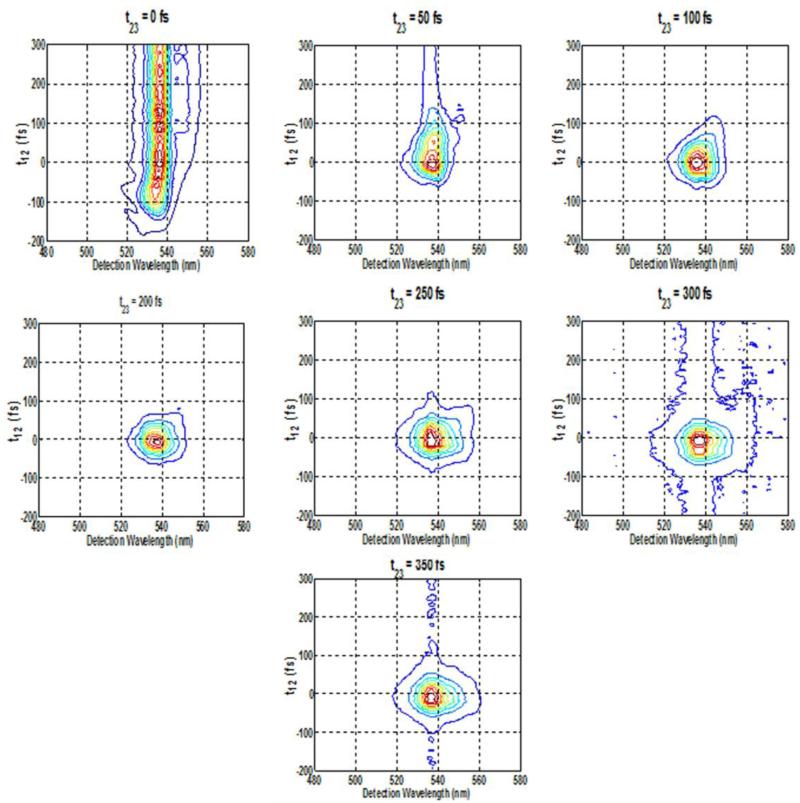
Spectrally resolved photon-echo plots of Rh6G for varying population times at fixed coherence times of A. 0 fs , B. 50 fs, C. 100 fs, D. 200 fs, E. 250 fs, F. 300 fs, G. 350 fs, with excitation wavelength at 535 nm.
Figure 5.
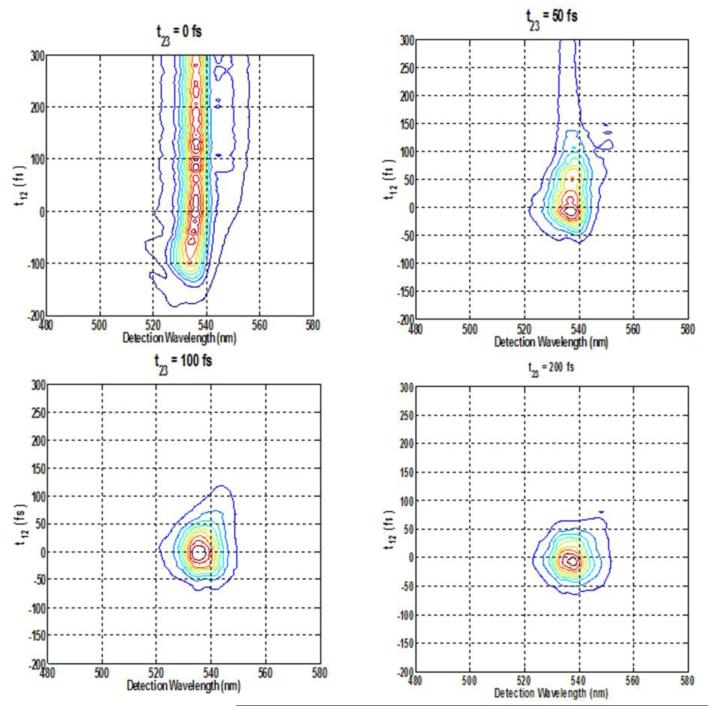
Spectrally resolved photon-echo plots of Rh6G for varying coherence times at fixed population times of: A. 0 fs, B. 50 fs, C. 100 fs, D. 200 fs, E. 250 fs, F. 300 fs, G. 350 fs, with excitation wavelength at 535 nm.
Figure 6.
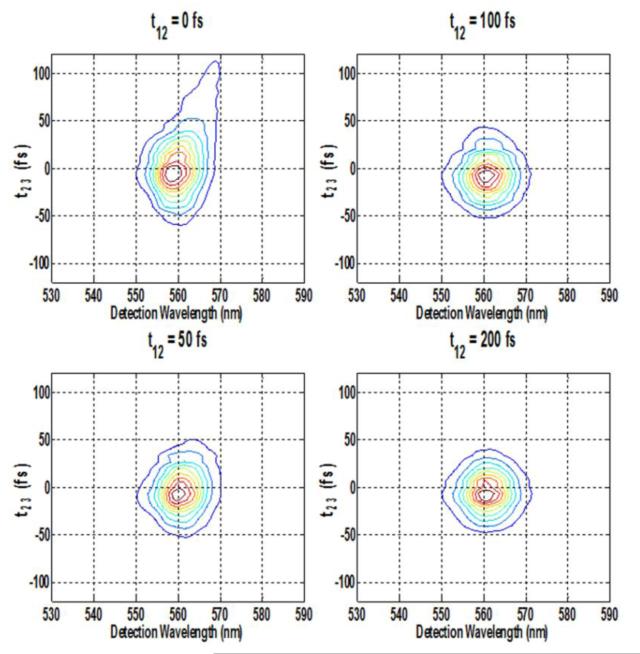
Spectrally resolved photon-echo plots of Rh6G for varying population time s at fixed coherence times of: A. 0 fs, B. 50 fs, C. 100 fs, D.200 fs, with excitation wavelength at 560 nm.
Figure 7.
Spectrally resolved photon-echo plots of Rh6G for varying coherence times at fixed population times of: A. 0 fs, B. 50 fs, C. 100 fs, D.200 fs, with excitation wavelength at 560 nm.
Figure 8.
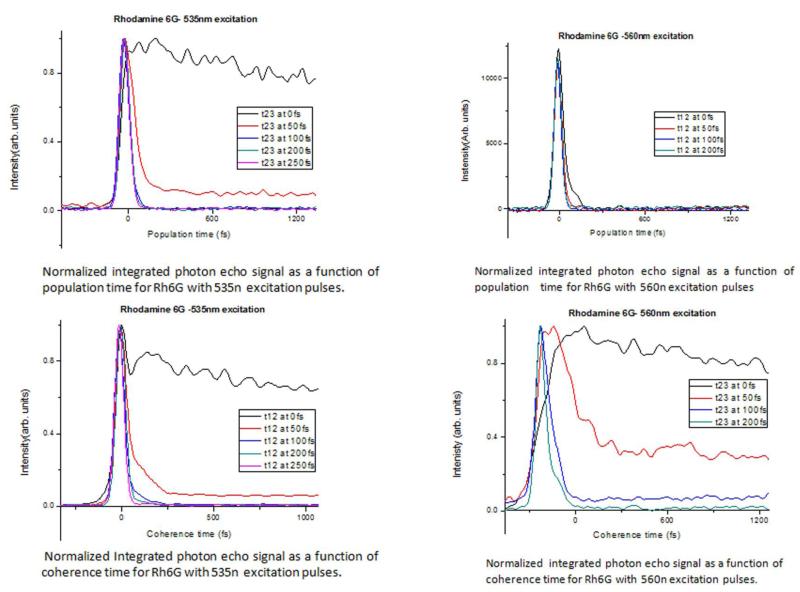
Integrated plots of photon-echo signal at two different wavelengths.
6. Coherence and population dynamics of Rh6G
Analysis of the SPRE data at fixed coherence times as a function of population time provides the dynamics of population relaxation processes. Similarly, the analysis of the SPRE data at fixed population times as a function of coherence time provides the information about the optical dephasing as well as inhomogeneous broadening caused by the spectral diffusion process. Figure 4(A-G) shows the contour plots of SRPE signal detected in the phase matching direction k4 = k3 + k2 − k1 with varying population time t23 for fixed coherence times, t12= 0, 50, 100, 200 and 250 fs. Beyond 250 fs, the SPRE signal did not show any further changes. The excitation pulse with center wavelength of 535 nm was used. At fixed t12= 0 fs, i.e. the transient grating experiment corresponding to eqn. (11), as expected from the discussions above, Figure 4(A) shows a long trailing part in the contour for all positive t23 corresponding to photon-echo contribution whereas the signal at negative t23 is due to an enhanced FID contribution corresponding to R1 and R4 response functions (Figure 3). Previous theoretical simulations of SPRE for another laser dye, Rhodamine-101, verified the experimental results of the oscillating photon-echo spectrum by simply considering the dye as a two-level system [4]. For positive population time t23 the measured signal is primarily due to the photon-echo since at positive times, the first pulse k1 striking the system generates the contributions of R2 and R3 response functions in the signal [5] (Figure 3). The temporal shift in the photon-echo signal results from the inhomogeneous broadening in the molecule [28], while the red sift in the echo spectrum results from the transfer of optical coherence from the initially excited transition. At t12= 50 fs, the long trailing part of the signal vanishes and the signal starts to decrease after population time t23= 50 fs, and is almost circular as seen in Figure 4(B). At t23=100 fs, the SRPE contour plot in Figure 4(C) almost becomes circular. At around 200 fs the SRPE contour plots starts to show two lobes as shown in Figure 4(D), which we think is due to spectral interference with scattered light. All these results are also confirmed from the integrated plot in Figure 8(A), which shows that there is only a negligible wavelength shift when the population time t23 is scanned. On the other hand, under the same excitation condition of 535 nm, when the coherence time t12 is scanned at fixed population times t23, a new set of contour plots as shown in Figure 5(A-G) are generated. In this case, at t23=0 fs the FID is seen at negative coherence times and only small oscillations are seen along the positive coherence times. At t23=50 fs, the contour becomes more circular and the signal extends up to 150 fs of coherence time and is centered near 0 fs with the intensity of the trailing partmuch reduced. Finally, at t23=100 fs, the signal becomes almost circular and extends only to 100 fs of coherence time. Beyond this 100 fs timescale, the measured signal remains the same, which is also evident from the integrated plot in Figure 8(C). Thus, the spectral diffusion for Rh6G in methanol occurs within the first 100 fs at the central wavelength of 535 nm.
When the wavelength of the excitation laser pulse is shifted to 560 nm, which is towards the absorption edge of the Rh6G spectrum in methanol, the resulting SPRE signals are quite different, except at the fixed value of t12=0 fs, while the population time t23 is scanned, a long trailing signal can be observed in the contour plot (Figure 6(A)) as in the case with 530 nm excitation. Furthermore the contour plot is slightly elliptical due to inhomogeneous broadening in the spectrum. At t12=50 fs, the SRPE contour plots becomes somewhat circular as seen in Figure 6(B) and at t12=100 fs, it becomes almost circular with the trailing part reducing to <50 fs, indicating spectral diffusion dynamics and inhomogeneous broadening (Figure 6(C)). For t12> 100 fs, no further changes are observed (Figure 6(D)), and this is also evident from the integrated plot in Figure 8(B). These results are in stark contrast to what is observed while exciting at 535 nm, which is also very easily evident from the comparison between Figure 8(A) and Figure 8(B).
Under the same excitation condition of 560 nm, when the coherence time t12 is scanned at fixed population times t23, the combined effect of inhomogeneous broadening and spectral diffusion dynamics can be obtained. At t23 = 0 fs, when the coherence times are varying, the generated signal extends for more than 300 fs as is seen in Figure 7(A). At population time t23=50 fs, the signal gets red-shifted when the coherence time t12 is varying from 0 fs to 300 fs, and beyond that the red-shifting stops (Figure 7(B)). At t23 =100 fs, the signal is maximized near the coherence time t12 = 0 fs and is elongated along the diagonal. This signal is also red shifted towards wavelengths larger than the excitation wavelength of 560 nm. At t23=200 fs, the SRPE contour plot almost becomes circular, as shown in Figure 7(D). This implies that the spectral diffusion takes place at about 200 fs, as is also evident from the integrated plot shown in Figure 8(D). The importance of the effect of the excitation wavelengths at 535 nm versus 560 nm on the nature of the coherence dynamics is clearly evident from a comparison between Figure 8(C) and Figure 8(D), which shows that the energy fluctuations occur for a much longer time in case of the excitation with longer wavelength.
7. Conclusions
Our experimental data of spectrally resolved photon-echo as a function of varying coherence and population times indicate that the spectral diffusion occurs within the first 100 fs when excited at 535 nm, which is close to the absorption maxima of Rhodamine-6G in methanol. However, when the excitation wavelength is red-shifted to the absorption of 560 nm, the spectral diffusion process gets extended to 200 fs. This indicates that the fluctuations between the energy levels occur at a much faster timescale when excited at a shorter wavelength of 535 nm as compared to the case when the excitation is at a redder wavelength of 560 nm.
Acknowledgements
We thank CSIR Graduate Fellowship and DST Swarnajayanti Fellowship (India) and the Welcome Trust International Senior research Fellowship (UK) for funding this research.
References
- 1.Mukamel S. Principles of Nonlinear Optical Spectroscopy. Oxford University Press; New York: 1995. [Google Scholar]
- 2.de Boeij WP, Pshenichnikov MS, Wiersma DA. Chem. Phys. 1998;233:287. [Google Scholar]
- 3.Shen YR. The Principles of Nonlinear Optics. Wiley-Interscience; New York: 1984. [Google Scholar]
- 4.Dao LV, Lincoln C, Lowe M, Hannaford P. J. Chem. Phys. 2004;120:8434. doi: 10.1063/1.1651057. [DOI] [PubMed] [Google Scholar]
- 5.Hannaford P, editor. Femtosecond laser spectroscopy. Springer; 2005. [Google Scholar]
- 6.Hybl JD, Ferro AA, Jonas DM. J. Chem. Phys. 2002;115:6606. [Google Scholar]
- 7.Feader SMG, Jonas DM. J. Phys. Chem. A. 1999;103:10489. [Google Scholar]
- 8.Hybl JD, Albrecht AW, Feader SMG, Jonas DM. Chem. Phys. Lett. 1998;297:307. [Google Scholar]
- 9.Albrecht AW, Hybl JD, Sarah SM, Feader SMG, Jonas DM. J. Chem. Phys. 1999;111:10934. [Google Scholar]
- 10.Mukamel S, Piryatinski A, Chernyak V. Acc. Chem. Res. 1999;32:145. [Google Scholar]
- 11.Tokmakoff A, Kwok AS, Urdahl RS, Francis RS, Fayer MD. Chem. Phys. Lett. 1995;234:289. [Google Scholar]
- 12.Penzkofer A, Leupacher W. J. Lumin. 1987;37:61. [Google Scholar]
- 13.Selanger KA, Falnes J, Sikkeland J. Phys. Chem. 1977;81:1960. [Google Scholar]
- 14.Agarwal R, Prall BS, Rizvi AH, Yang M, Fleming GR. J. Chem. Phys. 2002;116:6243. [Google Scholar]
- 15.Schäfer FP, editor. Dye Lasers. 2nd ed Springer-Verlag; Berlin: 1990. [Google Scholar]
- 16.Duarte FJ, Hillman LW, editors. Dye Laser Principles. Academic; New York: 1990. [Google Scholar]
- 17.Drexhage KH, Hansch TW, Ippen EP, Schafer FP, Shank CV, Snavely BB. Dye Lasers. Springer; Berlin: 1973. [Google Scholar]
- 18.Valdes-Aguilera O, Neckers DC. Acc. Chem. Res. 1989;22:171. [Google Scholar]
- 19.Rettig W, Strehmel B, Schrader S, Seifert H, editors. Applied Fluorescence in Chemistry, Biology and Medicine. Springer; Heidelberg: 1999. pp. 193–240. [Google Scholar]
- 20.Eggeling C, Widengren J, Rigler R, Seidel CAM. Anal. Chem. 1998;70:2651. doi: 10.1021/ac980027p. [DOI] [PubMed] [Google Scholar]
- 21.Dittrich PS, Schwille P. Appl. Phys. B. 2001;73:829. [Google Scholar]
- 22.Slavik J. Fluorescent probes in cellular and molecular biology. CRC Press; Boca Raton, FL: 1994. [Google Scholar]
- 23.Mialocq JC, Meyer M, H_bert P, Armand X, Lambert D. Opt. Commun. 1990;77:185. [Google Scholar]
- 24.Sinha S, Ray AK, Kundu S, Sasikumar S, Dasgupta K. Appl. Phys. B. 2002;75:85. [Google Scholar]
- 25.Marcano A, Urdaneta I. Appl. Phys. B. 2001;72:207. [Google Scholar]
- 26.Neporent AS, Spiro AG. Opt. Spectrosc. 1995;78:31. [Google Scholar]
- 27.Aspuland MC, Lim M, Hochstrasser RM. Chem. Phys. Lett. 2000;323:269. [Google Scholar]
- 28.Agarwal R, Prall BS, Rizvi AH, Yang M, Fleming GR. J. Chem. Phys. 2002;116:6243. [Google Scholar]


